Regular Article
Shaft Furnace Simulation by Mathematical Model Considering Coke Gasification Rate in High Temperature
2016 Volume 56 Issue 2 Pages 239-244
Details
2016 Volume 56 Issue 2 Pages 239-244
Shaft furnace (cupola) is a scrap melting furnace and it can reduce CO2 emission because it requires no reducing agents. In a shaft furnace, coke gasification reactions by CO2 and H2O are occurred in high temperature and they have great effects on coke rate in shaft furnace because they are strong endothermic reactions. So prediction of shaft furnace operation needs accurate gasification rates. In this study, first, gasification rates by CO2/N2 and H2O/N2 system were measured at 1573, 1673, 1773 and 1873 K. Diffusion coefficients in gasification rates were modified to fit experimental results. Next, one-dimensional mathematical model using modified gasification rates was developed for shaft furnace simulation. The effects of coke size and blast moisture on coke rate were calculated and compared with actual operations. Operational results were accurately predicted by the model.
The accelerating pace of global warming driven by greenhouse gases has heightened the urgency of measures to reduce CO2 emissions in the steel industry. The shaft furnace (cupola) is a promising technology for reducing CO2 emissions in the ironmaking process, as it produces molten iron by melting scrap without using reducing agents.
Figure 1 shows the concept of a shaft furnace. In a shaft furnace, scrap and coke are charged from the furnace top and oxygen-enriched blast is blown from the tuyeres. The scrap is melted by combustion of the coke, and molten iron and slag are discharged from the tap hole. In addition to the combustion reaction of coke, the main reactions include the gasification reactions of coke by CO2 and H2O shown in Eqs. (1) and (2).
| (1) |
| (2) |

Outline of shaft furnace.
These strongly endothermic reactions have a significant influence on the coke rate. Therefore, in order to predict shaft furnace operation accurately and implement operational improvements to reduce coke consumption, it is important to quantify the rates of these reactions.
The total coke gasification reaction comprises the three processes of chemical reactions, intraparticle diffusion and diffusion through gas film. The gasification rate is determined by chemical reaction rate in the low temperature region and by diffusion rate through gas film in the high temperature region. The effect of intraparticle diffusion appears in the intermediate temperature region.1) Many experimental studies have investigated the coke gasification rate,2,3,4,5,6,7,8) but they were largely limited to temperatures no higher than 1673 K, as the effects of intraparticle diffusion and diffusion through gas film at higher temperatures prevent measurement of the pure chemical reaction rate. However, the gasification reactions in a shaft furnace occur at 1773–2473 K.9) Although there are some examples of measurement of the gasification rate at 1773 K and over,10,11) knowledge of this high temperature region remains inadequate. Conventional simulations of the shaft furnace9,12,13) have generally used overall rate equations1) in which the three processes of the reactions are introduced theoretically, but again, the accuracy of this equation at temperatures over 1773 K has not been convincingly demonstrated.
In the present research, the gasification rates of coke by CO2 and H2O were measured in the high temperature region of 1573–1873 K. The experimental results were compared with the results calculated by the overall rate equations, and the equations were modified. A one-dimensional mathematical model of the shaft furnace was then developed using the modified equations. Simulations were carried out under various assumed operational conditions and the results were compared with the operational results of an actual furnace, confirming the predictive accuracy.
Figure 2 shows the experimental apparatus. The heating furnace was a Tammann furnace, in which a SSA-S tube with an inner diameter of 80 mm was used as the core tube. Supply lines for Ar gas, CO2/N2 system gas and H2O/N2 system gas were connected to the bottom of the core tube, and a rubber heater was attached to the H2O/N2 line to prevent condensation in the piping. The core tube was filled with brick and alumina balls (diameter: 10 mm, purity: 99.9%) to raise the specimen, and a thermocouple was installed at the sample height. The core tube was set on a platform scale with 0.1 g resolution.

Experimental apparatus.
The specimen material was blast furnace coke with the properties shown in Table 1. Samples were crushed and classified to the sizes of 10–11 mm, 19–20 mm and 30–35 mm. It was difficult to measure the gasification rate by conventional method in the high temperature region because bed temperature dropped sharply due to extremely rapid reaction rate. This problem was solved by mixing the coke and a mock-coke material (castable refractory) of the same particle size. This method made it possible to prevent the sharp drop in temperature while keeping gas flow in a packed bed. Ar gas was blown from the furnace bottom, and the temperature was raised to the specified temperature and held for 30 min, after which the gas supply was switched to the reaction gas. The reaction gases in this experiment were a CO2/N2 system and a H2O/N2 system. The specimen was reacted with the gas at a constant temperature, and the weight change was measured.
| Ash | VM | F.C | S | SiO2 | Al2O3 | |
|---|---|---|---|---|---|---|
| in Coke | 11.5 | 0.9 | 87.6 | 0.47 | – | – |
| in Ash | – | – | – | – | 55.2 | 26.4 |
Table 2 shows the experimental conditions. Temperatures in the range of 1573 K to 1873 K were used, and other conditions were set to approximate the gasification conditions in an actual shaft furnace as nearly as possible, given the constraints of the experimental apparatus. The gas flow rate shown in the table is the superficial velocity in the standard state.
| CO2/N2 | % | 35/65 |
| H2O/N2 | % | 35/65 |
| Coke size | mm | 10–11, 19–20, 30–35 |
| Temperature | K | 1573, 1673, 1773, 1873 |
| Gas flow rate | m/s | 0.13, 0.20, 0.27 |
Figures 3 and 4 show the change in the weight loss rates at each temperature when coke was reacted with the CO2/N2 and the H2O/N2 system gas. The weight loss rate is defined as the percentage of weight reduction relative to the initial weight of the coke. Although the same measurements were performed with each coke particle size and gas flow rate, those results will be omitted here. Figures 5 and 6 show the results of an analysis of the reaction rates under the various conditions. The plots and error bars denote the mean value and the standard deviation of the results in the each condition. From these figures, the gasification rates increase as the temperature increases, the coke size decreases and the gas flow rate increases. The dotted lines show the results of calculations by the overall rate equation reported by Yagi et al.1) The overall rate equation is shown in Eq. (3).
| (3) |
| (4) |

Temporal change of coke weight loss rate in each temperature by CO2/N2 gas.

Temporal change of coke weight loss rate in each temperature by H2O/N2 gas.
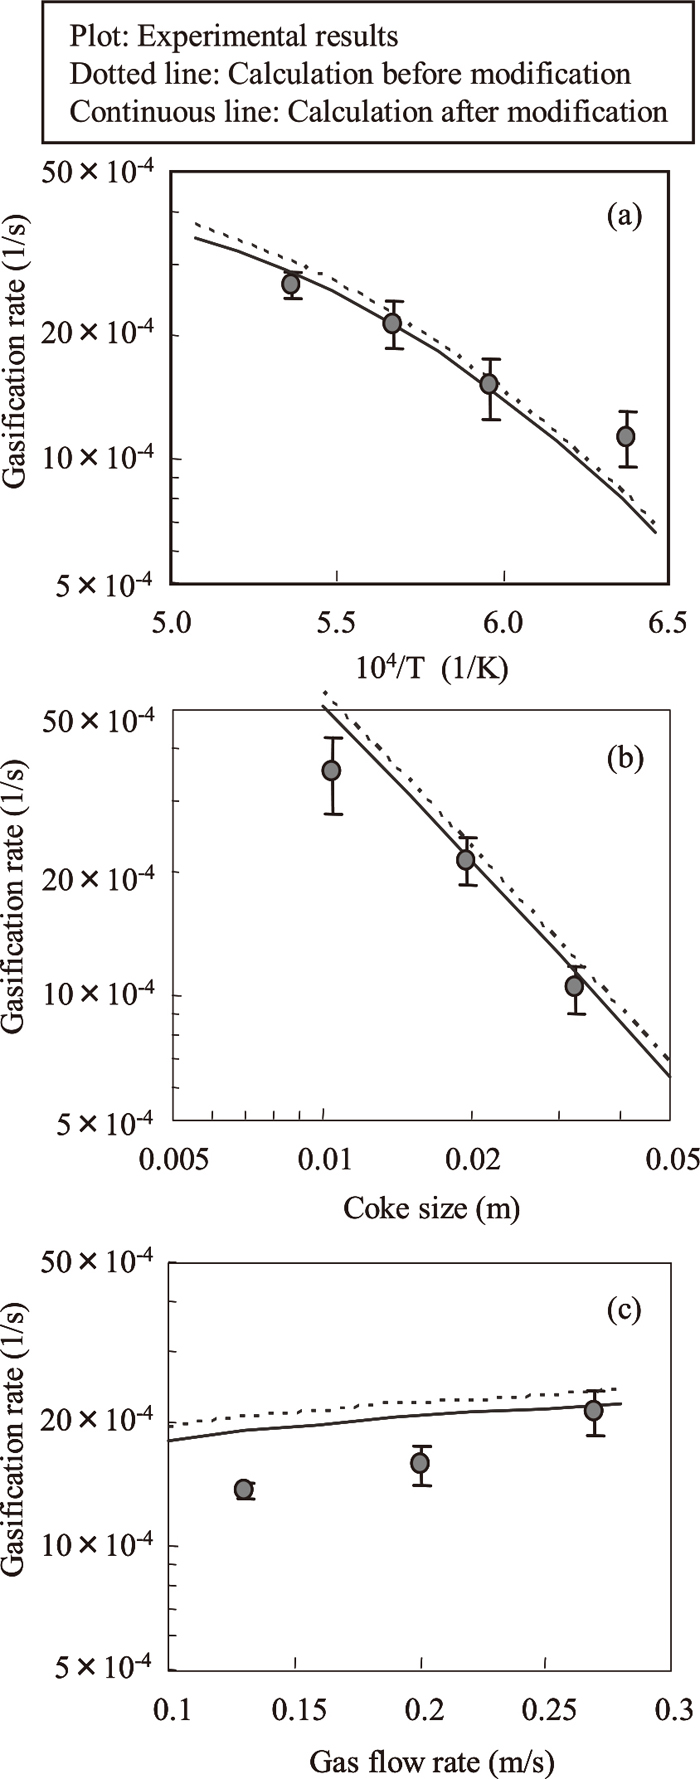
Effect of (a) temperature, (b) coke size and (c) gas flow rate on gasification rate in CO2/N2 system.
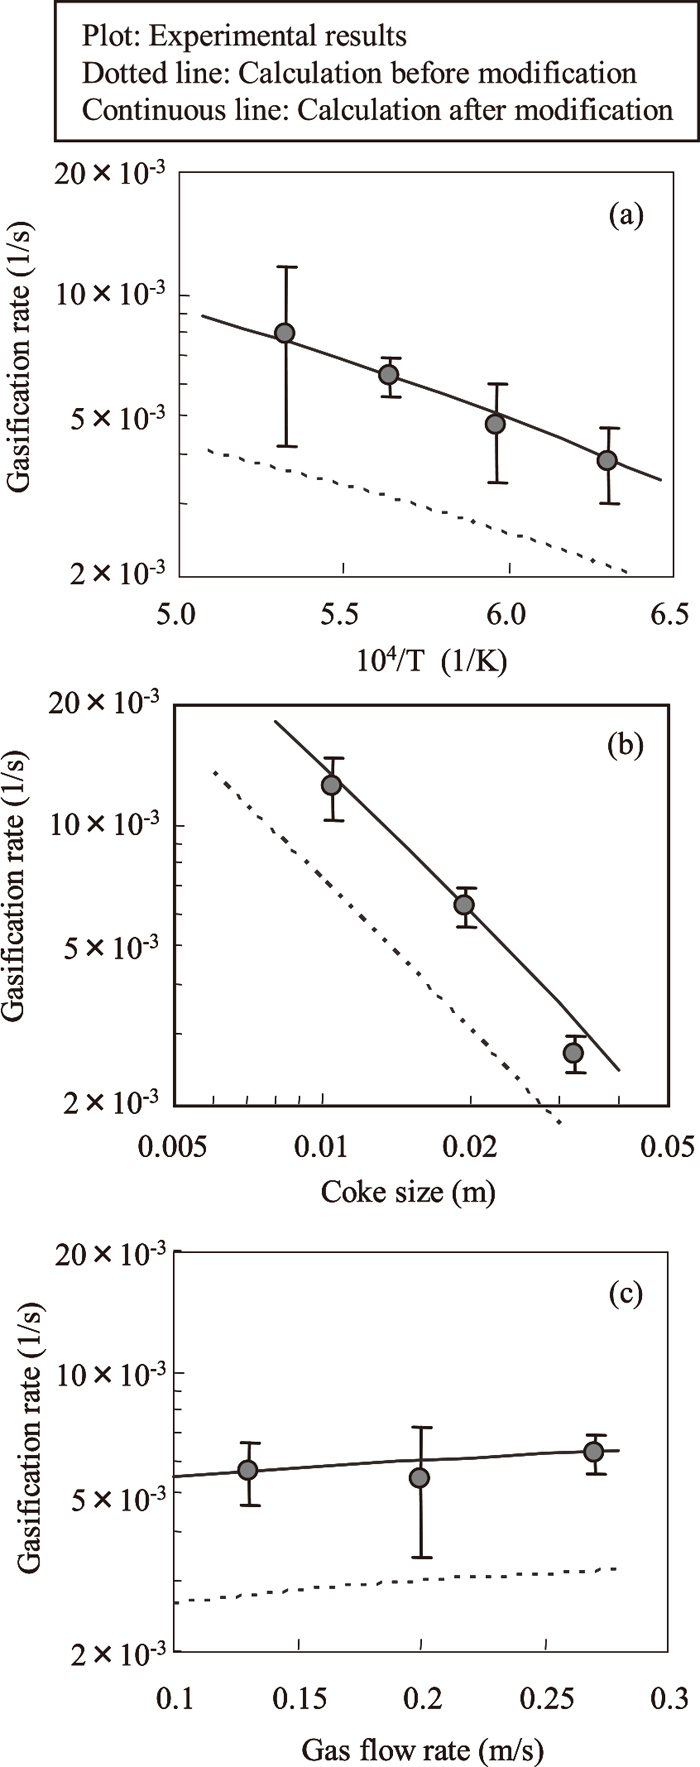
Effect of (a) temperature, (b) coke size and (c) gas flow rate on gasification rate in H2O/N2 system.
As shown in Fig. 5, the calculated results in the CO2/N2 system gas were generally slightly larger than the experimental results. Since the effect of diffusion through gas film on gasification rate is large in the high temperature region, the diffusion coefficient of CO2, which is included in kfi and Efi in Eq. (3), was reviewed to fit the calculated results to the experimental results. The diffusion coefficient can be obtained by expanding the diffusion coefficients of the two-component systems calculated by Andrussow’s equation,14) shown in Eq. (5), to a multi-component system by Wilke’s equation,15) shown in Eq. (6).
| (5) |
| (6) |
Yagi et al. presented the results of a calculation of Eq. (6) for a typical blast furnace gas composition as the diffusion coefficient of CO2, based on the assumption that changes in the gas composition in the blast furnace shaft are small, which means that changes in the diffusion coefficient due the gas composition can be disregarded.1) Since the gas composition in the present experiment was different from that in the blast furnace, Eq. (3) was recalculated using the diffusion coefficient obtained with the gas composition in this experiment. The calculated results, shown by the solid line in Fig. 5, approached the experimental results. Moreover, because the gas composition in a shaft furnace changes greatly when gasification reactions occur, the gasification rate in shaft furnace simulations should be calculated by using diffusion coefficients based on the gas compositions in each region of the furnace.
From Fig. 6, the results calculated by Eq. (3) for the H2O/N2 system gas (dotted line) were smaller than the experimental values. As in the case of the CO2/N2 system gas, the diffusion coefficient of H2O was also reviewed. Bird et al.16,17) presented parameters for estimation of the diffusion coefficient of H2O in the principle of corresponding states based on the kinetic theory of gas, which is one estimated equation for the diffusion coefficient, assuming that the diffusion coefficient of H2O shows a different tendency from that of other gases. Therefore, the diffusion coefficient of H2O was estimated by using the principle of corresponding states based on the kinetic theory of gas shown in Eq. (7) instead of by Andrussow’s equation.
| (7) |
Here, the constants c and d are c=2.745×10⁻⁴ and d=1.823 when gas A and gas B are both nonpolar gases, and are c=3.640×10⁻⁴ and d=2.334 when gas A and gas B are H2O and a nonpolar gas, respectively. The diffusion coefficient of a two-component system was obtained by applying the latter constants to Eq. (7), and the diffusion coefficient in a multi-component system was then calculated by Eq. (6). The results of a calculation of the reaction rate constants by applying this diffusion coefficient to Eq. (3) are shown by the solid line in Fig. 6. The calculated results are in good agreement with the experimental results.
A one-dimensional steady-state model for prediction of shaft furnace operation was developed. This model comprises three phases, namely, coke, metal (scrap) and gas, and considers the gas-coke and gas-metal heat exchanges and the heat loss from the furnace wall. The heat balance equation is shown by Eq. (8).
| (8) |
Equation (8) was solved by integrable discretization by Euler’s method. Here, q is heat of reaction and furnace wall heat loss. Heat loss from the furnace wall was assumed to be proportional to the gas temperature at the respective positions. Heat transfer coefficient H was obtained by the Ranz-Marshall equation,18) assuming that the scrap and coke particles are spherical. It was also assumed that scrap melts in the temperature range from 1573 K to 1723 K, and carburization occurs linearly between those two temperatures. The combustion reaction of coke and the gasification reactions of coke by CO2 and H2O were also considered. Equation (9) proposed by Iwanaga et al.10) was used to calculate the combustion reaction rate, and the equation presented in the previous chapter was used to calculate the gasification rates.
| (9) |
The calculation region was from the tuyere level to the furnace top charging level. The height direction was divided into 50 sections. In the height range of 0–2 m, a pitch width one-half that of the other sections was used in consideration of large changes in the temperature and gas composition by the rapid reaction rate in this part of the furnace.
The flow chart of the shaft furnace simulation is shown in Fig. 7. First, the conditions such as the blast and burden were input. Next, the reaction rates and heat balance were calculated repeatedly. When the temperature converged, the data such as the temperatures, gas compositions, reaction rates, etc. were output.

Flow chart of shaft furnace simulation.
Simulations were performed for different coke sizes and blast moistures, and the results were compared with the operational results of the actual furnace.
3.2. Calculation ResultsFigure 8 shows an example of the calculated temperature, gas composition and gasification rate distribution in the furnace. From the tuyere level to 1 m, the temperature rose to approximately 2773 K due to the combustion reaction, and CO2 was generated. As the O2 concentration decreased, the gasification reactions of coke by CO2 and H2O occurred, generating CO and H2, and the temperature decreased due to these endothermic reactions. In the region where the temperature was under 1573 K, the coke existence ratio was low, because scrap exists as a solid. In addition, the gasification rates were slow, because concentration of the reaction gases and temperature were low. Therefore, virtually no gasification reactions occurred in this region. In the upper furnace, only heat exchanged occurred.

Calculation results of temperature and gas composition distributions in shaft furnace.
Figure 9 shows the effect of coke size on the coke rate. As the coke size decreases, the amount of heat absorption increases due to the increase in the gasification rate, and as a result, the coke rate also increases. The plots show the operational results and the solid line shows the calculated results in Fig. 9. The calculated results reproduce the operational results with good accuracy.
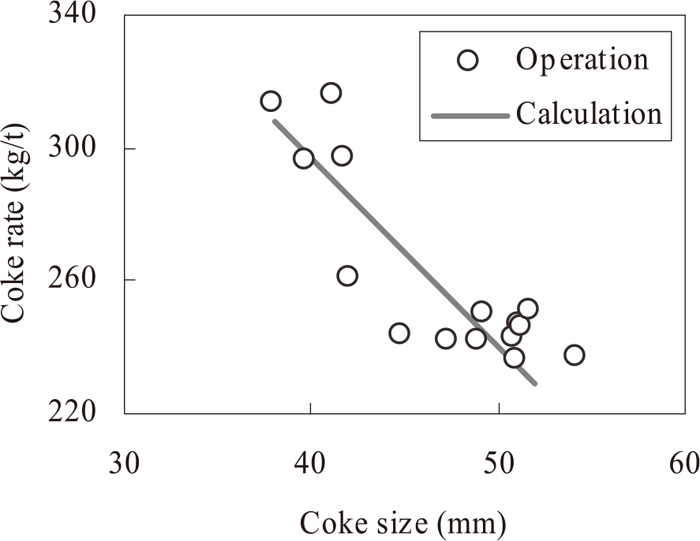
The effect of coke size on coke rate.
Figure 10 shows the effect of blast moisture on the coke rate. The moisture in atmospheric air varies seasonally by approximately 20 g/Nm3, and this difference will affect the coke rate of a shaft furnace unless a humidity control function is provided. As above, the plots are operational results and the solid line is the calculated results in Fig. 10. The influence of blast moisture on the coke rate (=Δcoke rate (kg/t)/Δblast moisture (g/Nm3)) is 0.45 in the operational results and 0.44 in the calculated results. Assuming that 1 g/Nm3 of blast moisture all reacts to form H2 in an operation with unit blast consumption of 450 Nm3/t, this endothermic reaction increases the amount of heat absorption by approximately 13 MJ/t. Since this is equivalent to the heating value of a coke rate of 0.45 kg/t, it can be thought that 100% of the blast moisture reacts to form H2 in actual shaft furnace operation. The calculated result was also close to this value, showing that actual shaft furnace operation can be simulated with good accuracy by the model.
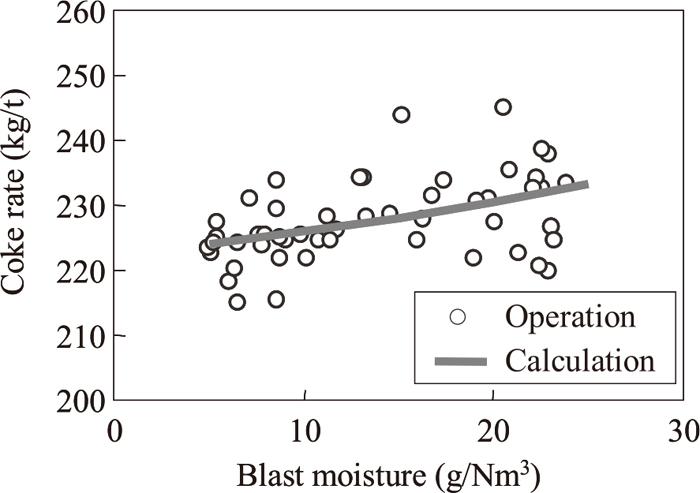
The effect of blast moisture on coke rate.
The gasification rates of coke by CO2 and H2O were measured in the high temperature region, and the conventional overall rate equations were modified for the accurate prediction of the shaft furnace operation. The one-dimensional mathematical model using the modified gasification rates was developed, and the calculation results were compared with the results of actual operation. The results of this study may be summarized as follows.
(1) The measured gasification rate of coke by CO2 could be predicted with good accuracy by obtaining the diffusion coefficient of CO2 used in the conventional overall rate equation from the gas composition in the furnace.
(2) The measured gasification rate by H2O could also be predicted accurately by calculating the diffusion coefficient of H2O used in the conventional overall rate equation by applying the parameters for a H2O-nonpolar gas system to the estimated equation by the principle of corresponding states based on the kinetic theory of gas.
(3) The effects of coke size and blast moisture on the coke rate in actual operation could be predicted with high accuracy by the mathematical model using the modified gasification rates.
Ri: Overall rate equation (kgmol/m3(bed)/s)
ρc: Coke particle density (kg/m3)
dp: Coke particle diameter (m)
φ: Coke shape parameter (-)
NC: Number of coke particles per unit volume of bed (1/m3(bed))
kfi: Mass transfer coefficient through gas film (m/s)
Efi: Effective reaction coefficient (-)
ksi: Chemical reaction rate constant (m3/kg/s)
R: Gas constant (kcal/kgmol/K)
Tc: Coke temperature (K)
P: Pressure in bed (atm)
xi: Mole fraction (-)
DAJ: Diffusion coefficient of A-J 2-component system (cm2/s)
DA: Diffusion coefficient of A in multi-component mixed gas (cm2/s)
T: Gas temperature (K)
MA, MB: Molecular weight (-)
VA, VB: Boiling point molar volume (cm3/mol)
PCA, PCB: Critical pressure (atm)
TCA, TCB: Critical temperature (K)
Gg, Gm, Gc: Mass flow rate of gas, metal and coke (kg/s)
Cpg, Cpm, Cpc: Specific heat of gas, metal and coke (kJ/kg/K)
Tg, Tm: Temperature of gas and metal (K)
z: Furnace height (m)
Hgm, Hgc: Heat transfer coefficient (kJ/s/K)
q: Reaction heat and furnace wall heat loss (kJ/s)
ksO2: Combustion reaction rate constant of coke (m/s)