Abstract
The effects of scratch, surface element composition, and relative humidity on the hydrogen permeation behavior of zinc coated steels during wet and dry cycle corrosion tests were investigated. The permeating hydrogen was measured electrochemically, and a size controlled scratch was formed on zinc coated steels with a laser machining technique. The hydrogen permeation current was observed on the zinc coated steels with a formed scratch (S-coated): no significant hydrogen permeation current was observed on the zinc coated steel without the formed scratch (NS-coated) or on steel with zinc coating removed by mechanical grinding (R-steel). The zinc corrosion products effectively reduced the hydrogen permeation current from the S-coated at low relative humidity. The total amount of permeating hydrogen per unit area of formed scratch was independent of the area of the formed scratch in wet and dry cycling.
1. Introduction
With the recent demands for increases in fuel efficiency and improvements of safety at collisions of automobiles, and reducing energy and resource use in construction industry, high strength steels are widely studied.1,2,3) It is, however, well known that increasing the strength of steels leads to increased susceptibility to hydrogen embrittlement.4,5) A reduction in susceptibility to hydrogen embrittlement of these steels has become an important issue to ensure reliability and safety in the practical use of high strength steels. Therefore, hydrogen embrittlement has attracted much attention recently.6,7,8,9,10,11,12,13,14,15,16) Matano et al.8) reported an evaluation of deformation microstructures and associated lattice defects in SUS 304 and SUS 316 L steels by positron lifetime measurements detecting vacancy-type defects created during tensile straining. Nagao et al.10) investigated the mechanism of fracture surface morphology changes at intergranular and quasi-cleavage in a hydrogen embrittled lath martensitic steel.
For the practical use of steels including high strength steels, atmospheric corrosion plays an important role in the hydrogen generation. Some studies have focused on the hydrogen generated by atmospheric corrosion inducing the hydrogen embrittlemet.17,18,19,20,21,22,23) Kushida17) has reported on the hydrogen content in steels which were exposed at several sites in Japan. Tsuru et al.18) investigated hydrogen entry and permeation into iron during atmospheric corrosion by an electrochemical method, and reported that the permeation rate during a wet and dry corrosion cycle showed a maximum during the drying process, depending on the surface pH and the corrosion potential. Ohmura et al.19) reported that temperature, relative humidity (RH), and the amount of sea salt on the steel surface strongly affected hydrogen entry and that increases in the corrosion rate enhanced hydrogen permeation.
Zinc coating is widely used to increase the corrosion resistance of steels.24,25,26) Because the atmospheric corrosion rate of zinc is more than twenty times smaller than that of steels.27) The hydrogen entry efficiency, the ratio of hydrogen permeation current/hydrogen generation current, of zinc coatings is also lower than that of the steel substrates, while high hydrogen entry efficiency has been observed at scratched areas of zinc coated steels.28) Protective coatings are liable to be scratched during use, and steel is exposed to the environment resulting in the formation of galvanic couples of the zinc coated layer and steel substrate. Such galvanic corrosion is more serious than the corrosion of the zinc coating or steel substrate alone, making it necessary to investigate the effect of scratches formed on zinc coated steels and their role in hydrogen generation and permeation behavior during atmospheric corrosion.
The purpose of this study is to investigate area effects of a formed scratch, the surface element composition, and relative humidity on the hydrogen permeation behavior of zinc coated steels during wet and dry cycle corrosion tests. A contamination free and size controlled scratch formation technique is essential to conduct these experiments, and a laser machining technique29,30) was applied to form the scratches on the zinc coated steels.
2. Experimental
2.1. Specimens
Zinc coated (coated layer thickness was about 17 μm) steel sheets were used as the specimens. To remove the zinc coating at the site for the hydrogen detection, one side of the specimens was mechanically ground under running water by SiC paper up to #800. Specimens were then cleaned for 300 s each, in highly purified water and ethanol ultrasonic baths, and following this the side for the hydrogen detection was plated electrochemically with nickel in 0.312 kmol m−3 NiSO4/0.781 kmol m−3 H3BO3 solution at 4 mA cm−2 for 720 s. To investigate the effect of the surface element composition on the hydrogen permeation behavior, specimens without formed scratches (NS-coated) and steel with zinc coating removed by mechanical grinding (R-steel) were used.
2.2. Scratch Formation
Following the treatment detailed directly above, the zinc coated specimens were irradiated with a focused Nd-YAG laser beam (wave length 532 nm, pulse frequency 10 s−1, pulse duration 8 ns, and power 20 mW at the front of the lens) in highly purified water to remove zinc coating and form the scratches. The areas of the formed scratches, S, were controlled to be from 0.3 to 1.3 mm2 by the scanning of the laser beam. Hereafter, the zinc coated steel with a formed scratch is termed S-coated.
2.3. Wet and Dry Corrosion Tests
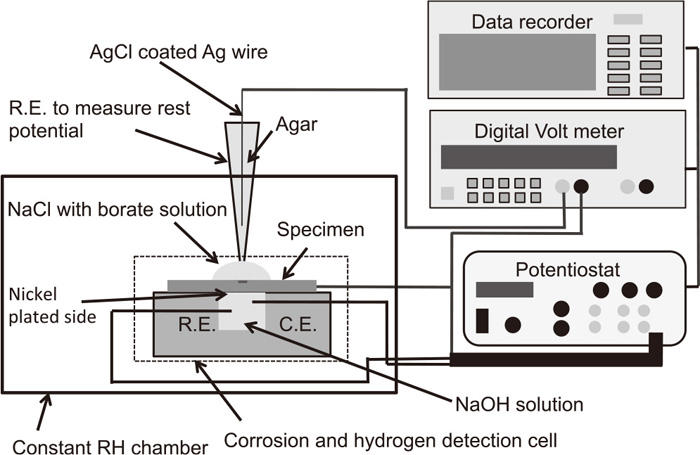
Wet and dry cycle corrosion tests were carried out in a chamber with constant relative humidity (RH) at room temperature. The RH in the chamber was controlled to be about 77%RH by saturated NaCl solution or 21%RH by silica gel. The corrosion and hydrogen detection cell used in this study was the same as that used in a previous paper.23) Figure 1 shows a schematic outline of the wet and dry corrosion test equipment. The specimens for the hydrogen detection side, the nickel plated side, were placed on (facing) the hydrogen detection cell, and then 0.2 cm3 of 1 kmol m−3 NaOH solution was added to the cell. Platinum wires were used as the counter, C.E., and reference electrodes, R.E., for the hydrogen detection cell. To measure the hydrogen, which was generated by the corrosion, and permeating through the specimens by electrochemical processes, specimens were polarized at −30 mV vs. Pt during the corrosion tests. At this applied potential, the hydrogen atoms reaching the detection side were oxidized to hydrogen ions. After the current of the hydrogen detection cell reached a sufficiently low and steady value (about 86.4 ks after the potential was applied), 10 μL of 0.01 kmol m−3 NaCl with Borate (0.5 kmol m−3 H3BO3/0.05 kmol m−3 Na2B4O7) solution was placed on the center of specimens to initiate the corrosion, and then a R.E. was inserted in the solution on the corrosion side of the specimen to measure the rest potential. The R.E. to measure the rest potential was AgCl coated Ag wire inserted in agar with 0.01 kmol m−3 NaCl with Borate solution, and the size and shape were optimized for these experiments. After drying out of the solution on the corrosion side at each cycle, a similar volume of the highly purified water was placed here to avoid concentration changes of the solution at the corrosion side. The measured rest potential shown in this paper refers to that of an Ag/AgCl electrode in saturated KCl. The sampling interval for the hydrogen permeation current and the rest potential was 1 s.
The specimen surfaces before and after the wet and dry corrosion tests were observed by an optical microscope and a scanning electron microscope, SEM, equipped with an energy dispersive X-ray spectroscope, EDS.
3. Results
3.1. Wet and Dry Corrosion at High Relative Humidity (RH)
Figure 2 shows changes in the hydrogen permeation current and rest potential at the corrosion side of the S-coated (S =1.3 mm2) specimens during the wet and dry cycle corrosion test at 77%RH. In the figure, “drop” indicates the time when solution or the highly purified water was placed on the specimen, and “drying out” indicates when the placed solution was visually observed to have dried out. It takes about 13.1 ks to dry out at this RH. In the 1st cycle, there is an initial increase in the hydrogen permeation current, then a slight decrease before there is a further increase which shows the maximum. After the maximum, the current decreases, however, it does not decrease to the initial value. In this 1st cycle, the rest potential initially decreases slowly, followed by a sharp decrease to about −1.0 V. No change in the rest potential is measured after around the point where the current showed the maximum. The volume of the solution decreased while the cell was kept in the chamber, leading to a disconnection between the R.E. and specimen. This is a possible reason why the rest potential is not measured for the full duration of the wet and dry cycles. There are two peaks (low narrow and high wide) in the hydrogen permeation current in the 2nd and 3rd cycles. As explained in Section 2.3, highly purified water was used to re-wet the corrosion side in the 2nd and 3rd cycles, suggesting that the solution concentration may have changed after adding the water. This concentration change would lead to reductions in the corrosion rate and in the hydrogen generation rate. This may be a possible reason for the low narrow peaks observed after the water placement in the 2nd and 3rd cycles. Saturated NaCl solution is used to control the RH and there may be a thin concentrated solution layer under the corrosion products or there may be salts deposited during the tests; a thin solution layer would be able to sustain the corrosion and hydrogen generation reactions. This is a possible reason why the hydrogen permeation current does not decrease to the low value it had before the start of the corrosion test.

Figure 3 shows optical microscope surface images (a) before and (b) after the wet and dry cycle corrosion tests in Fig. 2. The dark area in Fig. 3(a), before the corrosion test, is the area of steel exposed by laser machining and the surrounding lighter colored part is the zinc coated area. After the wet and dry cycle corrosion tests (Fig. 3(b)), there are white corrosion products around the scratched area.

Figure 4 shows (a) a SEM surface image, and (b)–(e) are the EDS elemental mapping results (Fe, Zn, O, and Cl) at the lighter colored area where corrosion products were shown to have formed in Fig. 3. In the EDS elemental mapping results, (c) Zn and (d) O are observed at the white area in the SEM image, while there is no Cl detected (e). From the elemental mapping results, the formed corrosion products may be assigned to ZnO or Zn(OH)2. Ohtsuka31) reported that ZnCl2[Zn(OH2)]4H2O (simonkollite) was present on zinc coated steel after long term corrosion tests in RH controlled environments, and that the simonkollite was formed at high relative humidity and high Cl– concentration conditions. A possible reason why no simonkollite was detected in this experiment is the short duration of the corrosion tests and low Cl− concentration.

To investigate the effect of the scratch and surface elemental composition at the corrosion side on the hydrogen permeation behavior, NS-coated and R-steel were subjected to wet and dry corrosion tests. Figure 5 shows the hydrogen permeation currents and the rest potentials of the NS-coated and R-steel at 77%RH. In both specimens, the rest potential changes are observed after placement of the solution: there is no significant increase of the hydrogen permeation current. This result (difference from the S-coated specimen) suggests that the formation of galvanic couples of zinc and steel plays an important role in hydrogen permeation behavior. The reason why there is no significant increase in the hydrogen permeation current on the NS-coated and R-steel will be explained in Section 4.1.
3.2. Wet and Dry Corrosion at low RH
At high RH, a remaining thin solution layer was suggested, and the hydrogen permeation behavior without any thin solution layer during the desiccated period in the corrosion tests was investigated. To examine the effect of the size of the scratch (size of cathodic reaction area) on hydrogen permeation behavior, specimens with different scratch sizes were also investigated. Wet and dry cycle corrosion tests were carried out at 21%RH, and Fig. 6 shows the hydrogen permeation currents and rest potentials of the S-coated specimens with different scratch sizes, (a) S = 0.2 mm2, (b) S = 0.5 mm2, and (c) S = 1.3 mm2, during the wet and dry cycle corrosion test at 21%RH. It takes about 3.6 ks for the solution to dry out at this RH. The R.E. to measure the rest potential was accidentally disconnected from the solution in the 3rd cycle of Fig. 6(b), and no potential data was recorded here in Fig. 6. Independent of the cycle number and area of the formed scratches, the hydrogen permeation current increases after the placement of the solution, reaches a maximum, and then decreases with the drying out of the solution. In each cycle, it finally reaches almost to the value it had before the start of the corrosion test. In some cycles, plateau regions are observed in the hydrogen permeation currents. The reason for these plateau regions in the current is not clear, and further experiments are required to elucidate the mechanism. Independent of S, the hydrogen permeation currents decrease with increasing cycle number. The rest potentials are about −1 V during the wet and dry cycle corrosion tests except for the 1st cycle of the specimens with S = 1.3 mm2. For the same reason as at the high relative humidity, no rest potential data is recorded after around the point where the current showed the maximum.
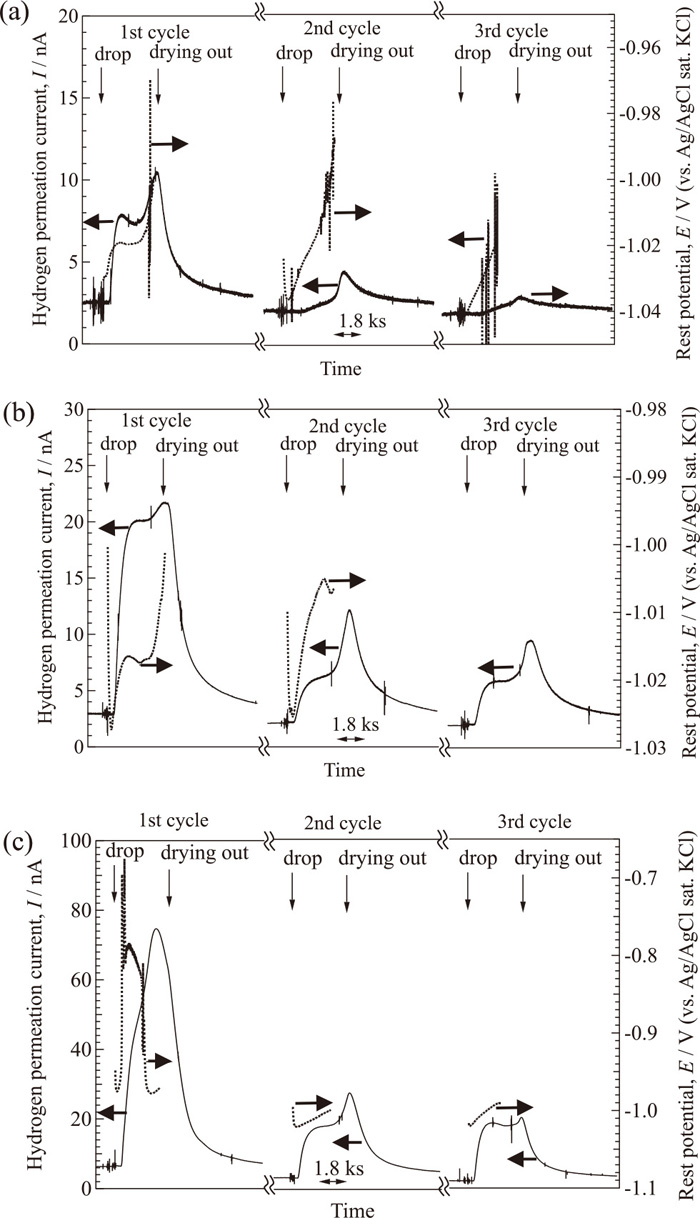
Figure 7 shows optical microscope surface images before (upper row) and after (lower row) the wet and dry cycle corrosion tests in Fig. 6. The dark areas in the specimens before the corrosion tests are the areas of steel exposed by laser machining and the surrounding lighter colored parts are the zinc coated areas. After the corrosion tests, there are white corrosion products around and on the formed scratches. Fujita et al. reported that zinc corrosion products inhibit the corrosion reaction of the steel substrate.24) This means that the cathodic reaction, the hydrogen generation reaction, on the steel substrate may be suppressed by the deposition of the white corrosion products, leading to decreases in the permeated hydrogen volume. This is a possible reason for the decrease in the hydrogen permeation current in the succeeding wet and dry corrosion cycles in Fig. 6.
4. Discussion
4.1. Effect of the Surface Condition on the Hydrogen Permeation Behavior
Figure 8 shows the hydrogen permeation current on S-coated, NS-coated, and R-steel as a function of the rest potential. The rest potential of the S-coated and R-steel show large differences without any great differences in the hydrogen permeation current. The hydrogen permeation currents of the S-coated specimens increase with decreasing potential, and the calculated slopes around −0.8 V show good agreement with the Tafel slope of the hydrogen generation reaction (Volmer reaction),
H
2
O+
e
-
⇄
H
ad
+
OH
-
.32) This result suggests that the hydrogen evolution reaction may be the rate determining step of the hydrogen permeation of S-coated specimens.
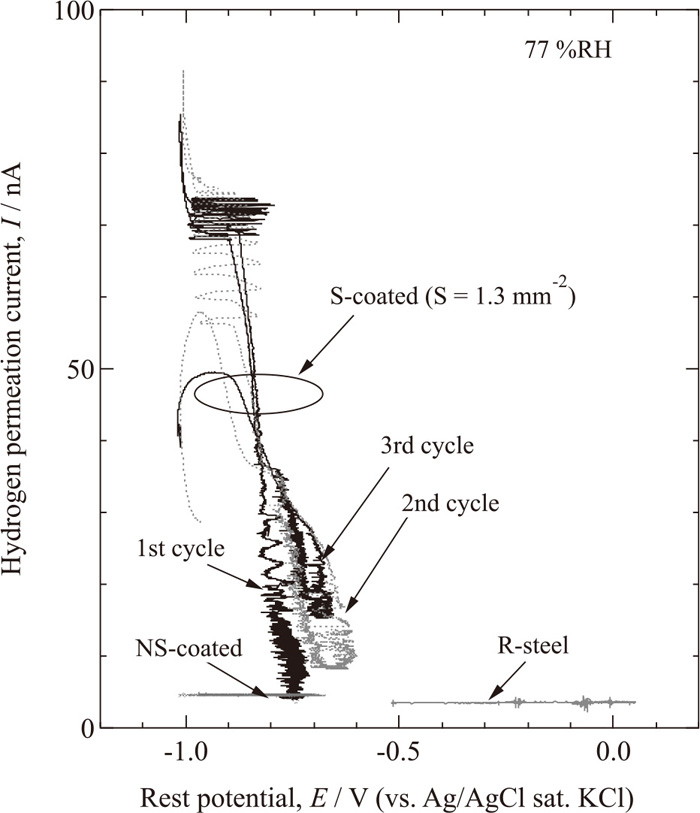
Figure 9 shows a schematic representation of the polarization curves (Tafel plots) of the possible anodic and cathodic reactions on the specimens. The hydrogen generation current on the steel and on the zinc coating may change with the potential as suggested by the dashed lines. In the figure, ER-steel, ES-coated, and ENS-coated are the potentials during the tests here of the R-steel, S-coated, and NS-coated specimens. The filled circles in the figure are the hydrogen generation currents of the specimens, and iR-steel, iS-coated, and iNS-coated are the estimated hydrogen generation currents. Based on the noise level of the measured hydrogen permeation currents in this study, the current resolution for hydrogen detection of the equipment here is about 4 nA cm−2. The hydrogen entry efficiency, the ratio of hydrogen permeation current/hydrogen generation current (%), of the zinc coated steel without a formed scratch is about 0.02% and the entry efficiency of the steel with the zinc coating removed by mechanical grinding is about 1%.28) If the hydrogen generation reaction on the steel substrate follows the Volmer reaction, the iR-steel would be about three orders of magnitude smaller than iS-coated. This very small hydrogen generation current on the R-steel makes an accurate measurement of hydrogen permeation current difficult. If the hydrogen generation reaction on the Zn (zinc coating) also follows the Volmer reaction, the iNS-coated would be about one order of magnitude smaller than the iS-coated. The small hydrogen entry efficiency and small iNS-coated of the NS-coated specimens are possible reasons why no significant hydrogen permeation current is observed.
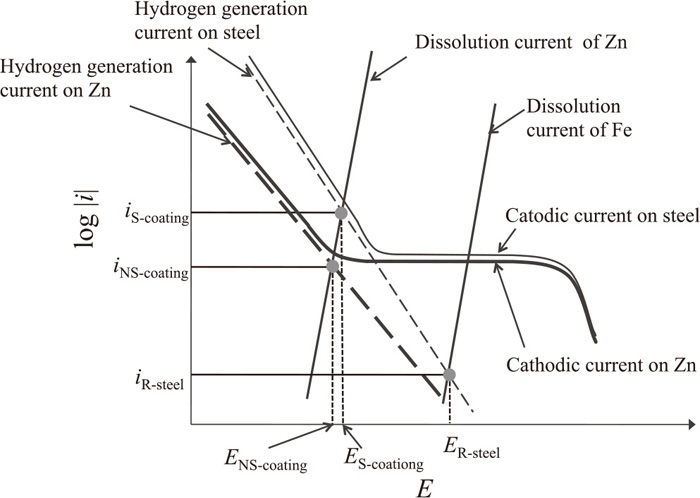
Figure 10 shows the hydrogen permeation current on S-coated specimens with different areas of formed scratches, (a) S = 0.2 mm2, (b) S = 0.5 mm2, and (c) S = 1.3 mm2 as a function of the rest potential at 21%RH. There are no clear current decreases with the rest potential, and the results are clearly different from the results in Fig. 8. From Figs. 2 and 6, the required time for drying out at 21%RH is about one quarter that of the drying out at 77%RH. This results in the rapid rest potential change and the lower rest potential immediately after placement of the solution on the specimens. The specimens with S = 0.2 mm2 and 0.5 mm2 also show low potentials immediately after solution is placed around the scratch because of the large anodic reaction area under the droplet. The rapid potential change is a possible reason for the current vs. potential relationship observed in Fig. 10.

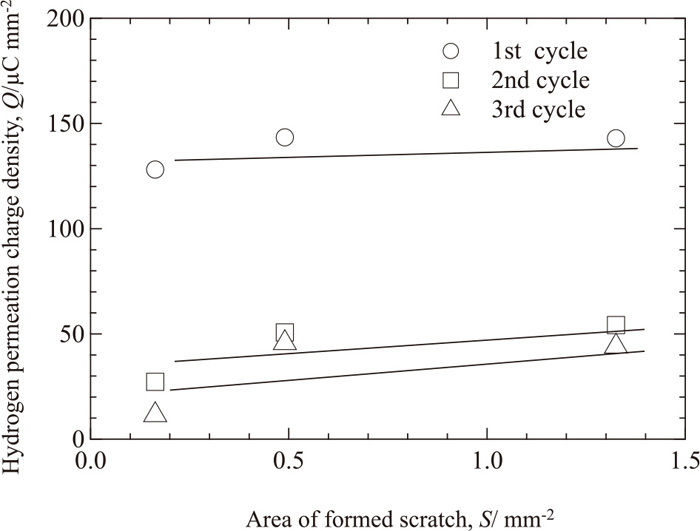
Figure 11 is a plot of the total amount of the hydrogen permeation current during each of the wet and dry cycles divided by the area of the formed scratch (hydrogen permeation charge density) as a function of the area of the formed scratch, S, at 21%RH. The charge density of a cycle does not depend on S. This result suggests that the hydrogen generation rate on a unit area of exposed steel substrate does not change with the exposed area of zinc coating, and also suggests that the rate determining step of hydrogen permeation on S-coated specimens during wet and dry corrosion is the hydrogen generation reaction at the steel substrate of the formed scratch.
5. Conclusions
The effect of surface conditions and relative humidity on the permeation behavior of hydrogen during wet and dry cycle corrosion of zinc coated steels was investigated electrochemically. The hydrogen permeation current was observed on zinc coated steels with a formed scratch (S-coated) during wet and dry cycle corrosion tests, there were no significant increases in the hydrogen permeation current on zinc coated steel without a formed scratch (NS-coated) and steel with the zinc coating removed by mechanical grinding (R-steel). The total amount of permeated hydrogen from one wet and dry cycle per unit area, the hydrogen permeation charge density, at a formed scratch is independent of the area of the formed scratch, indicating that the rate-determining step for hydrogen permeation in the tests performed in this study is the hydrogen generation reaction on the steel substrate exposed by the formed scratch.
Acknowledgement
This work was carried our as a part of the activity of the research group “Comprehensive Understanding of Hydrogen-passive Surface on Steels for Prevention of Hydrogen Embrittlement” in The Iron and Steel Institute of Japan.
References
- 1) N. Fujita, K. Kusumi, K. Matsumura, T. Nonaka and T. Tomokiyo: Shinnittetsu Giho, 393 (2012), 99.
- 2) Y. Tanaka and S. Fujita: JFE Giho, 16 (2007), 1.
- 3) Y. Mukai: Kobe Steel Eng. Rep., 55 (2005), 30.
- 4) S. Matsuyama: Delayed Fracture, Nikkan Kogyo Shimbun, Ltd., Tokyo, (1989), (in Japanese).
- 5) S. Matsuyama: Tetsu-to-Hagané, 80 (1994), 679 (in Japanese).
- 6) T. Michler, Y. Lee, R. P. Gangloff and J. Naumann: Int. J. Hydrogen Energ., 34 (2009), 3201.
- 7) K. Ebihara, T. Iwamoto, Y. Matsubara, H. Yamada, T. Okamura, W. Urushihara and T. Omura: ISIJ Int., 54 (2014), 153.
- 8) H. Hatano, M. Fujinami, K. Arai, H. Fujii and M. Nagumo: Acta Mater., 67 (2014), 342.
- 9) M. Koyama, H. Springer, S. V. Merzlikin, K. Tsuzaki, E. Akiyama and D. Rabbe: Int. J. Hydrogen Energy, 39 (2014), 4634.
- 10) A. Nagao, C. D. Smith, M. Dadfarnia, P. Sofronis and I. M. Robertson: Procedia Mater. Sci., 3 (2014), 1700.
- 11) T. Matsuno, Y. Sekito, E. Sakurada, T. Suzuki, K. Kawasaki and M. Suehiro: ISIJ Int., 54 (2014), 2369.
- 12) A. Nagao, M. L. Martin, M. Dadgarina, P. Sofronis and I. M. Robertson: Acta Mater., 74 (2014), 244.
- 13) D. Hirakami, T. Manabe, K. Ushioda, K. Noguchi, K. Takai, Y. Hata, S. Hata and H. Nakashima: Tetsu-to-Hagané, 101 (2015), 59.
- 14) T. Michler, J. Naumann, M. Hock, K. Berreth, M. P. Balogh and E. Sattler: Mater. Sci. Eng. A, 628 (2015), 252.
- 15) I. Park, S. Lee, H. Jeon and Y. Lee: Corros. Sci., 93 (2015), 63.
- 16) P. R. Sere, M. Zapponi, C. I. Elsner and A. R. Di Sali: Corros. Sci., 40 (1998), 1711.
- 17) T. Kushida: ISIJ Int., 43 (2003), 470.
- 18) T. Tsuru, Y. Huang, M. R. Ali and A. Nishikata: Corros. Sci., 47 (2005), 2431.
- 19) T. Omura, T. Kudo and S. Fujimoto: Mater. Trans., 47 (2006), 2956.
- 20) S. Li, Z. Zhang, E. Akiyama, K. Tsuzaki and B. Zhang: Corros. Sci., 52 (2010), 1660.
- 21) E. Akiyama, K. Matsukado, M. Wang and K. Tsuzaki: Corros. Sci., 52 (2010), 2758.
- 22) E. Akiyama, S. Li, T. Shinohara, Z. Zhang and K. Tsuzak: Electrochim. Acta, 56 (2011), 1799.
- 23) S. Takagi and M. Sakairi: Zairyo-to-Kankyo, 60 (2011), 435.
- 24) S. Fujita and D. Mizuno: Corros. Sci., 49 (2007), 211.
- 25) N. C. Hosking, M. A. Strom, P. H. Shipway and C. D. Rudd: Corros. Sci., 49 (2007), 3669.
- 26) A. Nishikata: J. Surf. Fini. Soc. Jpn., 62 (2011), 2 (in Japanese).
- 27) T. Shinohara: J. Surf. Fini. Soc. Jpn., 62 (2011), 25 (in Japanese).
- 28) M. Sakairi: Zairyo-to-Kankyo, 64 (2015), 66 (in Japanese).
- 29) M. Sakairi, A. Kageyama and T. Kikuhci: Corros. Sci. Technol., 9 (2010), 29.
- 30) M. Sakairi, M. Uchida and T. Kikuchi: Ziaryo-to-Kankyo, 59 (2010), 379.
- 31) T. Ohtsuka: Research Report for Fundamentals of Corrosion Protection and Evaluation Methods on Zinc and Zinc Alloy Coated Steels, ISIJ, Tokyo, (2005), 471. (in Japanese)
- 32) E. Tada and T. Tsuru: Bull. Iron Steel Inst. Jpn., 17 (2012), 699 (in Japanese).