Regular Article
Modelling of Static Recrystallization Behavior of High Manganese Austenitic Steels with Different Alloying Contents
2016 年 56 巻 6 号 p. 1038-1047
詳細
2016 年 56 巻 6 号 p. 1038-1047
During hot rolling, austenite recrystallization determines the grain size evolution and the extent of strain accumulation, and therefore, it can be used to control the microstructure and improve the mechanical properties of the final product. However, at the moment, experimental data and models describing the recrystallization kinetics of high-Mn steels are scarce, and they do not take into account the effect of the different C and Mn alloying contents usually present in these steels. The aim of this work is to provide a quantitative model for the determination of the static recrystallization kinetics and recrystallized grain size that is valid for a wide range of high-Mn steel compositions. In order to do this, softening data determined in previous works for steels with different Mn (20 to 30%), Al (0 to 1.5%) and C (0.2 to 1%) levels were considered. In addition, new tests were carried out to determine the effect of deformation conditions on the static softening kinetics and the recrystallized grain size. The static recrystallization kinetics of the high-Mn steels follows Avrami’s law, with n Avrami exponents which are temperature dependent and lower than those determined for low C steels. A dependence of the t0.5 (time for 50% fractional softening) on the carbon content has been observed and it was incorporated into an equation for the calculation of this parameter. An expression that is valid for predicting the recrystallized grain size as a function of deformation conditions is also proposed.
In recent years, the requirements of environmental legislation on the automotive sector have led to the development of lighter materials and to the improvement of existing ones. The aim of these advances is to reduce fuel consumption and the emission of environmentally harmful gases, taking into account the safety and comfort of the passengers. Along with other steels, high-Mn steels, also known as TWIP (TWinning Induced Plasticity) steels, have shown an excellent combination of strength and ductility and an extraordinary capacity to absorb energy in the case of impact.1,2,3) The good mechanical property combination of TWIP steels is usually attributed to the occurrence of twinning during deformation.4) However, the mechanical behavior of these steels depends strongly on their Stacking Fault Energy (SFE), and this can be affected by the amount of alloying elements present in the composition. Most authors report that stable fully austenitic microstructures with TWIP properties have a SFE in the range of 20 mJ/m2 to 30 mJ/m2, while lower SFE values lead to the undesirable γ→ε phase transformation. Many works have analyzed the effect of alloying elements (e.g., C, Mn, Si, Al) on the austenite stability and room temperature deformation mechanisms, showing that a wide range of mechanical properties and microstructural characteristics can be obtained by including different amounts of specific alloying elements.5,6)
In order to stabilize room temperature austenite, manganese addition levels in the range of 15 to 30% are employed.4) Lower Mn contents lead to the formation of α’ martensite, which impairs formability,7) while Mn contents higher than 30–35% have been reported to promote the formation of brittle phases.7,8) Carbon is also employed to stabilize room temperature austenite phase, especially in the case of TWIP steels with low Mn contents.4) However, increasing carbon can lead to the formation of M3C and therefore this is limited typically to levels lower than 1.2%.8) Al additions, typically lower than 3% mass,7) increase the SFE and therefore strongly suppress the γ→ε phase transformation.5) They also avoid the formation of M3C carbides8) and can suppress delayed fracture in press-formed parts.9) Addition of microalloying elements such as Nb, Ti or V has been proposed as an ideal mechanism for increasing the relatively low yield strength of TWIP steels, which can limit their applicability for some automotive applications.3,10)
However, in order to introduce TWIP steels with superior mechanical properties, the routes and parameters of thermomechanical processing should also be optimized. To do this, quantitative models that predict the evolution of the austenite microstructure during hot deformation must be developed. For instance, grain size evolution and the extent of strain accumulation during hot rolling can only be controlled if the static recrystallization kinetics and the effect of deformation parameters on the recrystallized microstructures are known. In addition, static softening can also affect the flow stress levels, and therefore, the rolling loads.
Some works have already analyzed the hot working and static softening behavior of high-Mn steels. It has been shown that the activation energies of hot deformation are higher11,12,13,14) and their static softening kinetics is retarded for these steels compared to plain C–Mn steels.13,15) Although some empirical equations that predict the softening kinetics of high-Mn steels have been published by Hamada et al. for 0.1%C-25%Mn steels with different Al levels,13,15) and more recently by Somani et al.14) for various 0.6%C-20%Mn-(1.5-5%Al) steels, the effect of varying C or Mn levels in the range of those typically employed in these steels has not been investigated in depth. In addition, very few data are also available concerning the effect of deformation conditions on the recrystallized grain size.15)
In previous works16,17) we analyzed the effect of strain-induced precipitation kinetics and steel composition on the softening behavior of high-Mn steels with different Mn (20 to 30%), Al (0 to 1.5%) and C (0.2 to 1%) levels, some of these microalloyed with V and Nb. As is usually reported, strain-induced precipitation leads to a large softening retardation, as well as to a significant contribution of recovery to the softening kinetics. However, in the absence of strain-induced precipitation, the fractional softening determined by the 2% offset method correlated well with the recrystallized fraction. In this work, an additional set of tests has been carried out in order to study the effect of deformation conditions (strain and strain-rate) on the softening kinetics of these steels. Taking into account all the available experimental data, a quantitative model for predicting the recrystallization kinetics that is valid for high-Mn steels with a wide range of alloying levels has been developed. Quenching treatments have also been carried out in order to analyze the effect of deformation conditions on the statically recrystallized grain size.
The chemical compositions of the steels analyzed (mass%) are presented in Table 1, along with the soaking temperatures employed in the tests and the initial austenite grain sizes measured from quenched specimens. Two sets of laboratory casts with different base compositions (30%Mn and 20%Mn-1.5%Al) were selected. The 30%Mn steels present a constant microalloying addition of 0.1%V and different carbon and nitrogen contents, while the 20%Mn steels present a constant carbon level of 0.6%, and one is microalloyed with V and another with Nb.
| Steel | Mn | Al | C | V | N | Nb | TSoak (°C) | D0 (μm) |
|---|---|---|---|---|---|---|---|---|
| 20Mn-base | 20.6 | 1.5 | 0.61 | – | ~0.005 | – | 1200 | 44±6 |
| 20Mn-0.1V | 21.0 | 1.5 | 0.63 | 0.10 | ~0.005 | – | 1250 | 38±3 |
| 20Mn-0.1Nb | 20.3 | 1.2 | 0.63 | – | 0.003 | 0.11 | 31±2 | |
| 30Mn-0.2C-lowN | 29.3 | – | 0.19 | 0.10 | 0.005 | – | 1150 | 23±1 |
| 30Mn-0.2C-highN | 29.2 | – | 0.19 | 0.10 | 0.022 | – | 28±1 | |
| 30Mn-0.6C-lowN | 29.2 | – | 0.56 | 0.10 | 0.005 | – | 30±2 | |
| 30Mn-0.6C-highN | 29.2 | – | 0.58 | 0.09 | 0.025 | – | 25±1 | |
| 30Mn-1C | 31.5 | – | 1.06 | 0.12 | 0.009 | – | 34±2 |
Double-hit torsion tests were performed in order to study the static softening kinetics of the steels. The geometry of the torsion specimens was a reduced central gauge section that measured 16.5 mm in length and 7.5 mm in diameter. The specimens were first soaked at temperatures ranging from 1150 to 1250°C for 10 min in order to dissolve the microalloying elements. Next, a roughing pass of ε=0.3 was applied at 1150°C to obtain a refined recrystallized microstructure. Finally, the specimens were cooled down to the deformation test temperature. Once the deformation temperature was reached, the specimens were deformed unloaded and held for increasing times before reloading again up to ε=0.1. In the tests, different strain and strain-rate conditions were employed (see Table 2). The softening kinetics was determined from the stress-strain curves using the 2% offset method.18) It must be mentioned that the results of some of these tests were already shown in previous works.16,17)
| Steel | C (mass%) | Nbsol (mass%) | Vsol (mass%) | D0 (μm) | Tdef (°C) | ε |
(s−1) | t0.5 (s) | n | DSRex (μm) |
|---|---|---|---|---|---|---|---|---|---|---|
| 20Mn-base | 0.61 | – | – | 44±6 | 1100 | 0.36 | 1 | 2.1 | 1.10 | – |
| 1000 | 6.4 | 0.96 | – | |||||||
| 950 | 15.6 | 0.85 | – | |||||||
| 900 | 58.7 | 0.71 | – | |||||||
| 1000 | 0.20 | 36.8 | 0.74 | – | ||||||
| 20Mn-0.1Nb | 0.63 | 0.041 | – | 31±2 | 1100 | 0.36 | 1 | 2.4 | 0.98 | 17±2 |
| 1050 | 4.1 | 0.86 | – | |||||||
| 20Mn-0.1V | 0.63 | – | 0.1 | 38±3 | 1100 | 0.36 | 1 | 1.9 | 1.20 | – |
| 1000 | 6.9 | 0.78 | – | |||||||
| 900 | 37.2 | 0.66 | – | |||||||
| 30Mn-1C | 1.06 | – | 0.12 | 34±2 | 1100 | 0.36 | 1 | 0.6 | 0.66 | – |
| 1000 | 3.7 | 0.71 | – | |||||||
| 30Mn-0.2C-lowN | 0.19 | – | 0.1 | 23±1 | 1100 | 0.36 | 1 | 2.34 | 1.00 | – |
| 1000 | 13.7 | 0.97 | – | |||||||
| 900 | 83 | 0.68 | – | |||||||
| 850 | 245 | 0.68 | – | |||||||
| 800 | 590 | 0.32 | – | |||||||
| 30Mn-0.2C-highN | 0.19 | – | 0.1 | 28±1 | 900 | 0.36 | 1 | 92.5 | 0.68 | – |
| 850 | 264.4 | 0.53 | – | |||||||
| 30Mn-0.6C-lowN | 0.56 | – | 0.095 | 30±2 | 1100 | 0.36 | 1 | 1.7 | 0.94 | 17±1 |
| 1000 | 7.6 | 0.73 | – | |||||||
| 900 | 42.8 | 0.65 | – | |||||||
| 850 | 66.1 | 0.59 | – | |||||||
| 800 | 204 | 0.54 | 14±1 | |||||||
| 1000 | 0.16 | 1 | 60.6 | 0.73 | 21±1 | |||||
| 0.26 | 14.6 | 0.76 | – | |||||||
| 0.36 | 0.1 | 17.7 | 0.97 | – | ||||||
| 5 | 5.9 | 0.74 | – | |||||||
| 30Mn-0.6C-highN | 0.58 | – | 0.094 | 25±1 | 1100 | 0.36 | 1 | 1.6 | 0.87 | 15±1 |
| 1000 | 7.4 | 0.67 | – | |||||||
| 800 | 347 | 0.30 | – | |||||||
| 1100 | 0.16 | 15.3 | 0.87 | 24±1 | ||||||
| 0.26 | 3.8 | 0.88 | 18±1 | |||||||
| 0.36 | 0.1 | 4.5 | 0.73 | – | ||||||
| 5 | 1.9 | 0.84 | – |
Several specimens were water quenched after the roughing step to determine the initial grain size before the tests, and after deformation and selected holding times to study the effect of deformation conditions on the recrystallized microstructure. Analysis of the quenched samples was carried out on a section corresponding to 0.9 of the outer radius of the torsion specimen, also known as the sub-surface section.19) The quenched specimens were examined via Electron BackScatter Diffraction (EBSD). Orientation imaging was done on a Philips XL30cp scanning electron microscope with W-filament, using TSL equipment. The scans were made over a regular hexagonal grid, using step sizes of 0.5–1.5 μm and analysis areas of 600×600 μm2 for initial grain size determination and a step size of 0.5 μm and analysis areas of 250×250 μm2 for recrystallized grain size measurement. Between 3 and 9 scans were recorded for each condition. These were analyzed using TSL OIMTM Analysis 4.6 software. The critical boundary angle used for grain definition was 5° misorientation and coherent twin boundaries were excluded from the analysis. The grain size was calculated as the Mean Equivalent Diameter, considering a minimum of 5 μm for initial grain size and of 2.5 μm for recrystallized grain size determination.
A previous analysis showed that, for the steels investigated, strain-induced precipitation resulted in a large softening retardation and in a major contribution of recovery to the measured fractional softening.16) When the microalloying elements remained in solid solution, a good correlation between the softening determined by the 2% offset method and the recrystallized fraction was observed. Therefore, only the softening data obtained in the absence of strain-induced precipitation will be considered modeling recrystallization kinetics. Figures 1(a) and 1(b) show examples of the softening determined at such conditions for the steels investigated at constant deformation temperatures of 1100°C and 1000°C, respectively.

Softening kinetics determined for the steels analyzed at constant deformation temperature: (a) 1100°C, (b) 1000°C.
From Fig. 1, it can be noted that at 1100°C and 1000°C similar softening kinetics are obtained for the 20Mn-base, 20Mn-0.1V and 20Mn-0.1Nb steels. This indicates that the microalloying addition in solid solution does not affect the softening kinetics of these high-Mn steels. The softening curves obtained for the 30Mn-0.6C steels are also similar, which implies that modifying N content or the base composition from 20%Mn-1.5%Al to 30%Mn does not affect the softening either. Only a slight softening acceleration is observed for the 30Mn-1C steel at both temperatures, while at 1000°C the softening is slightly retarded for the 30Mn-0.2C-low N steel. In the absence of strain-induced precipitation, similar trends were observed at the rest of the temperatures investigated.17)
As the figure illustrates, the experimental data follow a sigmoidal shape and can be described by an Avrami type equation:
| (1) |
| (2) |
Figures 2 and 3 show examples of the effect of strain and strain-rate on the softening curves, respectively. As is usually reported in the literature, increasing both leads to faster softening kinetics. However, the effect of strain-rate is less significant. While increasing the strain rate from

Effect of strain on the softening curves for the 30Mn-0.6C-lowN steel at 1000°C.

Effect of strain-rate on the softening curves for the 30Mn-0.6C-highN steel at 1100°C.
From the available softening curves, the experimental t0.5 values were determined and the n Avrami exponents were calculated as the slope of the linear regression of the log(ln(1/1−X)) versus log(t) data. The results obtained are summarized in Table 2.
3.2. Recrystallized MicrostructureThe results of the initial and recrystallized grain size measurements carried out from quenched specimens have been also included in Table 2. Except for the 30Mn-0.6C-highN steel at the lowest strain level (ε=0.16), in all the cases the recrystallized microstructure is refined compared to the initial one. In addition, increasing the applied strain leads to austenite grain size refinement. For instance, for the 30Mn-0.6C-highN steel, increasing the strain from ε=0.16 to ε=0.36 results in a grain size decrease from DSRex=24 to DSRex=15 μm. The effect of deformation temperature is less clear. For the 30Mn-0.6C-lowN steel, at constant deformation conditions (ε=0.36), reducing the deformation temperature from 1100°C to 800°C results in a slight grain size refinement, from DSRex=17 μm to DSRex=14 μm. However, the grain size decrease is rather small, and taking into account the large test temperature difference and the experimental error, this was not considered relevant.
Figure 4 shows the experimentally determined values of log(t0.5) plotted against log(ε) for tests carried out at constant deformation temperatures. The slope of the regression lines of the data in Fig. 4 corresponds to the p parameter (strain exponent) in Eq. (2). As shown in the figure values of p=2.6 and p=2.8 were determined for the steels investigated, with no significant effect of steel composition or deformation temperature. These values are very close to those determined by Hamada et al.,15) p=2.7, for a 25Mn-0.16C-1Al TWIP steel and more recently by Somani et al.,14) p≈3, for various 20Mn-0.6C-(1.5-5)Al steels. Although there is more dispersion, these values are also in the range of those reported for plain low C and microalloyed steels, from p=1.5 to p=4,22,23,24,25,26) and stainless steels, from p=1.5 to p=3.27,28,29) Several authors have proposed a dependence of this parameter on the initial grain size, but due to the narrow range of initial grain sizes obtained in this work (see Table 1) it was not possible to study this dependence. However, the p values predicted by the equations proposed in references22) and30) considering the experimental initial grain sizes measured in the present work range from 3.1 to 3.5 and from 2.3 to 2.5, respectively, therefore close to the determined values.

Effect of strain on the t0.5 parameter for the 20Mn-base and 30Mn-0.6C steels.
Similarly, the strain-rate exponent q in Eq. (2) can be calculated from the slopes of the regression lines of the log(t0.5) versus

Effect of strain-rate on the t0.5 parameter for 30Mn-0.6C steels.
As is usually reported, the value of q is lower than p, which indicates that strain exerts a larger effect on the static softening kinetics than strain-rate. Due to this, in some of the recrystallization kinetics models proposed the effect of strain-rate is neglected.25) However, in other cases q values in the range of those determined here have been reported, both for low C–Mn (q=0.33 to 0.53)24,26,30) and austenitic stainless steels (q=0.375 to 0.42).28,29) The values obtained are also very close to the values of q≈0.3 reported by Hamada et al.15) for a 25Mn-1Al TWIP steel and by Somani et al.14) for 20Mn-0.6C-(1.5-5)Al steels.
4.1.2. Effect of Steel CompositionFrom the results, it can be observed that the softening kinetics of the investigated steels are not significantly affected by microalloying additions or V or Nb, as long as they remain in solid solution, or by modifying the base composition from 20%Mn-1.5%Al to 30%Mn (see Fig. 1). This is in good agreement with the observations of Somani et al.14) in the case of microalloying with V, but it is in contrast to what they observed in the case of microalloying with Nb, as they found that this element significantly slowed down the static recrystallization kinetics, similar to what occurs in the case of plain C–Mn steels. On the other hand, Hamada et al.13,15) reported that the softening kinetics of 0.1C-25Mn steels were significantly retarded compared to data obtained for low C–Mn steels. Cabañas et al.12) also reported a retardation of dynamic softening kinetics due to high Mn additions. In order to investigate this, the t0.5 obtained in this work were compared with the predictions of the following equation determined by Fernandez et al.22) for low carbon steels microalloyed with Nb and Ti, modified to take into account the effect of V:31)
| (3) |
In the equation D0 is expressed in μm,
The predictions of Eq. (3) are plotted against the experimental t0.5 in Fig. 6. The figure shows that, except for the 30Mn-1C steel, the experimental values tend to be larger than those calculated with the equation. This indicates that the recrystallization kinetics of most of the high-Mn steels investigated here is delayed compared to conventional low carbon steels. However, a slight effect of C on the t0.5 can also be noted. While the experimental data obtained for the 30Mn-1C steel (grey symbols) fit reasonably well with the predictions of Eq. (3), the t0.5 obtained for 0.6%C steels (white symbols) are in all cases larger than the predicted data, and the t0.5 values of the 0.2%C steels (black symbols) show a further delay. This indicates that increasing C content results in faster recrystallization kinetics.

Comparison between the t0.5 experimental data and those calculated with Eq. (3).
Increasing C has been also found to lead to faster dynamic softening kinetics in the case of other high-Mn steels.32) This was attributed to C segregation effects and/or to the formation of a larger number of C–Mn dipoles. In the case of C–Mn steels, the effect of C is still controversial.33) However, Medina et al.30) also found that increasing C lead to faster static softening kinetics due to enhanced vacancy diffusion, and they reported a slight decreasing effect of C on the apparent activation energy for static recrystallization (Qapp in Eq. (2)).
In Fig. 7 the experimentally determined values of ln(t0.5) are represented against the inverse of absolute temperature for the steels investigated. From the slope of the regression lines of the plotted data, the value of Qapp can be estimated (Eq. (2)).

Apparent activation energy for recrystallization determined for the (a) 20Mn and (b) 30Mn steels.
For some of the steels investigated, the number of experimental t0.5 data available is low (for example 20Mn-0.1Nb or 30Mn-1C-0.1V). In most cases, this is due to the occurrence of strain-induced precipitation at relatively high temperatures. Therefore, the Qapp determined for these steels should only be taken as an approximation. Partly as a result of this, there is a significant spread in the values obtained for the different steels: from 153 to 220 kJ/mol for the 20%Mn steels and from 199 to 252 kJ/mol for the 30%Mn steels. The average mean value of all the results is 212 kJ/mol. It is worth noting that there is not a clear effect of composition on the Qapp, in contrast with the results reported by Medina et al.30) for low C steels.
Similar values of Qapp, from 213 to 273 kJ/mol,13,14,15) have been reported for other high-Mn steels. These are also in the range of those reported for C–Mn with and without microalloying additions,26,30) although for austenitic stainless steels larger values are usually reported.28)
The experimental t0.5 were also compared to the predictions of the different equations developed by Hamada et al.15) for 25Mn-0.14C-1Al steels and by Somani et al.14) for 20Mn-0.6C-(1.5-5)Al steels using double-hit axisymmetric compression tests. However, in all the cases the experimental t0.5 values were significantly larger than the times predicted by these equations (a mean value of the ratio
Taking into account the results of section 4.1.1, average values of p=2.7 and q=0.26 were assumed in this work. As mentioned above, in the tests a relatively narrow range of initial grain sizes was obtained (see Table 1) and therefore the effect of the initial microstructure on t0.5 could not investigated. In the bibliography, different values for the grain size exponent (s in Eq. (2)) are reported. However, most are close to s=122,25,26,30) and therefore this value was also assumed here. In terms of the effect of steel composition, the experimental results show that having Nb or V in solid solution or modifying the base composition from 20%Mn-1.5%Al to 30%Mn does not affect the static softening kinetics of high-Mn steels, and therefore these were not taken into account in the model development.
Once the values of these parameters were fixed, multiple linear regression analysis was carried out considering different forms of Eq. (2) and taking into account the C effect. The best fit was provided by Eq. (4) (Pearson correlation coefficient=0.98).
| (4) |
In the equation D0 is expressed in μm,

Comparison between the t0.5 experimental data and the predicted values calculated with Eq. (4).
Although other forms of Eq. (2) were considered in the analysis, some of them with Qapp depending of the C level, Eq. (4) provided the best fit. This is in agreement with the results in Fig. 7, which show no clear effect of Qapp on steel composition. It can also be noted that the Qapp value determined by multiple linear regression (207.5 kJ/mol) is very close to the average value estimated from the slopes of the data in Fig. 7 (212 kJ/mol). Few models explicitly take into account the effect of alloying additions on the austenite softening kinetics. As mentioned above, Medina et al.30) reported a slight dependency of the apparent energy for recrystallization on the C content, which was not observed here. However, it must be mentioned that in the same work a dependency of the constant A in Eq. (2) on the C content was also reported, which is in good agreement with the form of Eq. (4).
4.1.4. n Avrami ExponentWith regard to the experimental values of the n Avrami exponent, it should be noted that in most cases they are below n=1 (see Table 2). For low C steels, slightly larger Avrami exponents, between n=1 and n=2, are usually reported.22,23,24,25) From the experimental data available, no clear effect of steel composition, strain or strain-rate on this parameter could be found. However, despite the experimental scattering, Fig. 9 shows that the value of n tends to reduce as deformation temperature decreases.

Effect of deformation temperature on the n Avrami exponent.
As Fig. 9 shows, the experimental data (only results obtained at temperatures above 800°C have been considered) could be fitted to an equation of the form (discontinuous line):
| (5) |
| (6) |
| (7) |
The predictions of these equations (black lines) have been compared with the results of Eq. (5) (grey line) in Fig. 10. The experimental n values reported by Hamada et al. for a 25Mn1Al steel15) are also included in the figure. The values provided by the equation developed for high-Mn steels tend to be lower than those predicted for low C steels. At low temperatures, the n values predicted by Eq. (5) are in good agreement with the values reported by Hamada et al.15) At higher temperatures, the fit is worse, although this could be due in part to the experimental scatter (see Fig. 9). The n values reported by Somani et al.14) for 20Mn-0.6C-(1.5-5)Al steels also vary between 0.7 and 1, and are thus in the range of those found in the present work.

If the recrystallized grain size is considered to be independent of deformation temperature, Eq. (8) can be used for grain size calculation:23)
| (8) |
In Fig. 11 the experimental recrystallized grain sizes have been compared with the predictions of equations reported in (a) references23) for C–Mn–Nb and36) for C–Mn steels, and (b) equations in references15) for TWIP and37) for C–Mn–Nb steels (see Table 3).

The equations determined for C–Mn and C–Mn–Nb steels tend to overestimate the experimental grain size, especially for the lowest strain values considered (ε=0.16). Similar trends have also been observed in other works for C–Mn steels,38) which suggests that the strain exponents in these equations are not adequate for the prediction of the recrystallized grain size when low strain levels are applied. On the other hand, Fig. 11(b) shows that the equation developed for TWIP steels provides a better fit, although it tends to underestimate the experimental values. Differences in the fit depending on the deformation level can also be observed. It should be noted that, in the case of the TWIP steels studied in this work and in reference,15) the grain size measurements have been carried out via EBSD. It has been reported that the grain sizes determined using this technique tend to be lower than those measured via classical metallography.39)
In order to determine the strain exponent m from the available experimental data, the logarithms of the recrystallized grain sizes are represented against the logarithm of strain in Fig. 12. The m value determined from linear regression of the data, m=0.46, is lower than the exponents in the equations above. However, values in this range have also been reported for low C steels, for instance m=0.55 and m=0.57,40) m=0.525) and m=0.37 to m=0.79.41) It is difficult to discern whether the discrepancies within these exponents are related to the experimental conditions used to determine the equations. In the case of reference25) the strain range applied in the tests was not specified. In40,42) and,41) a large range of strain values were considered (from ε=0.08 to ε=0.51,40,42) and from ε=0.1 to ε=141)), leading to relatively low values of m. However, Sellars,23) for similar strain conditions, ε=0.1 to ε=1, determined larger values of m=1 and m=0.67 for C–Mn and Nb microalloyed steels, respectively. The effect of composition on this parameter is not clear either. Similar values of m≈0.56,40) m=0.6541) and m=0.525) were determined for Ti microalloyed steels, a Nb–Ti steel and C–Mn steels, respectively. Experimental difficulties in accurately measuring the austenite grain size in low C steels due to the martensitic transformation may also contribute to the spread in the data in the literature.

Effect of strain on the recrystallized grain size for 30Mn-0.6C steels.
In order to find an expression suitable for the steels considered here, multiple linear regression analysis was carried out with the available experimental data assuming a value of m=0.46 and of k=0.56.37) The best fit (Pearson correlation coefficient=0.81) was obtained from the following equation, where the grain size exponent was assumed to be equal to that proposed in reference:37)
| (9) |
Finally, considering standard compositions, the recrystallization behavior of different AHSS steel grades has been compared in Fig. 13, in terms of recrystallization time (t0.5) and recrystallized grain size (DSRex). A 0.04% Nb microalloyed HSLA steel type and a 1%Al alloyed TRIP steel type (without microalloying additions) were compared to a TWIP steel type containing different C contents. Equations (3) and (5) reported in reference38) which takes into account the effect of high Al contents, have been used to calculate the recrystallization time in the case of the HSLA and TRIP steels, respectively, while Eq. (4) developed in this paper was considered for the TWIPs. It can be observed that the recrystallization kinetics is significantly faster in the TRIP and HSLA steels than in the TWIPs. A big effect of carbon content on the latter is clearly apparent, mainly at low temperatures. This could suggest that, from the point of view of industrial considerations, tailored thermomechanical processes should be designed in the case of TWIP grades, as this recrystallization delay can affect the evolution of the microstructure during hot working.
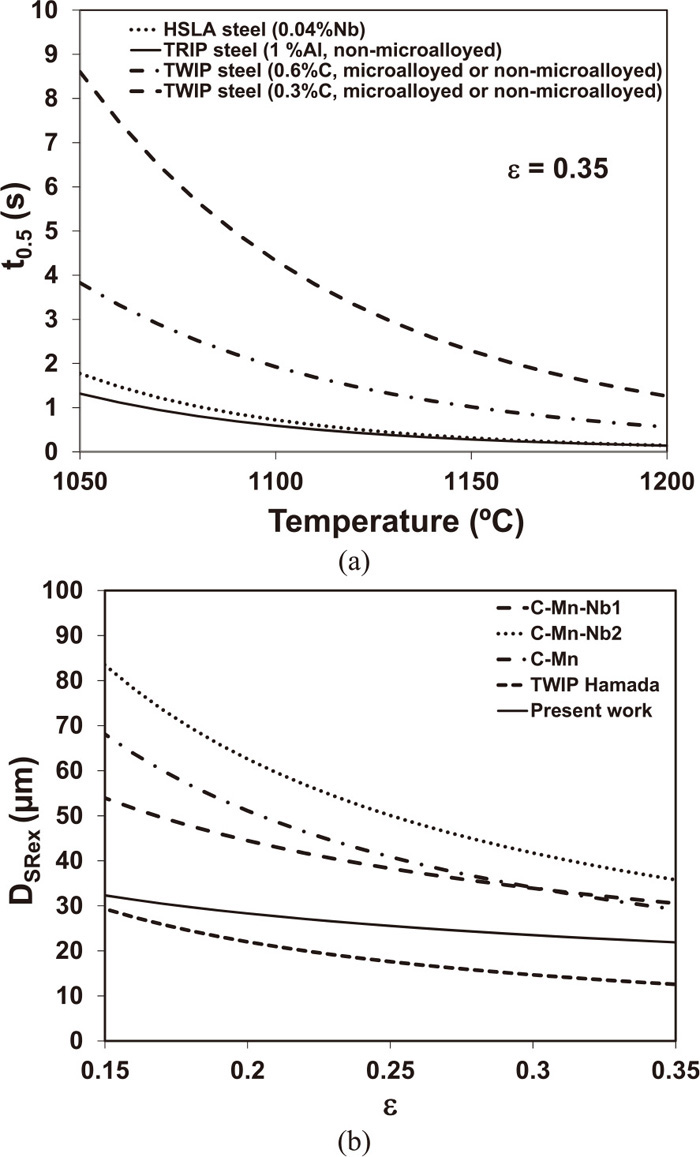
(a) Calculated temperature dependence of the time to reach a 50% recrystallized fraction; (b) Calculated strain dependence of the recrystallized grain size for different AHSS steel grades. Calculations made for an initial grain size, D0=50 μm, deformation temperature, T=1050°C, strain-rate,
To determine the recrystallized grain size, the different equations listed in Table 3 were considered, along with Eq. (9) developed in the present work for the TWIPs. A major recrystallization refinement is predicted for the TWIPs compared to the plain carbon and Nb microalloyed steels. Nevertheless, it should be noted that in the case of the TWIPs the recrystallized grain size has been determined via EBSD measurements, whereas all the equations developed for plain carbon and microalloyed steels are based on metallographic measurements carried out by optical microscopy after etching. As mentioned above, EBSD measurements tend to give smaller sizes than other metallographic techniques. Finally, this finer grain size, obtained for similar deformation conditions, could partially compensate for the delay observed in the recrystallization kinetics. This again confirms the complex interactions that can occur in the industrial processing of TWIP grades when compared to more conventional steel families.
-A model for predicting the recrystallization kinetics based on determining the time for 50% recrystallized fraction, t0.5, and the n Avrami exponent as a function of deformation conditions and steel composition is proposed for high-Mn steels with a wide range of alloying contents.
-The exponents of strain and strain-rate for the calculation of t0.5, p=2.7 and q=0.26 respectively, are in good agreement with the values usually reported for low C and stainless steels. However, for most of the steels investigated, the softening kinetics is retarded compared to what has been calculated for low C steels. The softening kinetics of the high-Mn steel is insensitive to microalloying addition in solid solution or to varying the composition from 20%Mn-1.5%Al to 30%Mn. Nevertheless, decreasing the carbon content leads to retarded recrystallization kinetics. This effect has been implemented in the equation developed for t0.5 calculation.
-The n Avrami exponents determined for the high-Mn steels are lower than those determined for low C steels and tend to reduce as deformation temperature decreases.
-The equations usually employed for predicting recrystallized grain size for C–Mn and C–Mn–Nb steels tend to overestimate the grain sizes for the high-Mn steels, especially at low strain levels. The strain exponent for the calculation of the recrystallized grain size determined for the experimental data, m=0.46, tends to be lower than what is usually reported in the literature for other steels. An equation for predicting the recrystallized grain size as a function of deformation conditions is proposed for the steels investigated.
The authors acknowledge RCFS project number RFSR-CT-2010-00018 for financial support.