Regular Article
Effect of Si Concentration on Carbon Concentration in Surface Layer after Gas Carburizing
2016 年 56 巻 9 号 p. 1638-1645
詳細
2016 年 56 巻 9 号 p. 1638-1645
The mechanisms for the decrease in the carbon concentration in the surface layer after gas carburizing that occurs with increasing the Si concentration was investigated using three kinds of steel having compositions based on JIS SCr420 with varying Si concentrations (0.25%Si steel, 1%Si steel, 2%Si steel). The carbon concentration in the surface layer after gas carburizing decreased with the increase in the Si concentration, and the carbon concentration was particularly low in 2%Si steel. The carbon concentration in the surface layer after gas carburizing of 1%Si steel was nearly equal to the thermodynamic calculation value for a simulated gas carburizing reaction, whereas that of 2%Si steel was much lower. This substantial change seems to be due to the oxide formation on the surface, with 2%Si steel showing the different oxide formation on the steel surface compared to the other steels. The oxides layer of the surface of 2%Si steel densely covered the surface. By removing the oxide layer, the carbon concentration in the surface layer of 2%Si steel increased to the nearly calculated value. These results reveal that the mechanisms for the decrease in the carbon concentration in the surface layer change depending on the Si concentration and are the thermodynamic interaction between Si and carbon for 1%Si steel and 2%Si steel and the oxide layer’s inhibitory effect on the carburizing reaction for 2%Si steel.
The carburizing process is widely used for producing the automotive transmission gears because it can give the high fatigue strength and the good wear resistance to the gears. In typical carburizing process, the steel is placed under a carburizing gas atmosphere at about 1200 K to diffuse carbon from surface to the internal region of the steel, and then it is quenched into the oil. After that, the steel is tempered at about 420 K. Through these treatments, the low-temperature-tempered martensite structure which contains approximately 0.8 mass% carbon is obtained in the surface layer of the steel. The hardness of the surface layer is increased to HV 700–800 by these treatments. Among several types of carburizing processes, the gas carburizing process is the most popular because it is favorable for the continuous carburizing operation and thereby has a good productivity. In the gas carburizing process, the steel is placed under the gas atmosphere that contains a certain ratio of CO and CO2 to implant carbon atoms into the steel surface by the Boudouard reaction. Since this reaction rapidly reaches equilibrium, the interface between the gas atmosphere and the steel is considered to be in equilibrium.1) Therefore, the carbon concentration in the surface layer can be controlled by controlling the partial gas pressure ratio of CO and CO2. This gas atmosphere is the reduction atmosphere for Fe as the steel matrix but the oxidation atmosphere for Si, Mn, and Cr as alloy elements. Therefore, the selective oxidation of the solute alloy elements occurs during gas carburizing. Since these solute alloy elements are consumed due to the selective oxidization, the depleted layer of the solute alloy elements is formed in the surface layer of the steel after the gas carburizing.
In order to reduce the size and the weight of the automotive transmissions, it is required that the fatigue strength of the automotive transmission gears is improved. Especially, the improved contact fatigue strength at the tooth face of the gears is highly required. When the automotive transmission is driven, the temperature at the surface of the tooth face on the gear increases to approximately 573 K because of the contact and the sliding between the teeth.2) Due to the increase in the temperature the surface layer of the gear is tempered and consequently becomes softer, which results in the decrease in the contact fatigue strength of the surface layer. Therefore, in order to improve the contact fatigue strength of the gears, it is effective to improve the hardness of carburized layer after tempering at 573 K.2) It is well known that increasing the Si concentration is effective to increase the hardness after tempering at low temperature. By increasing the Si concentration, the transition from ε-carbide to cementite in tempering which causes the softening happens at a higher temperature, and it follows that the softening after tempering is inhibited. Therefore, it is possible to improve the contact fatigue strength by increasing the Si concentration. However, it is empirically known that the carbon concentration in the surface layer of the carburized steel decreases due to the excessive addition of Si compared with the Si concentration of conventional steels. The hardness in the surface layer and the case depth of the carburized steel are decreased by the decrease in the carbon concentration. Therefore, the Si concentration of the steel is limited in the practical gas carburizing process.3)
Seo et al. revealed that the carbon concentration in the surface layer of the carburized steel of 1.15 mass%Si steel is lower than that of 0.25 mass%Si steel. They considered that this occurs because the increase in the Si concentration increases the carbon activity of austenite.4) Murai et al. investigated the similar phenomenon by using the steels which contain Si below 0.99 mass%. They revealed that there is a good correlation between the measured carbon concentration and the concentration calculated by Thermo-calc.5) These researches indicate that the decrease in the carbon concentration due to the increase in the Si concentration is caused by the increase in the carbon activity of austenite. In other words, it is caused by the thermodynamic interaction between Si and carbon. On the other hand, Naito et al. investigated the carburizing behavior of the steels of the Si concentrations from 0.21 to 1.74 mass%. They considered that the decrease in the carbon concentration in the surface layer and the case depth of the carburized steel result from the decrease in the diffusion rate of carbon in austenite.3) According to some of their results, the carbon concentration in the surface layer and the case depth are decreased significantly when the Si concentration is above 1.2 mass%. This result may indicate that the effect of the Si concentration on the carburizing behavior is varied depending on the concentration of Si.
As mentioned above, there are several studies to reveal the effect of Si on the carburizing behavior of steel. However, the effect has not yet been sufficiently revealed because there has been no systematic research of the effect of the Si concentration. In this research, the effect of the Si concentration on the decrease in the carbon concentration in the surface layer of the carburized steel is investigated.
The chemical compositions of the test steels are shown in Table 1. 0.25%Si steel is JIS SCr420 which is the typical low-alloyed steel for machine structural use. 1%Si steel and 2%Si steel are SCr420 whose Si concentration is increased to 1 and 2 mass% respectively. They were prepared by vacuum melting, and the ingots were then forged into φ35 mm bars. After being subjected to a homogenization treatment at 1573 K for 7.2 ks, the steels were cooled to the room temperature. Subsequently, to simulate the thermal history of the hot forging process of the manufacturing process of the gear, the steels were heated at 1523 K for 1.8 ks and cooled to the room temperature. Then they were heated at 1198 K for 3.6 ks and cooled to the room temperature as a normalizing treatment. Columnar specimens for the carburizing, with 20 mm in diameter and 40 mm in length were cut from the round bars and finished by a grinder. The carburizing furnace used in this study was a batch type furnace (G-161618-AFHVC, Koyo Thermo Systems Co., Ltd.). The mixture gas of the converted gas, which was generated from propane, and the propane as the enriched gas was used as the carburizing atmosphere. The carburizing was conducted under the carburizing atmosphere with a carbon potential (CP) of 0.8. The calibration curve of CP was adjusted so that the carbon concentration in the surface layer of SCr420 becomes 0.8 mass%. In order to set the intended carbon concentration of 0.8 mass% in the surface layer of the specimens, the specimens were heated at 1223 K for 18 ks under the carburizing atmosphere with the adjusted CP of 0.8. Then the specimens were quenched into the oil at 403 K. The carburizing temperature was 41–120 K higher than the A3 temperature calculated by the experimental formula.6) Therefore, it is considered that there is only austenite phase in all specimens while specimens were heated at 1223 K. The specimens were tempered at 423 K for 5.4 ks after quenching.
| C | Si | Mn | Cr | P | S | Al | N | |
|---|---|---|---|---|---|---|---|---|
| 0.25%Si steel | 0.21 | 0.25 | 0.79 | 1.21 | 0.015 | 0.015 | 0.029 | 0.012 |
| 1%Si steel | 0.21 | 0.98 | 0.79 | 1.21 | 0.015 | 0.015 | 0.030 | 0.012 |
| 2%Si steel | 0.21 | 1.98 | 0.79 | 1.20 | 0.015 | 0.015 | 0.031 | 0.011 |
The hardness and the carbon concentration distribution were measured in the cross section which was cut along the direction parallel to the edge. The cross section was at least 5 mm away from the edge plane of the columnar specimens. A micro-Vickers hardness tester and an electron probe micro analyzer (EPMA) with wave dispersive spectroscopy were used to measure the hardness and the carbon concentration distribution. The specimens after carburizing slightly have a decarburized layer inside the surface. The decarburized layer formed while the specimens were carried from the heat chamber for carburizing to the oil-quenching bath in 40 s because the atmosphere between them is N2 gas. Therefore, in order to avoid the effect of the decarburized layer, the carbon concentration in the surface layer was calculated as the average concentration at a depth of 100±15 μm from the surface because the region has the almost maximum carbon concentration in the carburized layers. Microstructure observations were conducted using optical microscopy (OM), EPMA, field-emission scanning electron microscopy (FE-SEM), and field-emission transmission electron microscopy (FE-TEM) in order to investigate the oxidization of the alloy elements in the surface layer. Focused ion beam (FIB) was used to make the thin film specimens for the observation by FE-TEM after the carbon and W deposition. Elemental analyses were conducted by EPMA and energy-dispersive X-ray spectrometry (EDS) using FE-SEM and FE-TEM. The X-ray diffraction method was applied to the edge planes of the columnar specimens in order to investigate the structure of the oxides formed by the gas carburizing.
Figure 1 shows the hardness distributions of the carburized layers. The hardness distributions of 0.25%Si steel and 1%Si steel are almost equal, except that the hardness of 1%Si steel is slightly lower than that of 0.25%Si steel at a depth of approximately 0.5 mm. On the other hand, the hardness distribution of 2%Si steel indicates that there is no hardened layer although it was carburized. Figure 2 shows the carbon concentration distributions of the carburized layers. The carbon concentration in the surface layer of 1%Si steel is 0.1% lower than that of 0.25%Si steel. The carbon concentration in the surface layer of 2%Si steel is as low as that of matrix (approximately 0.2 mass%). That is, the decrease in the carbon concentration in the surface layer of 1%Si steel occurs slightly, whereas that of 2%Si steel occurs significantly.
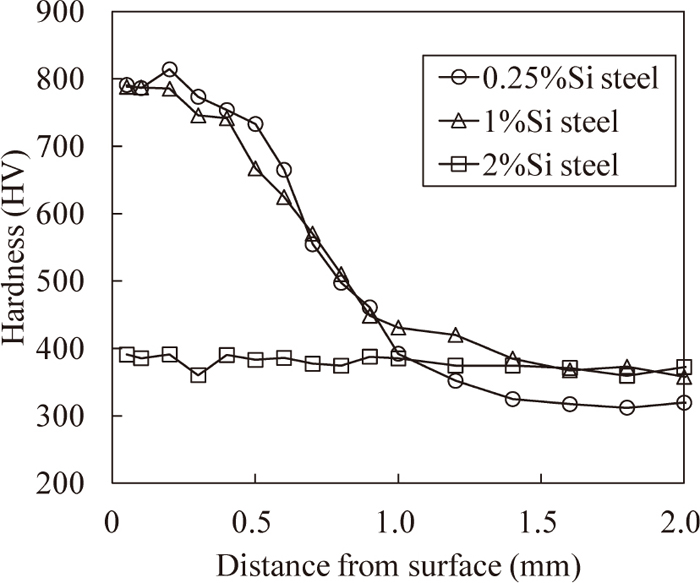
Hardness distribution in surface layer after carburizing.
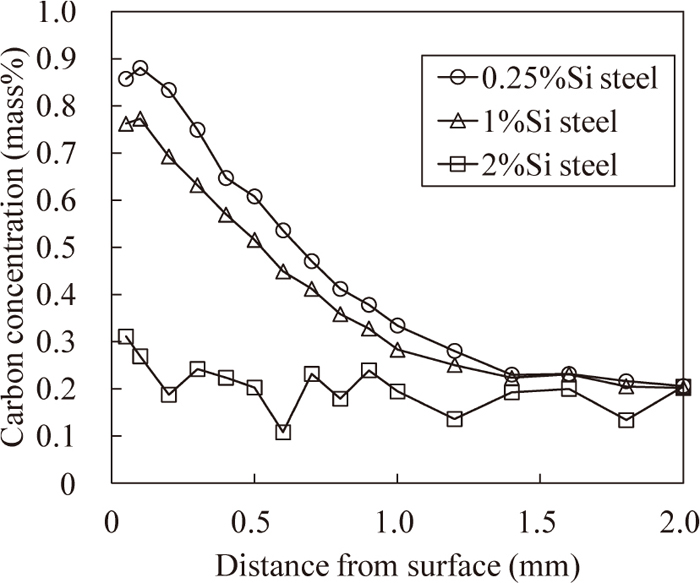
Carbon concentration distribution in surface layer after carburizing.
Figure 3 shows the optical micrographs of the cross section of the surface layer without etching. The surface layer which has the granular or network-like black microstructure is the layer containing oxides (internal oxidation layer) which was formed during carburizing. This layer was formed by the selective oxidation of the easily oxidizable elements such as Si, Mn, and Cr.7) The network-like microstructure is the oxides which were formed along the prior-austenite grain boundaries (grain boundary oxidation). The thickness of the internal oxidation layer decreases with increasing Si concentration. Especially, the surface layer of 2%Si steel scarcely contains oxide. This result indicates that the morphology of the internal oxidation layer is changed when the Si concentration increases from 1 mass% to 2 mass%.
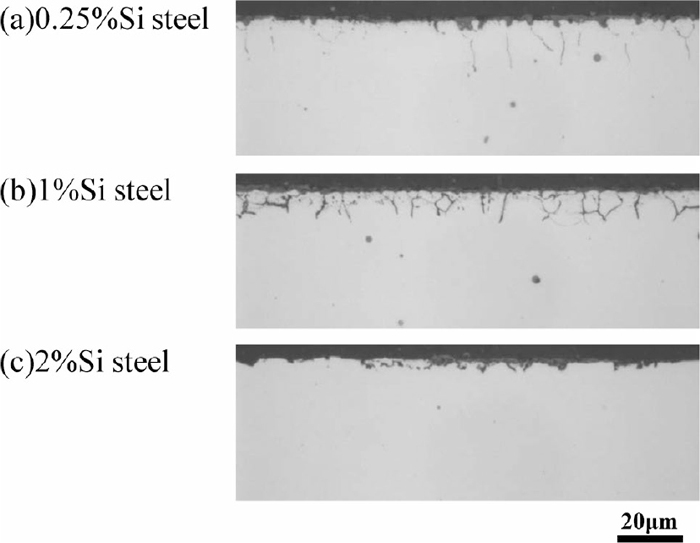
Optical micrographs of cross section of surface layer after carburizing. (a) 0.25%Si steel, (b) 1%Si steel, (c) 2%Si steel.
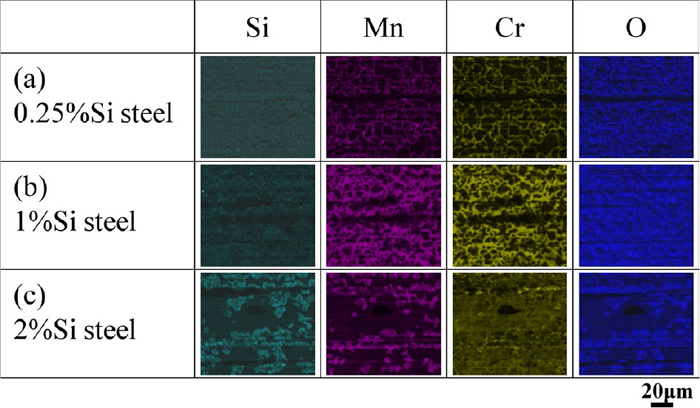
Figure 4 shows the EDS element mappings of the cross section of the surface layer. Since the region that contains high concentrations of Si, Mn, and Cr also contains O, these elements form oxides in the region. The depth of the oxide layer including Si oxides decreases with increasing the Si concentration from 0.25 mass% to 1 mass%. When the Si concentration increases to 2 mass%, Si oxides are no longer formed in the steel matrix but cover the surface of the specimen. That is, the morphology of the Si oxides (internal oxidation) is transformed into the external oxidation due to the increase in the Si concentration. On the other hand, the morphology of the Mn and the Cr oxides are the external oxidation regardless of the Si concentration.
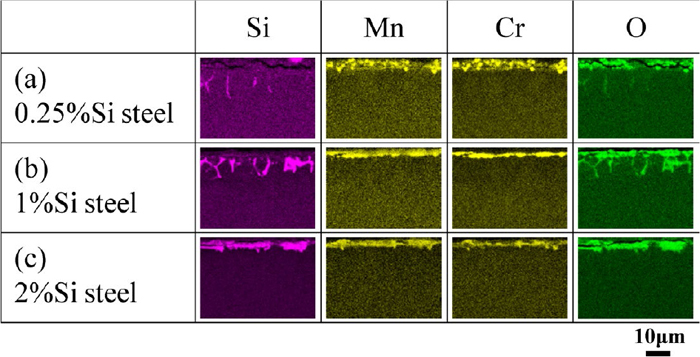
SEM-EDS mapping results of cross section of surface layer after carburizing. (a) 0.25%Si steel, (b) 1%Si steel, (c) 2%Si steel. (Online version in color.)
To forecast the morphology of the oxidation, Wagner’s oxidation theory is useful. Owing to this theory, the external oxidation occurs when formula (1) is satisfied, and the internal oxidation occurs when formula (1) is not satisfied.8)
| (1) |
M represents the alloy element, and N and D represent the concentration and diffusion rate of each respective element. Vm and VOX represent the mole volume of the alloy element and oxide. g* represents the critical value of the oxide volume fraction, and ν represents the atomic number of O per alloy element in the oxide. The index 0 represents the internal value, and the index S represents the surface value. The alloy concentration is shown on the left-hand side of the formula (1). Therefore, the increase in the concentration of the alloys transforms the morphology of the oxidation from the internal oxidation into the external oxidation. This is the reason why the transition from the internal oxidation to the external oxidation occurred by the increase in the Si concentration from 1 mass% to 2 mass% in this research.
Figure 5 shows that the SEM-EDS mappings of the surface of the specimens. The direction of the grinding marks which were formed by the finishing process of the specimens is in line with the horizontal direction of the figures. There are the network-like regions that contain high concentrations of Mn and Cr on the surfaces of 0.25%Si steel and 1%Si steel. Judging from the morphology of the regions, these network-like regions are presumably the oxides along prior-austenite grain boundaries. In contrast, the concentration of Si is not observed on the surface. Since the Si oxides are formed in the steel matrix as shown in Figs. 4(a) and 4(b), it is considered that there is scarcely Si oxide on the surface. On the other hand, the oxide containing Cr covers the surface of the 2%Si steel uniformly. The surface of 2%Si steel can be categorized into two types. One is the region which has plenty of the oxides containing Si and Mn. Another is the region in which these oxides were not detected by the EDS mappings. The area fraction of them is almost same. It is considered that the regions containing no oxide are formed during the quenching because some part of the oxides on the surface of the specimens flaked off. Figure 6 shows the EDS point analysis spectrum of the region where the oxides containing Si and Mn were not detected in Fig. 5(c). It was confirmed that the oxides containing Si and Mn exist there even if they cannot be detected in Fig. 5(c). The atomic ratio of Si, Mn and Cr there is approximately 2:2:3. These results indicate that the oxides on the surface of 2%Si steel contain Si, Mn and Cr in all regions; the oxides containing Cr cover the surface uniformly; the surface can be categorized into two types, that is, one is the region which contains plenty of the oxides containing Si and Mn, and another is the region which contains relatively a small amount of them.
SEM-EDS mapping results of the surface after carburizing. (a) 0.25%Si steel, (b) 1%Si steel, (c) 2%Si steel. (Online version in color.)
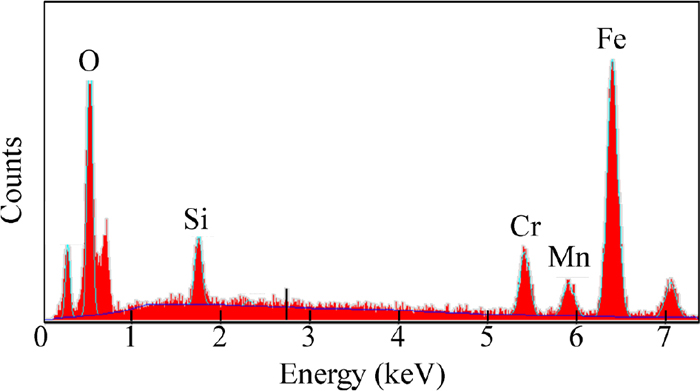
SEM-EDS spectrum of region which has a relatively small amount of oxides containing Si and Mn of 2%Si steel in Fig. 5. (Online version in color.)
Figure 7 shows the X-ray diffraction patterns of the surface layer. The marks above the peaks indicate the peaks corresponding to the candidate compound. Since the spinel-type oxides such as Mn3O4, MnCr2O4 and Fe3O4 have similar crystal structures, they as a whole were treated as M3O4. The candidate compounds of 0.25%Si steel and 1%Si steel are ferrite (α-Fe), M3O4 and FeO. α-Fe is considered to be matrix martensite. According to the peak height ratio, the amount of FeO is small. The candidate compounds of 2%Si steel are α-Fe and M3O4. According to the peak height ratio between α-Fe and M3O4, it is considered that the volume fraction of M3O4 in the surface layer of 2%Si steel is less than that of 0.25%Si steel and 1%Si steel. There are no candidate compounds containing Si in the diffraction pattern of 2%Si steel. However, Figs. 5 and 6 clearly show that there is oxide including Si on the surface of 2%Si steel. That is, the result of X-ray diffraction does not correspond with the result of the EDS analysis.
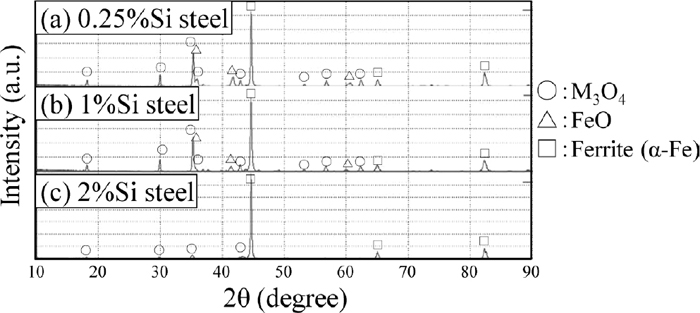
X-ray diffraction patterns of surface after carburizing. (a) 0.25%Si steel, (b) 1%Si steel, (c) 2%Si steel.
Figures 8 and 9 show the TEM-EDS mappings of the cross section of the surface layer of 0.25%Si steel and 2%Si steel, respectively. The observed region of 0.25%Si steel was the region where the network-like oxides do not exist because the area fraction of the network-like oxides was small. As for 2%Si steel the two regions were selected to observe the surface layer. One is the region which has a relatively small amount of the oxides containing Si and Mn (Fig. 9(a)). Another is the region which has plenty of the oxides (Fig. 9(b)). The void in the bright field (BF) image in Fig. 9(b) was formed by falling off due to FIB milling. There are two types of morphologies of oxides in Fig. 8. One is a complex oxide layer containing Fe and Mn having thickness of approximately 1 μm located on the steel surface. Another is the particles of the complex oxides having diameter of 50–300 nm containing Mn and Cr, or Mn and Si existing in the steel matrix. On the other hand, the oxide layer on the surface of 2%Si steel is denser than that of 0.25%Si steel. In particular, as shown in Fig. 9(a), there is an oxide layer having thickness of approximately 180 nm that consists of two layers. The inner layer is the Si oxide layer and the outer layer is the complex oxide layer containing Mn and Cr. Figure 10 shows the lattice image of the oxide layer of 2%Si steel and fast fourier transformation (FFT) image of the Mn and Cr complex oxide and Si oxide. Figure 10(b) has the obvious peak spots, indicating the complex oxide containing Mn and Cr oxide is crystalline. However, since Fig. 10(c) does not have such a peak spot, it is determined that Si oxide is amorphous. Therefore, the reason why the result of X-ray diffraction does not correspond with the result of the EDS analysis is that the X-ray diffraction does not occur in the amorphous Si oxide which exists on the surface of 2%Si steel. In Fig. 9(b), the complex oxide layer containing Mn and Cr exists as an outer oxide layer and Si oxide layer exists as the inner oxide layer as well as Fig. 9(a). The complex oxides containing Si and Mn exist un-uniformly between those oxide layers. Under those layers, there are the particles of the complex oxide containing Si and Mn or Mn and Cr, or the Si oxide particles. That is, the oxides on the surface of 2%Si steel are characterized by the particular oxide layers covering the surface. The particular oxide layer have at least following two layers; the outer oxide layer (complex oxide containing Mn and Cr) and the inner oxide layer (amorphous Si oxide). Figure 11 shows the schematic illustrations of the oxides which are formed around the steel surface of 0.25%Si steel and 2%Si steel. The oxides on the surface of 0.25%Si steel are granular. On the other hand, the oxide on the surface of 2%Si steel forms a layer and covers the steel surface. The layer is denser than that of 0.25%Si steel.

STEM images and STEM-EDS mapping results of cross section of surface layer of 0.25%Si steel after carburizing. (Online version in color.)

STEM images and STEM-EDS mapping results of cross section of surface layer of 2%Si steel after carburizing; (a) region which has relatively small amount of the oxides containing Si and Mn, (b) region which has plenty of oxides containing Si and Mn. (Online version in color.)
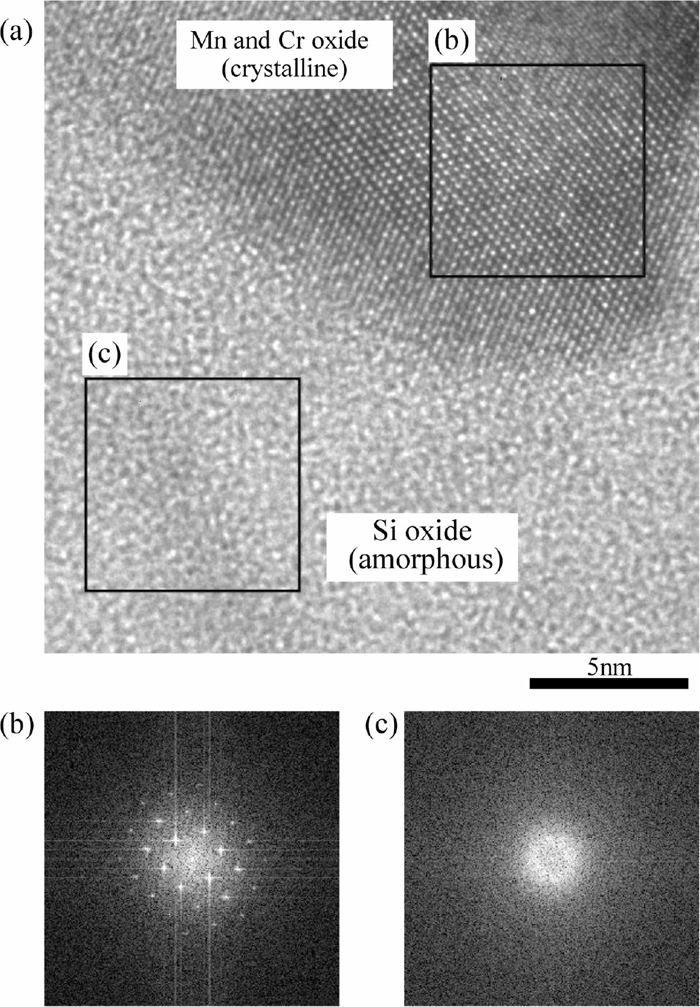
(a) Lattice image of oxide layer of 2%Si steel, and Fast Fourier Transformation images of (b) Mn and Cr oxide and (c) Si oxide.
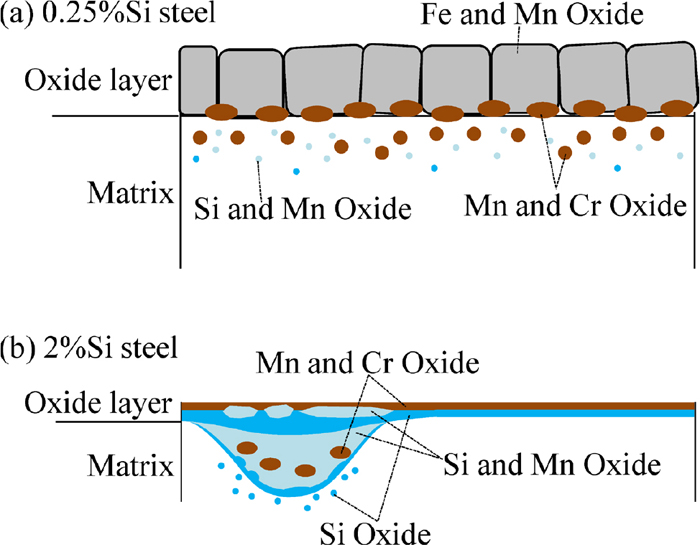
Schematic illustrations of oxide on surface layer of (a) 0.25%Si steel and (b) 2%Si steel after carburizing. (Online version in color.)
As mentioned above, the interface between the carburizing gas atmosphere and the surface layer of the steel is considered to be in equilibrium. However, in the initial stage of the actual carburizing process, the carbon concentration in the surface layer increases so that the chemical potential of carbon in the surface layer becomes equal to that of the carburizing atmosphere. When they become the same value, the interface between the carburizing gas atmosphere and the surface layer becomes in equilibrium. Therefore, the carbon activity on the steel surface has the particular value corresponding to the chemical potential of carbon of the atmosphere. Si has a positive interaction parameter with carbon, which means the carbon activity coefficient in austenite increases with increasing Si concentration.9) When the surface layer and the atmosphere are in equilibrium, the carbon activity of austenite has a particular value which is independent of the steel composition. According to the above discussions, when the Si concentration increases, the carbon concentration in the surface layer decreases so that the carbon activity becomes the particular value corresponding to that of the atmosphere. Therefore, the effect of the Si concentration on the carbon concentration in the surface layer in carburizing gas atmosphere was investigated using Thermo-calc.10)
The calibration curve of CP of the carburizing furnace used in this research was adjusted so that the carbon concentration in the surface layer of SCr420 (Si concentration 0.25 mass%) becomes 0.8 mass% under the carburizing atmosphere with CP of 0.8. Therefore, the carbon activity of austenite of 0.25%Si steel of which carbon concentration is 0.8 at 1223 K was calculated. This calculated value indicates the carbon activity of austenite in the surface layer. Besides, the value corresponds to the carburizing atmosphere used in this research. When the carburizing atmosphere is constant, the calculated carbon activity of the surface layer is fixed. Therefore, the change in the carbon concentration in the surface layer with the change in the Si concentration was calculated using the fixed carbon activity. TCFE511) was used as a database for the calculation.
Figure 12 shows the comparison between the measured carbon concentrations and the calculated concentrations. The difference between the measured and the calculated carbon concentrations of 1%Si steel is small and almost equal to that of 0.25%Si steel. Therefore, decrease in the carbon concentration of 1%Si steel is caused by the thermodynamic interaction between Si and carbon. In other words, because the carbon activity coefficient increases with increasing Si concentration, the carbon concentration decreases to keep the carbon activity constant. On the other hand, the difference between the measured and the calculated carbon concentrations of 2%Si steel is so large that it cannot be explained by only the thermodynamic interaction. This indicates that the carbon concentration decreases for reasons other than the thermodynamic interaction.
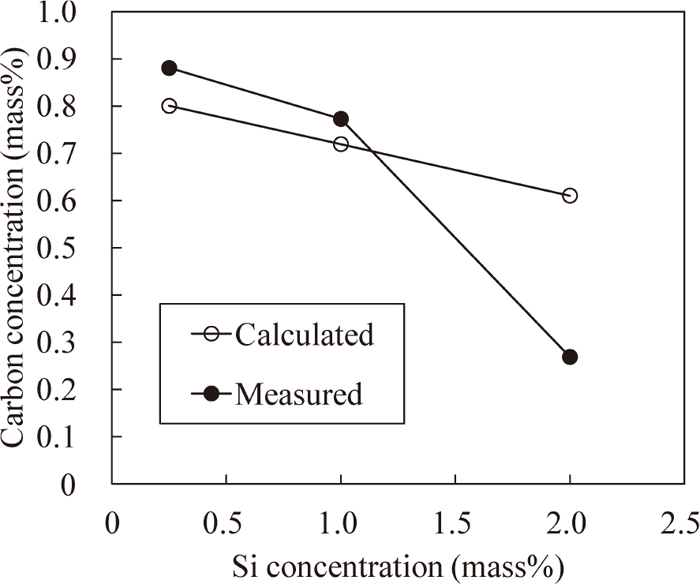
Comparison of carbon concentration in surface layer after carburizing between measured and calculated values.
As is shown in Fig. 4, the morphology of the Si oxides of 0.25%Si steel and 1%Si steel is the internal oxidation. In contrast, that of 2%Si steel is the external oxidation. This transformation in the morphology of the Si oxides seems to correspond to the significant decrease in the carbon concentration in the surface layer. This indicates that there should be some relationship between the morphology of the oxides and the significant decrease in the carbon concentration in the surface layer of 2%Si steel. As is shown in Figs. 8 and 9, there are dense oxide layers on the surface of 2%Si steel that mainly consist of the complex oxide containing Mn and Cr and the amorphous Si oxide. These results suggest that the carburizing reaction was inhibited by the dense oxide layers and consequently the carbon concentration in the surface layer was decreased.
An additional experiment was conducted to distinguish the effect of the Si oxide layer on the carbon concentration from the effect of Si as the alloying element. If the Si oxide layer is the main reason for the significant decrease in the carbon concentration in the surface layer, the decrease in the carbon content will not occur by inhibiting the formation of the Si oxide layer. To confirm the above hypothesis, some specimens were prepared by the experimental procedure shown in Fig. 13. The first carburizing was conducted to form the depleted layer of solute Si, Mn and Cr which was formed by the selective oxidation of them in the surface layer of the specimens. The Si concentration of the depleted layer was decreased to less than 1 mass% by this operation. Then the oxide layers (outer layer: complex oxide containing Mn and Cr, inner layer: amorphous Si oxide) which was formed by the first gas carburizing were removed by polishing in some specimens. This means some specimens had oxide layers on the surface while the other did not. Then the second gas carburizing was conducted. These specimens were divided into the four groups: a-1: 0.25%Si steel without polishing after the first carburizing (with alloy depleted layer and surface oxide layer), a-2: 0.25%Si steel with polishing (with alloy depleted layer and without surface oxide layer), b-1: 2%Si steel without polishing (with alloy depleted layer and surface oxide layer), b-2: 2%Si steel with polishing (with alloy depleted layer and without surface oxide layer). The concentration of carbon, Si, Mn and Cr in the surface layer before and after the second gas carburizing were measured using EPMA. The conditions of the first and the second gas carburizing were the same as those described in Chapter 2. When the oxide layers were removed after the first gas carburizing (b-2), the dense oxide layer would not be formed by the second carburizing because the Si concentration of the surface layer was decreased to less than 1 mass%. Therefore, if the oxide layers are the main reason for the significant decrease in the carbon concentration in the surface layer, the carbon concentration of the b-2 specimen after the second gas carburizing will increase. On the other hand, the carbon concentration of the b-1 specimen after the second carburizing will remain low.
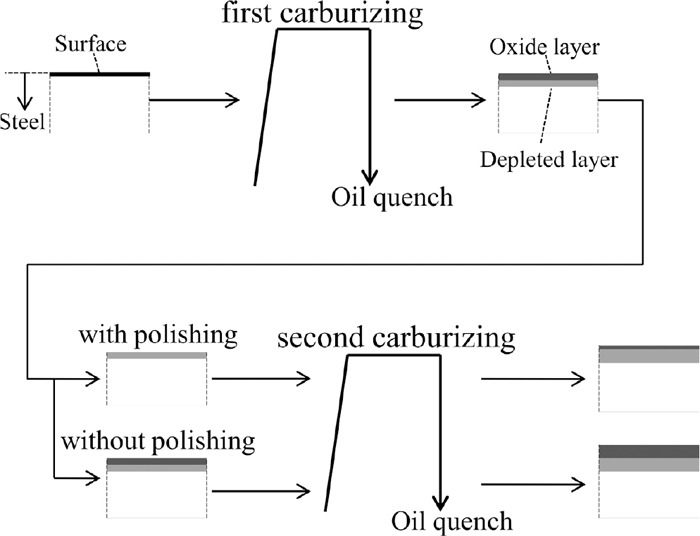
Experimental procedure to investigate effect of oxide layer on carbon concentration after carburizing.
Figure 14 shows the concentration distribution of Cr, Mn and Si in the surface layer of the 2%Si steel after the first gas carburizing and the polishing. The solute concentrations of these alloy elements decrease in the region from the surface to 25 μm depth. This means that the layer which contains the oxide was successfully removed by polishing without removing the alloy depleted layer. The Si concentration at the surface decreases to less than 1 mass%.
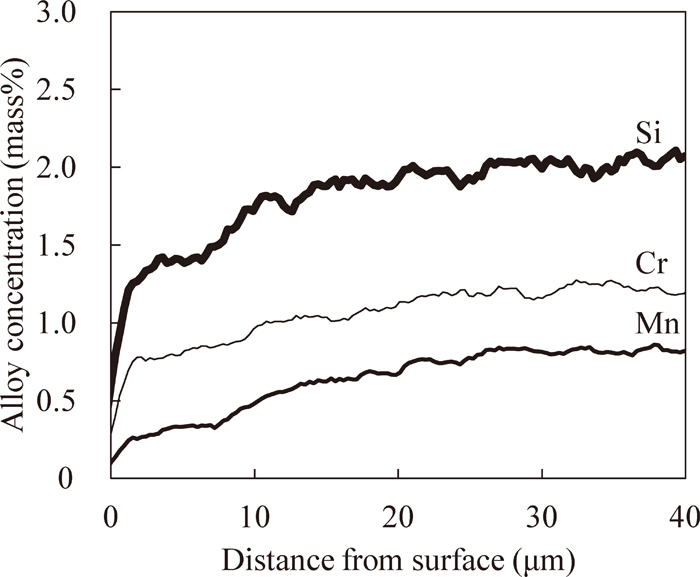
Alloy concentration distribution in surface layer of 2%Si steel after first carburizing and polishing.
Figure 15 shows the comparison between the measured carbon concentrations in the surface layer of the specimens (after the first and the second gas carburizing) and the calculated concentrations discussed in Chapter 4.1. The calculated values are the same values as Fig. 12 and were calculated under the assumption that they are not affected by the oxide layer but by the thermodynamic interaction. All of the measured and the calculated carbon concentrations of 0.25%Si steel are almost equal regardless of the number of carburizing and polishing. Therefore, when the Si concentration is low, the presence or absence of the oxide layer does not affect the carbon concentration. On the other hand, the measured carbon concentrations of 2%Si steel after the first gas carburizing are much lower than the calculated concentrations. In contrast, the carbon concentration of b-2 after the second carburizing increases to the nearly calculated value. Therefore, the significant decrease of the carbon concentration in 2%Si steel is considered to be caused by the dense oxide layers which consist of the outer oxide layer (complex oxide containing Mn and Cr) and the inner oxide layer (amorphous Si oxide). Besides, the carbon concentration of b-1 after the second carburizing increases slightly although the oxides were not removed. The increase is considered to be caused by partially flaking off of the oxide layers. Since the difference in the coefficient of thermal expansion of steel and SiO2 is large, SiO2 flakes off easily.12) Therefore, the oxide layers could partially flake off due to the quenching of the first carburizing as shown in Fig. 5.
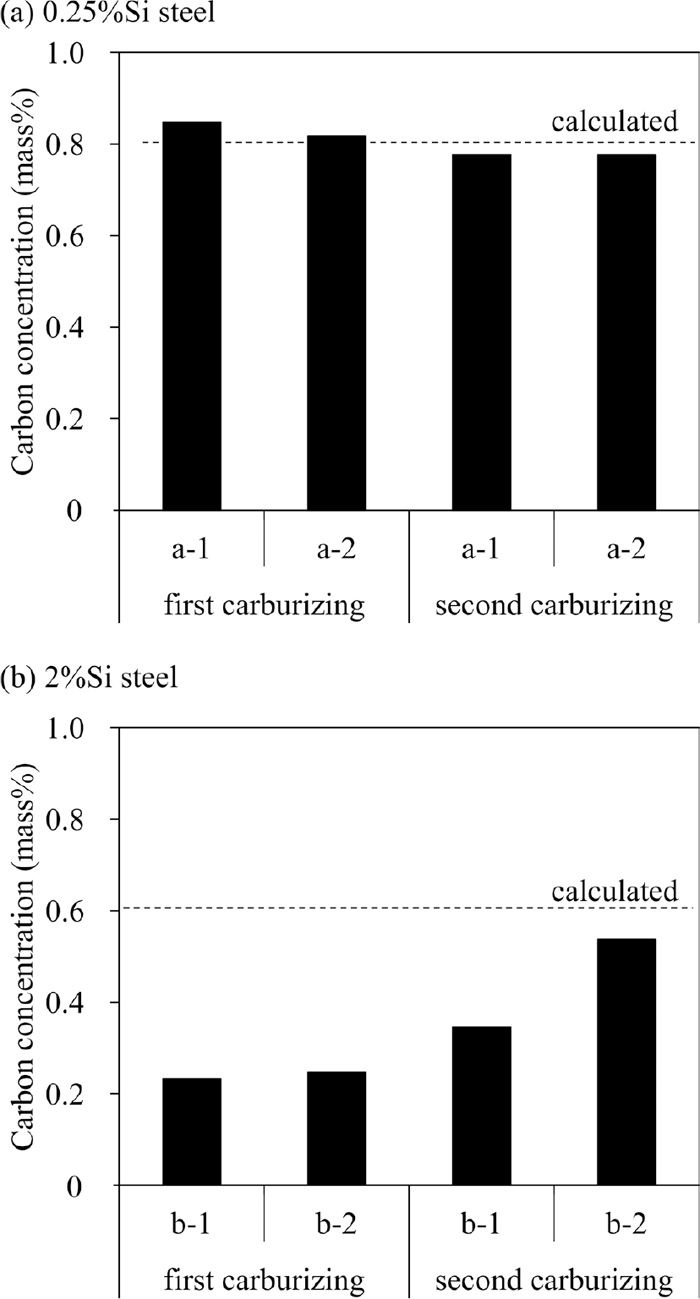
Comparison of carbon concentration in surface layer after first and second carburizing between specimens with and without polishing after first carburizing. (a) 0.25%Si steel, (b) 2%Si steel, a-1) 0.25%Si steel without polishing, a-2) 0.25%Si steel with polishing, b-1) 2%Si steel without polishing, b-2) 2%Si steel with polishing.
From the discussion above, it is considered that there are two mechanisms of the decrease in the surface carbon concentration caused by the increase in the Si concentration. Figure 16 shows the schematic illustration of the mechanisms. 1%Si steel (Fig. 16 (b)): The increase in Si concentration increases the carbon activity coefficient in austenite. It causes the decrease in the carbon concentration. 2%Si steel (Fig. 16 (c)): in addition to the above thermodynamic effect, the dense oxide layers form in the early stage of carburizing and become a barrier between the steel and the carburizing atmosphere. Since the barrier inhibits the carburizing reaction, the carbon concentration is much lower than the aimed value. It was confirmed that this dense oxide layer mainly consists of the outer oxide layer (complex oxide containing Mn and Cr) and the inner oxide layer (amorphous Si oxide). However, it is not clarified which oxide layer is the dominant factor of the inhibition of the carburizing reaction. The amorphous Si oxide layer existed only on the surface of 2%Si steel. It is known that the amorphous Si oxide layer decrease the rate of the decarburization, which is the similar reaction to the carburizing.13) Therefore, it is considered that the amorphous Si oxide layer is the dominant factor of the inhibition of the carburizing reaction.
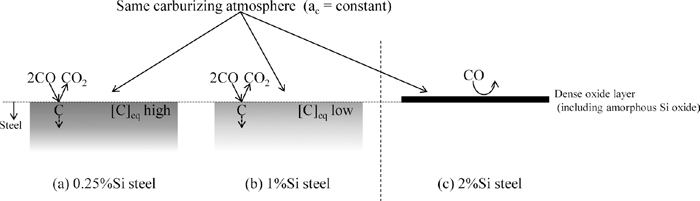
Schematic illustrations of mechanisms for the decrease in carbon concentration in surface layer after gas carburizing that occurs with increasing Si concentration. ac: carbon activity, [C]eq: carbon concentration at equilibrium with carburizing atmosphere.
The effect of the Si concentration on the carbon concentration after gas carburizing in the surface layer was investigated using three kinds of steel having compositions based on JIS SCr420 with varying Si concentrations (0.25%Si steel, 1%Si steel, 2%Si steel) and gas carburizing conditions of CP of 0.8 at 1223 K. The following is concluded:
(1) The carbon concentration in the surface layer after the gas carburizing was decreased with increasing Si concentration. The carbon concentration of 2%Si steel was significantly low. The carbon concentration of 1%Si steel after gas carburizing was nearly equal to the concentration calculated by thermodynamic calculation simulating gas carburizing. On the other hand, that of 2%Si steel was much lower than the calculated concentration.
(2) The internal oxidation layer was formed on the surface of 0.25%Si steel and 1%Si steel. In contrast, the external oxidation was formed on the surface of 2%Si steel. It was confirmed that there is the complex oxide layer containing Fe and Mn on the 0.25%Si steel by the FE-TEM observation. On the other hand, there are two oxide layers which consist of the outer oxide layer (complex oxide containing Mn and Cr) and the inner oxide layer (amorphous Si oxide). The oxide on 2%Si steel was denser than that of 0.25%Si steel.
(3) To investigate the effect of the oxide layer on the carbon concentration in the surface layer, the carbon concentration was measured after a first and second gas carburizing with the oxide layer of some specimens removed and with the depleted layer of all specimens remained in between. The carbon concentration in the surface layer of 2%Si steel increased to the nearly calculated value by removing the oxide layers.
(4) The mechanisms for the decrease in carbon concentration change depending on the Si concentration. The mechanisms are described below:
1%Si steel: The decrease in equilibrium carbon concentration caused by increase in carbon activity of austenite.
2%Si steel: The barrier effect of carburizing reaction caused by the dense oxide layers, and the decrease in equilibrium carbon concentration caused by increase in carbon activity of austenite.