Regular Article
Dynamic Transformation of an X70 Steel under Plate Rolling Conditions
2017 年 57 巻 1 号 p. 162-169
詳細
2017 年 57 巻 1 号 p. 162-169
Torsion simulations of plate rolling were carried out on an X70 steel at 900°C; pass strains of 0.4 and a strain rate of 1 s−1 were employed together with interpass times of 1.0 s, 10.0 s, 20.0 s and 30.0 s. The mean flow stresses (MFS`s) applicable to each pass were calculated by integration of the individual flow curves. These decreased with pass number, indicating that both dynamic transformation and dynamic recrystallization were taking place during straining. The critical strains for the initiation of dynamic transformation were determined by double differentiation and fell in the range 4–5% from the second to the last pass. The volume fraction of dynamically formed ferrite retained after a simulated rolling pass decreased with interpass time. This was due to the increased amount of ferrite retransformed into austenite during the longer interpass times. The forward transformation is considered to occur displacively while the retransformation into austenite during holding takes place by a diffusional mechanism.
Dynamic transformation (DT) was first studied by Yada and co-workers in the 1980’s using compression tests as well as strip rolling simulations.1,2) They showed that fine grains of ferrite were produced by deforming above the Ae3 and that the volume fraction of ferrite increased with the strain and decreased with the temperature as well as the holding time after the last pass. They later employed in situ X-ray diffraction to confirm that the ferrite was being formed during straining.3)
More recently Basabe et al.,4) conducted torsion tests on a 0.036% Nb microalloyed steel and reported that both the forward and the reverse transformation were retarded by the addition of niobium. In some follow-up experiments, Grewal et al.5) showed that ferrite can be formed everywhere within the austenite phase field.
These observations have now been given a sound thermodynamic interpretation by Aranas et al.,6,7) who proposed that the driving force for ferrite formation is the softening that takes place during transformation. This is evaluated from the difference between the current flow stress of the work-hardened austenite and the yield stress of the fresh Widmanstätten ferrite that takes its place. According to this model, this driving force is opposed by the chemical free energy difference between the austenite and the Widmanstätten ferrite as well as the lattice dilatation work and shear accommodation work that accompany the transformation.
To date, this phenomenon has only been investigated under strip rolling conditions and not under the longer interpass times involved in plate rolling. The aim of this work was therefore to investigate the role of DT under plate rolling conditions. The results obtained are described in detail below.
An X70 Nb microalloyed steel was investigated in the present study. Its chemical composition is presented in Table 1, together with its corresponding paraequilibrium and orthoequilibrium Ae3 temperatures. The Ae3 temperatures were calculated using the FactSage software.8) The material was supplied in form of hot rolled plates with a thickness of 12.5 mm. The steel plate was machined into cylindrical torsion specimens with diameters of 6.35 mm and lengths of 22.0 mm. The cylinder axes were parallel to the rolling direction.
| C | Mn | Si | Cr | Nb | Orthoequilibrium Ae3 | Paraequilibrium Ae3 |
|---|---|---|---|---|---|---|
| 0.047 | 1.56 | 0.25 | 0.21 | 0.092 | 845°C | 810°C |
The simulations were conducted on a computer-controlled MTS torsion machine equipped with a radiation furnace and a temperature controller. Thermocouples were spot welded to the mid-lengths of the torsion specimens in order to provide accurate temperature measurements during straining. The samples were protected by an argon gas atmosphere so as to minimize oxidation and decarburization during testing. The torque/twist data were converted into equivalent stress/strain form using the following equations, introduced by Fields and Backofen.9)
| (1) |
| (2) |
This then leads to:
| (3) |
The equivalent strain is in turn calculated using the equation
| (4) |
The small diameter increases that took place during free-end torsion testing were taken into account in calculating the stress-strain curves from the torques.10)
For the simulations, for ease of interpretation of the results, only isothermal conditions were employed. These can also be taken to represent the operation of a Steckel mill. The samples were heated to 1200°C at the rate of 1°C/s and held there for 20 minutes for total austenitization. They were then cooled at 1°C/s to 1100°C and maintained at this temperature for 60 seconds before a simulated roughing pass was applied at a strain rate of 1.0 s−1 to a strain of 0.4. After the roughing deformation, the samples were held at 1100°C for 90 s to allow complete recrystallization before being cooled down to the final test temperature of 900°C (90°C above the Ae3) at the rate of 1°C/s. The samples were held at these temperatures for 7 min before applying the first pass of the set of deformations. Then, the samples were subjected to seven deformation passes by applying a strain of 0.4 in each pass at a strain rate of 1.0 s−1. Times of 1, 10, 20 and 30 s were employed between passes. After the 1st, 3rd, 5th and 7th passes, samples were quenched to permit quantification of the volume fraction of the dynamically formed ferrite produced per pass and the measurement of their hardnesses. The thermomechanical schedules employed are illustrated in Fig. 1.
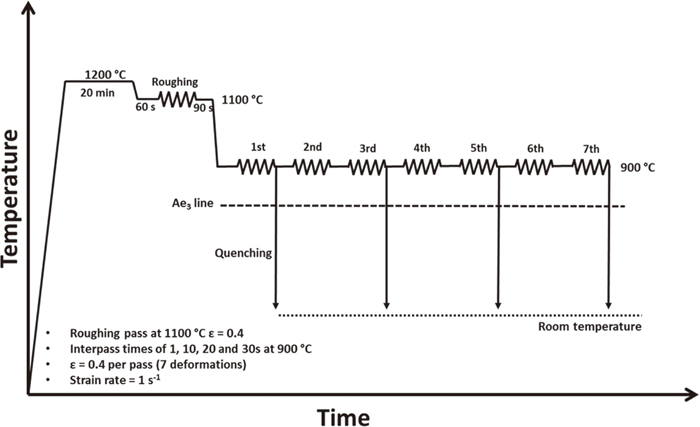
Torsion testing schedule for the plate rolling simulations. The deformation temperature was 900°C and interpass times of 1, 10, 20 and 30 s were employed.
The torsion samples were sectioned both transversely and longitudinally to provide cross-sections for microstructural examination as shown in Fig. 2. The transverse cross-section provides a series of microstructures corresponding to increasing strains since there is no strain at the center of the sample and this value is at a maximum at the surface. The longitudinal cross-section on the other hand, displays the changes in grain shape that accompany straining. The samples were hot mounted and polished using silicon carbide paper grits of 400, 600, 800, 1000 and 1200 while being lubricated with water. For final polishing, a diamond paste (3 μm and 1 μm) suspension was used followed by a 0.02 μm colloidal silica suspension. The polished samples were then etched with a 2% nital solution for approximately 15–20 seconds and then treated with a 10% aqueous sodium metabisulfite (Na2S2O5) solution in order to improve the contrast between ferrite and martensite. The initial microstructural analysis was carried out using optical microscopy. Later, SEM and EBSD techniques were employed to provide more detailed microstructural information.
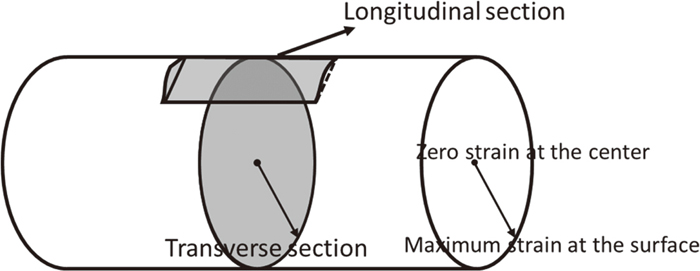
Schematic diagram of the transverse and longitudinal cross-sections in the torsion sample.
The flow curves obtained from the 7-pass simulations are illustrated in Figs. 3(a), 3(b), 3(c) and 3(d), for interpass times of 1, 10, 20 and 30 seconds respectively. These tests were performed at 90°C above the paraequilibrium Ae3 temperature, see Table 1. No cooling was applied between passes so that no flow stress corrections were required to offset the effect of decreasing temperature. In the absence of phase transformation and of dynamic recrystallization, the flow stress levels should not change significantly from pass to pass during constant temperature deformation. However, the peak stresses decreased perceptibly from the second pass to the final pass in all the tests.

Stress-strain curves determined on the X70 steel according to the schedule in Fig. 1 using pass strains of 0.4 applied at 1 s−1. Interpass times of (a) 1 s, (b) 10 s, (c) 20 s and (d) 30 s.
The shapes of the curves indicate that there is considerably less static recrystallization between passes at shorter interpass times. As the time between passes is increased, more static softening takes place, reducing the amount of retained work hardening. The increase in stress level for the second pass is associated with strain accumulation and the gradual decrease after this pass can be attributed primarily to the progressive formation of ferrite. Previous research has shown that dynamic transformation also contributes to the decreasing flow stress levels.7,11,12,13,14,15,16,17)
3.2. Optical MicroscopyIn the present investigation, all the ferrite volume fraction measurements were carried out on longitudinal samples taken from about 250 μm below the surface of the sample. This was so as to avoid the oxidized outer layer. The results that correspond to the 10 s interpass time are presented in Fig. 4. Here martensite (prior austenite) appears dark while ferrite is light.
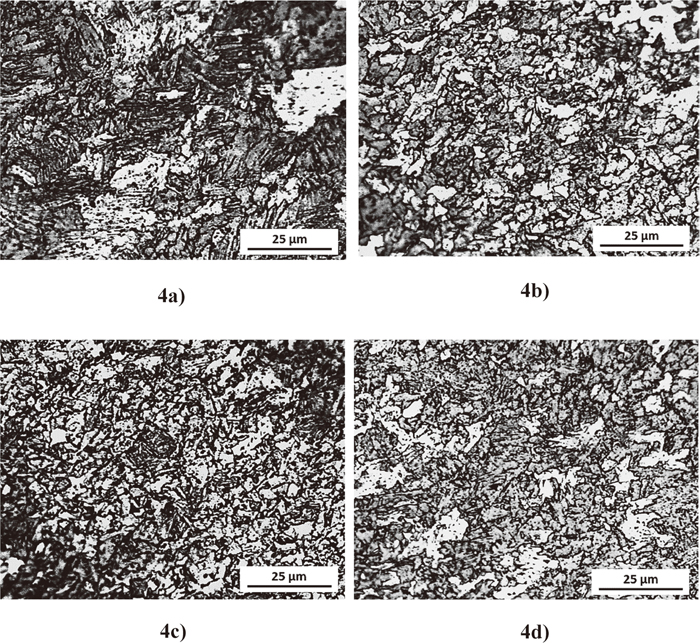
Optical microstructures of the present material subjected to the 7-pass simulation with interpass times of 10 s. The samples were quenched immediately after the: (a) 1st pass, (b) 3rd pass, (c) 5th pass and (d) 7th pass. Light regions are ferrite while the dark regions are martensite (prior austenite).
It can be seen that ferrite is present after the first pass (Fig. 4(a)) and that the volume fraction has increased after the 3rd pass (Fig. 4(b)), still more after the 5th pass (Fig. 4(c)), as well as after the 7th pass (Fig. 4(d)). The ferrite is mostly present in the form of polygonal grains. It is also possible to see grain elongation in the micrographs, where the major axis of the grain gradually approaches the horizontal axis. This is particularly visible after the 5th and 7th passes. The volume fraction of ferrite can be seen to increase progressively during simulated rolling, a topic that is to be examined in more detail below.
In hot rolling, the evolution of the mean flow stress (MFS) provides insight into the progress of metallurgical phenomena such as work hardening, static and dynamic softening, carbonitride precipitation, as well as dynamic transformation. Here, Eq. (5) was employed to calculate the MFS’s that correspond to all the flow curves in Fig. 3.
| (5) |
In Eq. (5), σeq is the equivalent stress and (εb – εa) is the equivalent strain applied in each pass. The results obtained in this way are presented in Fig. 5 for interpass times of 1 s, 10 s, 20 s and 30 s.

MFS’s curves derived from the stress-strain curves of Fig. 3. The MFS`s increase from the 1st to the 2nd pass and then decrease in the succeeding passes. This decrease results from the formation of DT ferrite during each pass. There is strain accumulation from the 1st to the 2nd (and 3rd pass) and more work hardening is retained from pass to pass when the interpass time is decreased.
It can be seen that the MFS increases from the first to the second pass in all the tests as a result of strain accumulation. The increase amounts to about 20% for all interpass times. The MFS’s drop continuously from the second or third through to the last pass, indicating that ferrite (which is softer than austenite) is being formed in each pass. The optical microstructures of Fig. 3 support this interpretation; these were employed to determine the ferrite volume fractions that will be shown below. It is also evident that the rate at which the MFS decreases from pass to pass decreases as the length of the interpass time is increased. This is due to the increased time available for the back transformation of ferrite into austenite.
4.2. Critical StrainsAlthough flow curve levels normally remain constant when a steady state is attained while testing at a fixed temperature, it is clear that the levels displayed a steady decrease during the present simulations. To investigate this unusual behavior, the double differentiation method of analysis was applied to the stress-strain curves of Fig. 3 using the MatLab software. This was done by fitting the curves from the 0.2% offset yield stress to the peak stress using a 9th order (or higher in some cases) polynomial. For this purpose, the local N value N’ was employed, which is the instantaneous twist hardening exponent. This is because use of N’ leads to more accurate descriptions of the basic flow curve.18)
Double differentiation was employed to determine the critical stresses for the onset of DT and DRX, as demonstrated by previous workers.11,19) According to this method, the dependence of the work hardening rate θ = dσ/dε on stress is first derived for a given stress-strain curve, see Figs. 6(a) and 6(b). The second derivative of the stress (dθ/dσ) is then plotted against stress, as shown in Fig. 6(c). This method identifies the minima that correspond to the initiation of DT and DRX. These minima are associated with the inflection points identified in Fig. 6(b). The inflections in turn indicate the strains at which new softening mechanisms begin to operate.11,19) The concepts involved in this procedure are discussed in more detail in Ref. 20). This analysis showed that two distinct softening mechanisms are initiated at strains well before the peak strain.

Procedure employed to determine the critical stresses and strains associated with the initiation of the softening mechanisms acting during thermomechanical processing: (a) Typical stress-strain curve determined in torsion on the present material at a strain rate of 1 s−1; (b) Plot of working hardening rate θ versus σ, and (c) Dependence of the second derivative −(dθ/dσ) on σ.
The −(dθ/dσ) versus σ curves for the present material at interpass times of 1, 10, 20 and 30 seconds are illustrated in Fig. 7. The first minimum identifies the start of dynamic transformation (DT), while the second specifies that of dynamic recrystallization (DRX). As shown in earlier studies using microstructural analyses,6,7,21) the critical strain for DT is always lower than that for DRX.
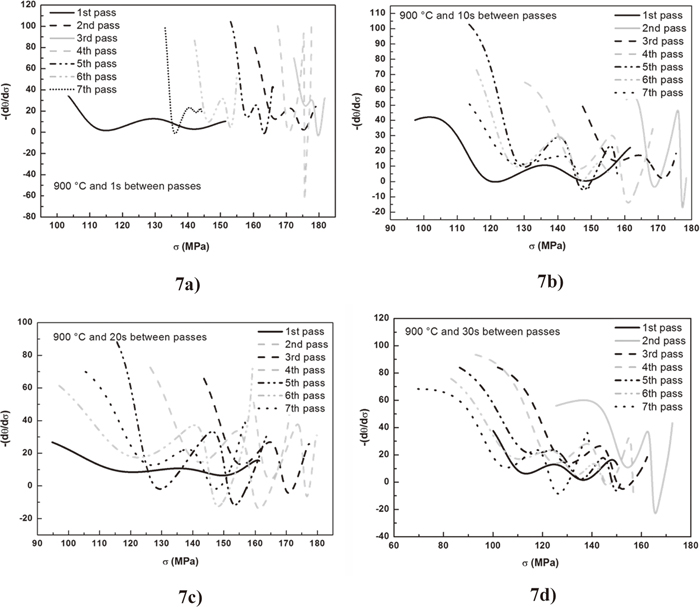
Plots of −(dθ/dσ) versus σ used to identify the minima related to the initiation of DT and DRX for interpass times of (a) 1 s, (b) 10 s, (c) 20 s and (d) 30 s.
The critical strains required to initiate DT and DRX determined in this way are illustrated in Figs. 8(a), 8(b), 8(c) and 8(d) for interpass times of 1 s, 10 s, 20 s and 30 s, respectively. In all cases, the first pass DT critical strain (average value 0.076) is higher than in the succeeding passes, (average 0.04). Similar remarks apply to the DRX critical strains, as the average values were 0.14 for the first pass and 0.10 for the succeeding second to the seventh passes.
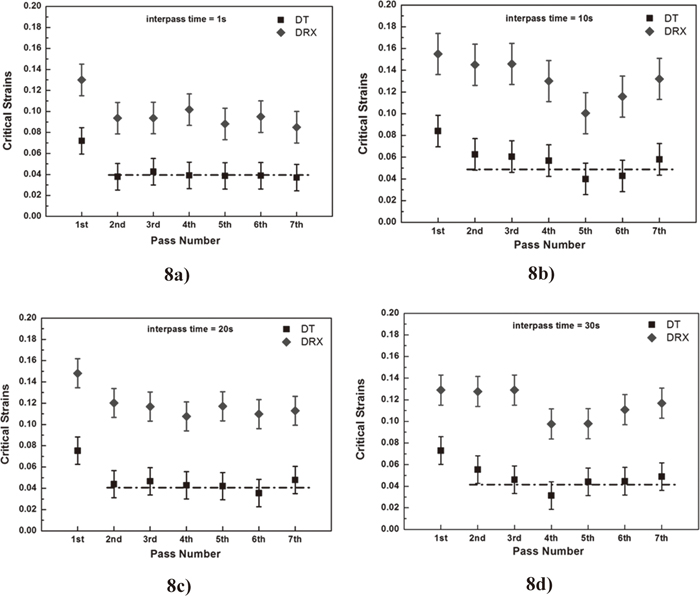
Critical strains for dynamic transformation (DT) and dynamic recrystallization (DRX) as a function of pass number. Interpass times of (a) 1 s, (b) 10 s, (c) 20 s and (d) 30 s. Here the first pass always displays the highest critical strain.
This is because the first pass is applied to recrystallized austenite, whereas there is retained work hardening in the material of the succeeding passes, reducing the DT critical strains in this way.
4.3. The Effect of Pass Number on Volume Fraction of Dynamically Transformed FerriteThe volume fractions of ferrite retained after interpass times of 10 s, 20 s and 30 s are displayed in Fig. 9 together with the Vickers hardness measurements that correspond to these microstructures. It is clear that increases in the amount of ferrite are accompanied by corresponding decreases in the overall hardness. The hardness value before roughing was 345 HV and the progressive formation of DT ferrite lowered these values progressively until the 5th pass, then a slight increase in hardness was observed after the last pass in all the tests. This is associated with the decrease in ferrite volume fraction after the last pass.

Dependence of the volume fraction of ferrite on pass number. The increasing and decreasing amounts of ferrite are consistent with the hardness values also shown.
The presence of a small amount of ferrite, about 6%, was evident after the roughing pass; this increased to about 19% after the first pass. During the subsequent passes, the volume fractions of ferrite increased to 30%, 23% and 21% after the 3rd pass and 33%, 27% and 23% after the 5th pass for the 10, 20 and 30 second interpass times, respectively. After the seventh pass, the volume fractions of ferrite were reduced to 26%, 22% and 17% for the 10, 20 and 30 second schedules, respectively. It should be borne in mind that the reverse transformation is diffusional rather than displacive and therefore time-dependent. During the long interpass times, Nb solute drag probably prevented much reverse transformation, although this became less effective as the total interpass time increased.22,23) The decrease in effectiveness might also be associated with coarsening of the NbCN precipitates.
4.4. SEM and EBSD AnalysisScanning electron micrographs of samples deformed and held for 20 seconds after the 1st pass as well as after the 5th pass are illustrated in Figs. 10(a) and 10(b) respectively. The microstructures reveal the presence of two phases, ferrite and martensite (prior austenite), where the ferrite volume fraction increases with pass number and is mostly of polygonal form. Figures 10(c) and 10(d) illustrate the microstructures formed by reduced pass strains of 0.05 at locations near the center of the samples. As mentioned above in section 2.2, the strain in the torsion sample increases from zero at the centers to a maximum at the surface. In this way, when the strain at the surface was 0.4 (rs = 3.2 mm), it was 0.05 at one eighth of the radius of the sample, that is at r = 0.4 mm. Here, some freshly formed DT ferrite can be seen, which is predominantly plate-like in form. Some typical straight interfaces characteristic of these microstructures are highlighted with black arrows. These interfaces indicate that the newly-formed plates are Widmanstätten in nature and have formed displacively. The plates later coalesce into polygonal ferrite upon further straining.24) These microstructures are similar to those that have been reported in other steels when dynamic transformation is taking place.25,26)

Scanning electron micrographs of samples deformed using interpass times of 20 s and quenched: (a) after the 1st pass and (b) after the 5th pass (the ferrite is mostly of polygonal form); (c) and (d) after the 5th pass in a region of the sample subjected to pass strains of 0.05; plates of Widmanstätten ferrite can be seen that have formed displacively.
The presence of DT ferrite in the present samples was confirmed using EBSD techniques of phase identification. This is illustrated here in Fig. 11, where inverse pole figure (IPF) plots related to the orientations of the ferrite formed are shown on the left side of the diagram while the phase distributions are displayed on the right-hand side. The red regions represent the ferrite and the unindexed black ones identify the martensite (prior austenite). Here the volume fractions of ferrite are higher after the 5th pass, Fig. 9(b) than the after the 3rd pass, Fig. 9(a). This is consistent with the volume fraction measurements presented above. It is also worth noting that the grain size decreases as the pass number is increased.
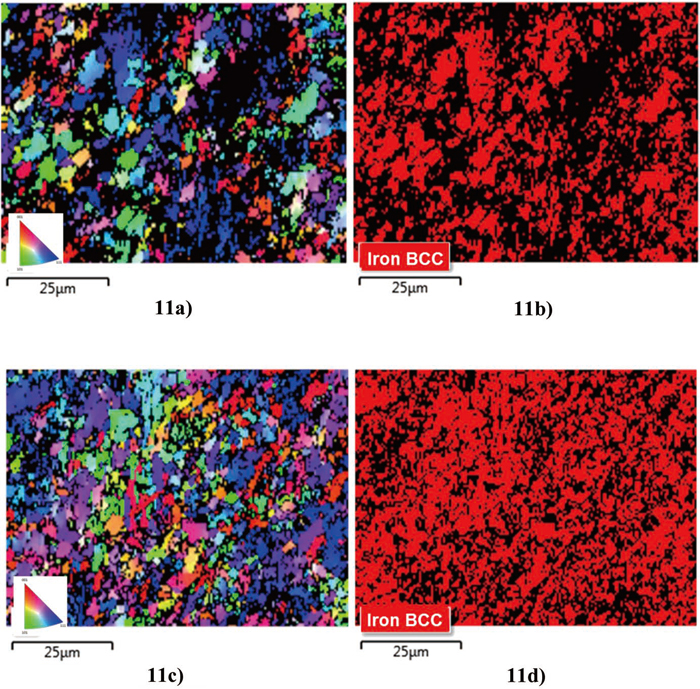
EBSD micrographs of transverse cross-sections of samples subjected to 10 s interpass times. The samples were quenched immediately after straining on the 3rd pass; (a) pole figure and (b) phase identification. After straining on the 5th pass; (c) pole figure and (d) phase identification. In (b) and (d) the ferrite phase is red while the prior austenite is black.
The significant amounts of ferrite formed during rolling are not available for transformation on the cooling bed. For this reason, it is important to know the volume fraction of ferrite produced during rolling so that improved cooling/transformation models can be developed applicable to plate rolling.
Dynamic transformation under plate rolling conditions was examined on an X70 steel by means of torsion tests carried out at 900°C. Analysis of the results led to the following conclusions.
(1) The MFS increases from the first pass to the second due to strain accumulation. It then decreases substantially from the second to the final pass for all the interpass times employed here. The decreases result from the formation of DT ferrite during all the passes applied during the simulations.
(2) The volume fraction of DT ferrite increases until the fifth or sixth pass and then decreases. Although Nb addition appears to retard reverse transformation, this becomes less effective when the total interpass time reaches high levels.
(3) The DT critical strains are always higher in the first pass than in the succeeding passes. This is due to the retained strain in the subsequent passes.
(4) The volume fractions of DT ferrite formed and retained in the simulations are higher for shorter interpass times than for longer times. This occurs because some of the metastable DT ferrite retransforms back into the more stable austenite during the longer intervals. This led to about a 5% decrease in ferrite volume fraction after the last pass when the interval was increased by 10 s.
(5) Knowledge of the amount of ferrite present at the beginning of cooling can be used to design improved models for the microstructures formed during transformation on cooling beds.
The authors acknowledge with gratitude funding received from the Brazilian National Council for Scientific and Technological Development (CNPq), the McGill Engineering Doctoral Award (MEDA) program, and the Natural Sciences and Engineering Research Council of Canada. They also thank Mr. Jon Jackson and Dr. Laurie Collins from the EVRAZ North America Research and Development Centre (Regina) for providing the steel investigated in this research.