Regular Article
Measurement of Interaction Parameter between Cu and Al in Molten High Al Steel
2017 Volume 57 Issue 4 Pages 625-629
Details
2017 Volume 57 Issue 4 Pages 625-629
The interaction parameter between Cu and Al in molten iron containing high levels of Al was measured using a chemical equilibrium technique. A molten Fe–Al alloy was equilibrated with a molten Ag–Cu alloy in an Al2O3 crucible at 1823 K. The activity coefficient of Cu in Fe–Al alloys was measured to be −2.33 while varying the concentration of Al in a range from 0.04–0.2 mol%. The influence of Cu on the deoxidation equilibrium of Al and O was estimated using the above interaction parameter. The results indicate that under a constant Al concentration, a contamination of several percent of Cu raises the O concentration in high Al steel.
Al has been widely used as a deoxidation agent in the steel-making process.
Recently, in addition to being used as a deoxidation agent, Al has been used as an alloying element. The effects of Al on the phase transformation of steel from austenite to ferrite and on the formation of carbide is of considerable interest in the development of transformation-induced plasticity steel (TRIP steel).1) For example, the addition of 1 mass% or more of Al suppresses pearlite transformation and stabilizes residual austenite.1) Twinning-induced plasticity steel (TWIP steel) also contains about 1.5 mass% Al to prevent hydrogen embrittlement.2) Irrespective of whether Al is used as a deoxidation agent or alloying element, the thermodynamic relationship between Al and O in molten steel is of great importance. Therefore, the equilibrium relationship between Al and O that is dissolved in molten steel has been measured by many researchers in the concentration range of 0.5 to 10 mass% of Al.3,4) In addition, the measurement of the interaction parameter between Al and O in liquid iron has also been conducted. In addition to O, the interaction parameters between Al and other deoxidation elements such as Mn and Ca have also been reported.3) However, the measurements mainly focus on the elements that commonly exist in molten steel, and the interactions between Al and tramp elements, such as Cu, have yet to be fully understood.
The Cu content in steel causes cracking of the surface during hot rolling(hot-shortness), and thus its concentration must be limited to a level less than 0.1–0.2 mass%. The contamination source of Cu is electric wire contained in steel scrap. The process of removal of Cu from steel has been thoroughly studied.8,9,10) Because the affinity between Cu and O is weaker than that between Fe and O, Cu cannot be removed from steel by oxidation. Therefore, methods of removing copper using sulfide flux have been reported.9,10) In spite of such research, Cu removal during the steel-making process remains a difficult task. Therefore, the use of scraps containing Cu has been limited to avoid Cu contamination.7)
Currently, high Al steel does not contain Cu, but in future, the utilization of scraps for making high Al steel can raise the concentration of Cu. Although the activity coefficient of Cu in iron is well known,11) there has not been much research on this subject in the case of high Al steel. Data on the thermodynamic interactions between Al and Cu in iron can be used to estimate the limit of Cu required to suppress the hot-shortness and the distribution ratio of Cu between slag and metal when Cu containing scrap is recycled into high Al steel.
On the basis of the above research background, we measured the interaction parameter of Cu and Al in liquid iron at 1823 K. In addition, the influence of Cu on the deoxidation equilibrium of Al and O was estimated by means of the measured interaction parameter.
A molten Ag–Cu alloy was equilibrated with a Fe–Al alloy. Reagent grade Ag, Cu, Fe, and Al were employed for preparing the sample. The Fe–Al alloy was prepared by melting Fe and Al together in an arc furnace followed by quenching. To suppress O contamination during alloy preparation, C bricks were placed inside the chamber of the arc furnace. The oxide film on the Fe–Al alloy was removed using a cutter before analysis. In order to saturate the Ag–Cu and Fe–Al systems with Al2O3, a high purity Al2O3 crucible was employed as a container. The initial composition of Cu in the Ag–Cu alloy was set as 8 mol%. The composition of the Fe–Al alloy was controlled by mixing the alloy and Fe at predetermined ratios (Table 1). The Al concentration of the Fe–Al alloy was varied from approximately 0.6 mol% to 13.7 mol%.
| Fe–Al phase | Ag–Cu phase | |||
|---|---|---|---|---|
| Sample | XFe | XAl | XAg | XCu |
| No. 1 | 0.813 | 0.187 | 0.841 | 0.159 |
| No. 2 | 0.902 | 0.098 | 0.841 | 0.159 |
| No. 3 | 0.959 | 0.041 | 0.841 | 0.159 |
| No. 4 | 0.980 | 0.020 | 0.841 | 0.159 |
| No. 5 | 0.990 | 0.010 | 0.841 | 0.159 |
The temperature of the hot zone was controlled at 1823 K (within ±3 K). An Al2O3 tube of ϕ50 mm inner diameter was installed in the furnace. A continuous flow of high purity Ar gas at 200 ml/min was used to prevent oxygen from entering the system.
An approximately 7 g mixture of Ag and Cu and an 8 g mixture of Fe and the Fe–Al alloy were placed in an alumina crucible. As shown in Fig. 1, the crucible was placed on an alumina holder and a graphite lid was put on top of the crucible.

Schematics of experimental apparatus.
After flushing the reaction tube with Ar gas for 1800 s, the holder containing the crucible was slowly lowered into the reaction tube, and placed on a support stage located in the hot zone. After heating for 7200 s, the sample was withdrawn from the furnace and quenched by a helium gas stream. The time required to achieve equilibrium between the two liquid alloy phases was predetermined as 7200 s. After cooling, the sample was separated into Fe–Al and Ag–Cu phases, and cut into 0.1 g pieces using a cutting machine. The composition of each element was determined by inductively coupled plasma atomic emission spectrometry (ICP-AES). Some samples were cut and polished for cross-sectional analysis via field emission electron probe microanalysis (EPMA).
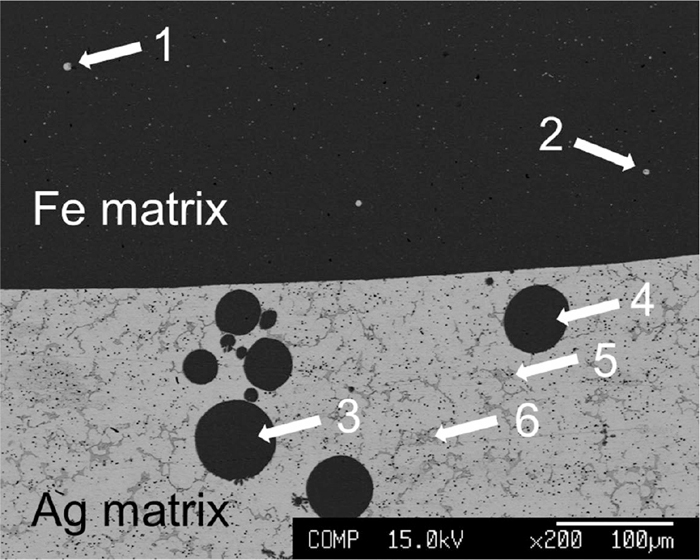
Figure 2 shows the appearance of sample No. 1 after quenching. The Fe–Al and Ag–Cu phases had separated vertically, and the surface was slightly oxidized. In the observed cross-section in Fig. 3, no large suspended particles were visible. The cross section of the interface between Fe–Al and Ag–Cu of sample No. 1, observed using EPMA, is shown in Fig. 3. Figures 4 and 5 show the matrix phase of the Fe–Al and Ag–Cu alloys, respectively. Compositions of the matrix and inclusions in the Fe–Al and Ag–Cu phases in Fig. 3 are listed in Table 2.

The appearance of the sample after experiment.
Cross section of sample vicinity of the interface between Fe–Al and Ag–Cu phases.

Characteristic X ray image of Fe.

Characteristic X ray image of Ag.
| Phase | Place | Fe[mol%] | Al[mol%] | Ag[mol%] | Cu[mol%] |
|---|---|---|---|---|---|
| Fe phase | Fe matrix | 96.81 | 0.52 | 0.04 | 2.63 |
| No. 1 | 4.66 | 0.51 | 85.80 | 9.03 | |
| No. 2 | 6.58 | 0.30 | 79.76 | 13.37 | |
| Ag phase | Ag matrix | 0.07 | 0.49 | 89.46 | 9.98 |
| No. 3 | 97.20 | 0.64 | 0.03 | 2.12 | |
| No. 4 | 96.74 | 0.59 | 0.35 | 2.31 | |
| No. 5 | 0.23 | 2.80 | 57.15 | 39.82 | |
| No. 6 | 0.18 | 1.98 | 60.24 | 37.61 |
Small inclusions of the Ag alloy (positions labelled 1 and 2 in Fig. 3) can be seen in the Fe–Al phase. However, such inclusions are not observed in Fig. 4. Larger iron alloy inclusions (positions labelled 3 and 4 in Fig. 3) are seen in the Ag–Cu phase. The large particles of Fe are seen only in the vicinity of the interface. Based on their shape and size, it can be concluded that the existence of these particles was caused by suspension. In Fig. 5, Fe based small inclusions are observed at position 7. These inclusions have precipitated between the dendrite structures of the Ag phase, and are smaller than the suspended particles seen in Fig. 4. Therefore, they can be considered as iron based phases precipitated from the Ag–Cu phase during solidification. This result indicates that the compositions of the molten phases can be determined by chemical analysis of the matrix sample.
The results of the ICP-AES measurements are given in Table 3, where Xi is the mole ratio of element i in the samples. The amount of Fe and Ag that transitions into another phase is small, and the maximum concentrations of Ag and Cu in the Fe–Al phase were 0.020 and 0.041 mole, respectively. On the other hand, mole fraction of Al in the Ag–Cu phase was at most 0.106 mole. The Al concentration of the Ag–Cu phase increased with the increase of the initial Al concentration in the Fe–Al alloy.
| Fe–Al phase | Cu–Ag phase | |||||||
|---|---|---|---|---|---|---|---|---|
| Sample | XFe | XAl | XAg | XCu | XFe | XAl | XAg | XCu |
| No. 1 | 0.81 | 0.137 | 0.020 | 0.034 | 0.015 | 0.106 | 0.76 | 0.11 |
| No. 2 | 0.90 | 0.051 | 0.008 | 0.041 | 0.007 | 0.042 | 0.79 | 0.16 |
| No. 3 | 0.93 | 0.027 | 0.008 | 0.030 | 0.006 | 0.022 | 0.84 | 0.13 |
| No. 4 | 0.95 | 0.009 | 0.007 | 0.032 | 0.006 | 0.007 | 0.85 | 0.14 |
| No. 5 | 0.96 | 0.006 | 0.004 | 0.030 | 0.007 | 0.006 | 0.85 | 0.13 |
In order to determine the interaction parameter of Al and Cu in molten iron, the activity of Cu in the Al–Cu phase was initially calculated. The relationship between the activity of Cu in the Fe–Al and Ag–Cu phases is represented in Eq. (1) below:
| (1) |
| (2) |
| (3) |
According to Eqs. (1) and (3), the activity of Cu in the Fe–Al phase at 1823 K can be derived from the composition of the Ag–Cu phase. Moreover, the activity coefficient of Cu in the Fe–Al phase can be determined from the mole fraction of Cu in the Fe–Al phase by means of Eq. (3).
Using the data shown in Table 3 and data for pure Fe obtained from literature,11) the relationship between the natural logarithm of the activity coefficient of Cu in Fe–Al phase and the concentration of Al in the alloy phase at 1823 K is shown in Fig. 6. The activity coefficient decreases with an increase in concentration of Al in the Fe–Al phase. The activity coefficient of Cu can be represented using a first order interaction parameter:
| (4) |
| (5) |
| (6) |

The relationship between
| γCu in Ag (XCu=0.1) at 1423 K | γCu in Fe (XCu=0.1) at 1823 K | γCu_0 in Fe at 1823 K | |
|---|---|---|---|
| Hultgren et al.9) | 2.656 | 5.575 | 9.512 |
The equilibrium between solid Al2O3 and, Al and O in steel is denoted as,
| (7) |
| (8) 3) |
| (9) |
| (10) 3) |
| (11) |
| (12) |
| (13) |
| JSPS3) | 80.5/T | −1.98 | −1.17 | −1750/T+0.76 | −0.013 | ― | ― | ― | ― | ― |
| Kang et al.10) | 0.043 | −0.393 | −0.231 | −0.174 | −0.013* | −0.001 | −228 | 0.026 | −271 | 0.092 |
As a case study, the relationship between Al and O in the molten Fe–Al alloy with 3.3 mol% Cu saturated with Al2O3 at 1873 K is calculated (Fig. 7). No components other than Fe, Cu, Al, and O were considered in the Fe–Al phase. The solid and broken lines denote the relationships with and without coexisting Cu, respectively. The grey lines are the result calculated taking into account only the first order interaction parameters, and the black lines are from calculations considering both first and second order parameters. Dotted lines are the calculated result for steel with 3 mass% Cu contamination. It can be seen that the concentration of O increased slightly in the presence of Cu in both the cases. However, when the concentration of Al is increased, the effect of the mass% of Cu becomes relatively smaller than the effect of the mass% of Al. Therefore, the effect of Cu on the concentration of O becomes smaller in the high Al concentration region.

Concentration of O in Fe–Al alloy saturated with Al2O3 at 1873 K.
The compositions of the alloy phases that resulted from the equilibration of a Ag–Cu alloy with a Fe–Al alloy under Al2O3 saturation condition at 1823 K were measured. From the results, the interaction parameter between Cu and Al in molten Fe at 1823 K was determined:
Using the regular solution approximation, the interaction parameter at 1873 K was estimated as follows:
Based on the above results, we also estimated the effect of Cu on the Al/Al2O3 equilibrium in molten steel at 1873 K. The results indicate that when the Al concentration is constant, a contamination of several percent of Cu raises the O concentration in steel.
Present research was carried out with the support by ISIJ Research Promotion Grant. The authors express their sincere thanks.