Regular Article
Recrystallization Behavior and Texture Evolution in Severely Cold-rolled Fe-0.3mass%Si and Fe-0.3mass%Al Alloys
2017 年 57 巻 5 号 p. 921-928
詳細
2017 年 57 巻 5 号 p. 921-928
The effect of Si and Al additions on the recrystallization behavior of severely cold-rolled Fe by 99.8% reduction was investigated in comparison with a previous study on pure Fe.6) In Fe-0.3mass%Si alloy, recrystallized grain with {411}<011> and {411}<148>preferentially nucleated at an early stage of recrystallization, and the texture did not changed substantially with the progress of recrystallization, which supports the oriented nucleation theory. The {411}<148> texture significantly increased at the expense of recrystallized grains with {100}<023> and ND//<111> during normal grain growth. In Fe-0.3mass%Al alloy, dynamic recovery during heavy cold-rolling and substantial subgrain growth during low temperature annealing (350°C) occurred, similar to the case of pure Fe and different from that of Fe-0.3mass%Si alloy. This is presumably because of the subtle influence of Al addition on cross-slip frequency and smaller solute-dislocation/vacancy interaction as compared with Si addition. Furthermore, at the early stage of recrystallization, the tendency of oriented nucleation became weaker in Fe-0.3mass%Al alloy than that in Fe-0.3mass%Si alloy. With the progress of recrystallization, {100}<012> and {111}<112> orientations intensified. In the following normal grain growth, {100}<012> texture intensified. However, the change in the texture during growth cannot be explained only by the size effect. A rigorous grain growth simulation model is required to explain the experimental facts by considering the dependency of grain boundary mobility and energy on grain boundary characteristics.
The formation mechanisms of recrystallization texture in steels vary depending on chemical compositions, cold rolling reduction rate, and annealing conditions. For example, Verbeken et al. investigated the recrystallization process of ultra low carbon steel cold-rolled at a reduction rate of 95% and reported the importance of the preferred orientation growth theory in the sense that recrystallized grains with {554}<225> and {311}<147> orientations preferentially grew into unrecrystallized grains with {211}<011> orientation.1) In contrast, Gobernado et al. explained the formation of recrystallization texture based on the oriented nucleation theory of recrystallization in a Fe-3.2mass%Si alloy that was cold-rolled at 95% reduction in which recrystallized grains with {311}<136> orientation preferentially nucleated in the deformed grains with {100}<011> orientation and recrystallization completed by their growth,2) despite the fact that the deformed {100}<011> grains are usually very difficult to recrystallize. As indicated above, even at the same cold-rolling reduction rate of 95%, recrystallization texture as well as formation mechanisms of recrystallization texture vary depending on the chemical compositions of steel. Thus no unified theory has been shown. Meanwhile, Quadir et al. also conducted research with a focus on the heterogeneous deformation structure and its role on recrystallization in α-fiber grains of severely cold-rolled IF steel.3) Close investigation into the microstructure of the grain with {100}<011> orientation which is the typical α-fiber texture, exhibited the heterogeneous deformation structure due to severe deformation and they provided nucleation sites for {411} recrystallized grains. On the other hand, {211}<011> was a stable orientation, where microstructures were rather uniform, and they were presumably encroached by recrystallized grains nucleated in other sites. In addition, Honma et al. reported that recrystallized grains with {h11}<1/h, 1, 2> formed from local high strained regions in the vicinity of the grain boundaries with the {100}<011> to {211}<011> grains in severely cold-rolled iron.4) Furthermore, Walter et al. investigated the evolution of heterogeneous deformation structure and recrystallization textures after cold-rolling {100}<001> Fe-3mass%Si single crystal with 10 to 90% reduction, and they pointed out that a stable cold-rolling orientation was {100}<011>; however transition bands formed along the rolling direction and they acted as the preferential nucleation site of {100}<001> recrystallized grains.5) This situation should be taken into consideration in view of the non-uniform deformation structure observed in the present study in the {100}<011> oriented grains.
Conventionally, an extremely high cold-rolling reduction rate leads to the formation of {100}<012> recrystallization texture. However, there have been few reports on the origin of the recrystallization texture,6) and it still remains to be clarified.
Previously, we studied the deformation structure and the recrystallization behavior of the severely cold-rolled pure iron with 99.8% reduction. The strong α-fiber texture evolved and the region with α-fiber texture turned out to unexpectedly highly strained.6) It was also clarified that these α-fiber textures started to recover from an extremely low temperature, maintaining {100}<011> to {211}<011> α-fiber texture components even after the completion of recrystallization. Consequently, a phenomenon similar to continuous recrystallization seems to occur, although the nucleation and growth-type recrystallization was confirmed by the optical microscopy and EBSD (Electron Back Scattering Diffraction). Furthermore, it was revealed that orientation selective growth occurred during the grain growth stage after the completion of recrystallization, resulting in the development of the sharp {100}<012> texture. However, the effects of added elements such as Si and Al on recrystallization textures of severely cold-rolled pure iron have not yet been clarified. Therefore, this study clarifies the effects of the addition of Si and Al on the development of recrystallization textures and their formation mechanism.
Using a vacuum melting furnace, either 0.3mass%Si or 0.3mass%Al was added to pure iron. Table 1 shows the chemical compositions of these alloys. In order to prepare ingot shapes suitable for rolling, the ingots were kept in Ar gas atmosphere at 1200°C for two hours and then forged to a shape of 250 mm in height, 250 mm in width, and 300 mm in length. The forged materials were kept again in Ar gas atmosphere at 1200°C for two hours and then hot-rolled in 15 passes from a thickness of 250 mm to 50 mm. The finishing temperatures were 1004°C for the Fe-0.3mass%Si alloy and 1021°C for the Fe-0.3mass%Al alloy, both of which were within the austenite region. They were air-cooled to room temperature. The average grain size of the hot-rolled sheets was approximately 880 μm for both Fe-0.3mass%Si alloy and Fe-0.3mass%Al alloy. The specimens with 50 mm in thickness were cut out from these hot-rolled sheets for cold rolling. The cut specimens were cold-rolled to a thickness of 0.1 mm by 99.8% reduction.
| C | Si | Mn | P | S | Al | O | N | |
|---|---|---|---|---|---|---|---|---|
| 0.3%Si-Fe | <0.001 | 0.3 | <0.002 | <0.002 | <0.0003 | <0.002 | 0.0052 | 0.0005 |
| 0.3%Al-Fe | <0.001 | 0.007 | <0.002 | <0.002 | <0.0003 | 0.29 | 0.0025 | 0.0005 |
The cold-rolled sheets thus prepared were annealed at various temperatures between 100°C and 800°C in a vacuum atmosphere (up to 10−2 Pa) with heating rate of 10°C/min. Immediately after heating to desired temperature, the specimens were rapidly cooled with Ar gas spray in the furnace. The microstructures and textures of cold-rolled and annealed specimens were observed from the TD (transverse direction) using an optical microscopy and SEM (scanning electron microscope) -EBSD. Specimens etched with Nital were subjected to the observation by optical microscopy. SEM-EBSD observation was conducted using FE-SEM (Carl Zeiss) and OIM (TSL). Five areas were observed with a step size of 0.1 μm in a region with an entire thickness of 100 μm × rolling direction length of 600 μm for each specimen. The operated accelerating voltage was 20 kV. The observed surface of the specimens for SEM-EBSD was polished for mirror finishing using colloidal silica. In order to observe dislocation structures, a 200 kV FE-TEM (field-emission transmission electron microscope) HF-2000 (Hitachi, Ltd.) was used. TEM specimens were prepared to observe microstructure from TD as follows: first, specimens as thin as approximately 70 μm were cut out parallel to the rolling direction. When cutting out specimens, the specimen holder of the ion milling equipment was cooled with liquid nitrogen to prevent a temperature rise during processing. These thin specimens underwent twin-jet electropolishing to prepare the thin-foil specimens for TEM observation. The change in hardness due to the heat treatment was evaluated by the average hardness value out of 10 measuring points on each specimen using a micro-Vickers hardness tester (AKASHI) under the conditions of 10 g indenter load and 15 sec retention.
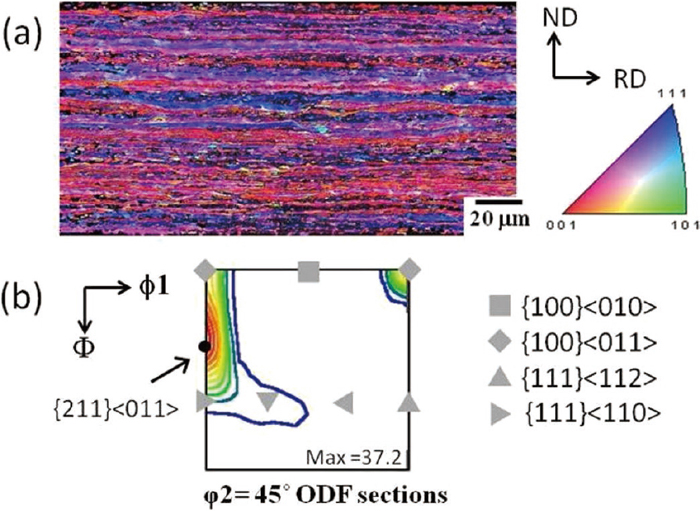
Figure 1(a) shows the deformation structure of the severely cold-rolled Fe-0.3mass%Si alloy observed from the TD using SEM-EBSD. The color was marked according to the ND orientation. The deformation structure was in a fibrous form elongated to the rolling direction. The thickness of fiber structures with almost identical orientations was around 0.5 to 5 μm in the thickness direction. The ODF of cold-rolled material is shown in Fig. 1(b). It is obvious that the strong α-fiber texture (RD//<011>), in particular with the maximum intensity at {411}<011>, developed in Fe-0.3mass%Si alloy.

(a) EBSD ND-orientation map observed from TD and (b) φ2=45° ODF section showing the cold-rolling texture of 99.8% cold-rolled Fe-0.3%Si alloy.
Figure 2(a) shows the deformation structure of the severely cold-rolled Fe-0.3mass%Al alloy observed from the TD using SEM-EBSD. The color was marked according to the ND orientation. The deformation structure was in a fibrous form elongated to the rolling direction, as with the case of Fe-0.3mass%Si alloy. The thickness of fiber structures with almost identical orientations was around 0.2 to 1 μm in the thickness direction. While the recrystallized grain size of the hot-rolled sheets was almost the same in the Fe-0.3mass%Si alloy and Fe-0.3mass%Al alloy, the latter has a tendency to exhibit finer fiber structures that are alternately arranged according to the crystal orientation. The ODF of the cold-rolled Fe-0.3mass%Al alloy in Fig. 2(b) exhibits the development of the strong α-fiber texture, with the maximum intensity at {211}<011>.
(a) EBSD ND-orientation map observed from TD and (b) φ2=45° ODF section showing the cold-rolling texture of 99.8% cold-rolled Fe-0.3%Al alloy.
Figure 3 shows the change in Vickers hardness with the heat treatment. For a purpose of comparison, a change in the hardness of pure iron severely cold-rolled at 99.8% reduction6) was also plotted in Fig. 3. Rs stands for the recrystallization starting temperature which was determined by SEM observation. The Vickers hardness of Fe-0.3mass%Si alloy just after 99.8% cold-rolling was around 310 HV, and harder than that of pure iron and Fe-0.3mass%Al alloy. The Vickers hardness of Fe-0.3mass%Si alloy hardly decreased during heat treatment between 100 and 400°C, but it significantly lowered once the temperature exceeded 450°C, which is about the starting temperature of recrystallization. On the other hand, in Fe-0.3mass%Al alloy, the Vickers hardness of 99.8% cold-rolled material before the heat treatment was around 270 HV, which was lower than that of the Fe-0.3mass%Si alloy and not more than that of pure iron.6) The Vickers hardness of the Fe-0.3mass%Al alloy started decreasing at the heating temperature as low as 250°C. Between 300 and 400°C, the hardness scarcely decreased. Over 450°C at which recrystallization starts, the hardness significantly decreased again. As shown in Fig. 3, this tendency was very similar to that of 99.8% cold-rolled pure iron.

Change in Vickers hardness as a function of annealing temperature for cold-rolled Fe-0.3%Si alloy, Fe-0.3%Al alloy and pure iron6) with reduction 99.8%.
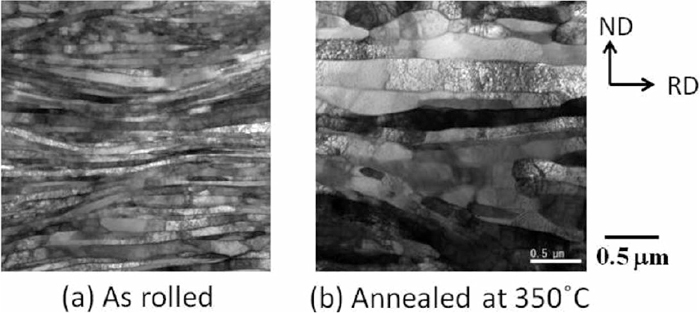
The dislocation structures in the thickness center of specimens of both cold-rolled samples and samples heated to 350°C were investigated by TEM. 350°C corresponds to the temperature where recovery takes place. This is because Fe-0.3mass%Al alloy exhibits the peculiar behavior in the change of the Vickers hardness with heating temperature in the sense that the hardness starts decreasing at 250°C and show a plateau at temperatures between 300 and 400°C. Moreover, the initial Vickers hardness of Fe-0.3mass%Al alloy as cold-rolled stage is lower than that of Fe-0.3mass%Si alloy. Figures 4 and 5 shows the dislocation structures of Fe-0.3mass%Si alloy and Fe-0.3mas%Al alloy, respectively. As shown in Fig. 4 (a), the dislocation structure of the cold-rolled Fe-0.3mass%Si alloy is composed of the thin sharp lath-like dislocation cells elongated to the rolling direction. A number of dislocations were observed inside a lath. The thickness of laths was no more than 100 to 250 nm. Observed in the lath structure were a number of large swells and shear bands that cross the lath boundaries. Figure 4(b) shows a dislocation structure, the specimen heated to 350°C, which was composed of recovered lath-like cell structures, still elongated to rolling direction. The lath thickness was around 150 to 350 nm, which was approximately 1.5 times thicker than that of the laths seen in the cold-rolled material. In addition, it was confirmed that the subgrain formation and growth were underway. Many subgrains were observed particularly near swells or shear bands, but inside subgrains a number of dislocations were observed.

TEM photographs of (a) cold-rolled and (b) annealed at 350°C Fe-0.3%Si alloy observed from TD.
TEM photographs of (a) cold-rolled and (b) annealed at 350°C Fe-0.3%Al alloy observed from TD.
The TEM micrographs of Fe-0.3mass%Al alloy are shown in Fig. 5. In the cold-rolled material (Fig. 5(a)), a dislocation structure that is composed of very thin sharp laths-like dislocation cells elongated to the rolling direction was confirmed. A number of dislocations were observed inside each lath, as with the case of the Fe-0.3mass%Si alloy. The thickness of the laths was around 60 to 150 nm, thinner than that of Fe-0.3mass%Si alloy. The lath structure had large swells and shear bands crossing over the lath boundaries. Observed near swells were structures that seem to consist of partially recovered cells. After heating at 350°C, a significantly recovered lath structure was confirmed. It was elongated to the rolling direction, but a number of equiaxial subgrains were also observed as shown in Fig. 5(b). The thickness of the laths was around 150 to 400 nm, which was approximately 2.5 times the thickness of those found in the cold-rolled material. Futhermore, it is worthwhile to mention that the laths in Fe-0.3mass%Al alloy were thicker than those in the Fe-0.3mass%Si alloy after heating to 350°C, which implies that the subgrain formation noticeably progressed in Fe-0.3mass%Al alloy compared to Fe-0.3mass%Si alloy. Particularly near the swells and shear bands, many equiaxial subgrains were observed.
We observed the progress of change in the microstructure with the heat treatment using EBSD. Figure 6 shows the microstructure evolution as a function of heating temperatures between 480°C and 800°C, as well as {001} pole figure of the recrystallized grains in Fe-0.3mass%Si alloy. The texture when heated to 480°C is shown in Fig. 6(a). The fraction recrystallized was around 0.1. The orientations of approximately 80 recrystallized grains observed were plotted in the {001} pole figure. They were near {411}<148> and {411}<011> orientations. The structure when heated at 490°C is shown in Fig. 6(b). The fraction recrystallized was approximately 0.8. Recrystallization rapidly progressed during heat treatment between 480°C and 490°C. The orientations of recrystallized grains were distributed from {111}<011> to {111}<112> and from {100}<012> to {311}<136>. The structure when heated at 550°C is shown in Fig. 6(c). Equiaxed recrystallized grains can be seen in the entire observation area, where recrystallization has completed. The orientations of the recrystallized grains observed at 550°C showed little change from Fig. 6(b) and were distributed from {111}<011> to {111}<112> and from {100}<012> to {311}<136>. In particularly, the orientations from {100}<012> to {311}<136> seemed to be intensified. At 700°C, the growth of recrystallized grains advanced, and coarse recrystallized grains over 100 μm were seen here and there (Fig. 6(d)). Regarding the orientations of recrystallized grains, {111}<011> and {111}<112> orientations observed in Fig. 6(c) were no longer observed and the orientation from {100}<012> to {311}<136> have been significantly intensified. The structure when heated to 800°C is shown in Fig. 6(e). The growth of recrystallized grains further advanced, and many of which exceeded 50 μm in size. The orientations of recrystallized grains were further strengthened in the orientations from {100}<012> to {411}<148>.
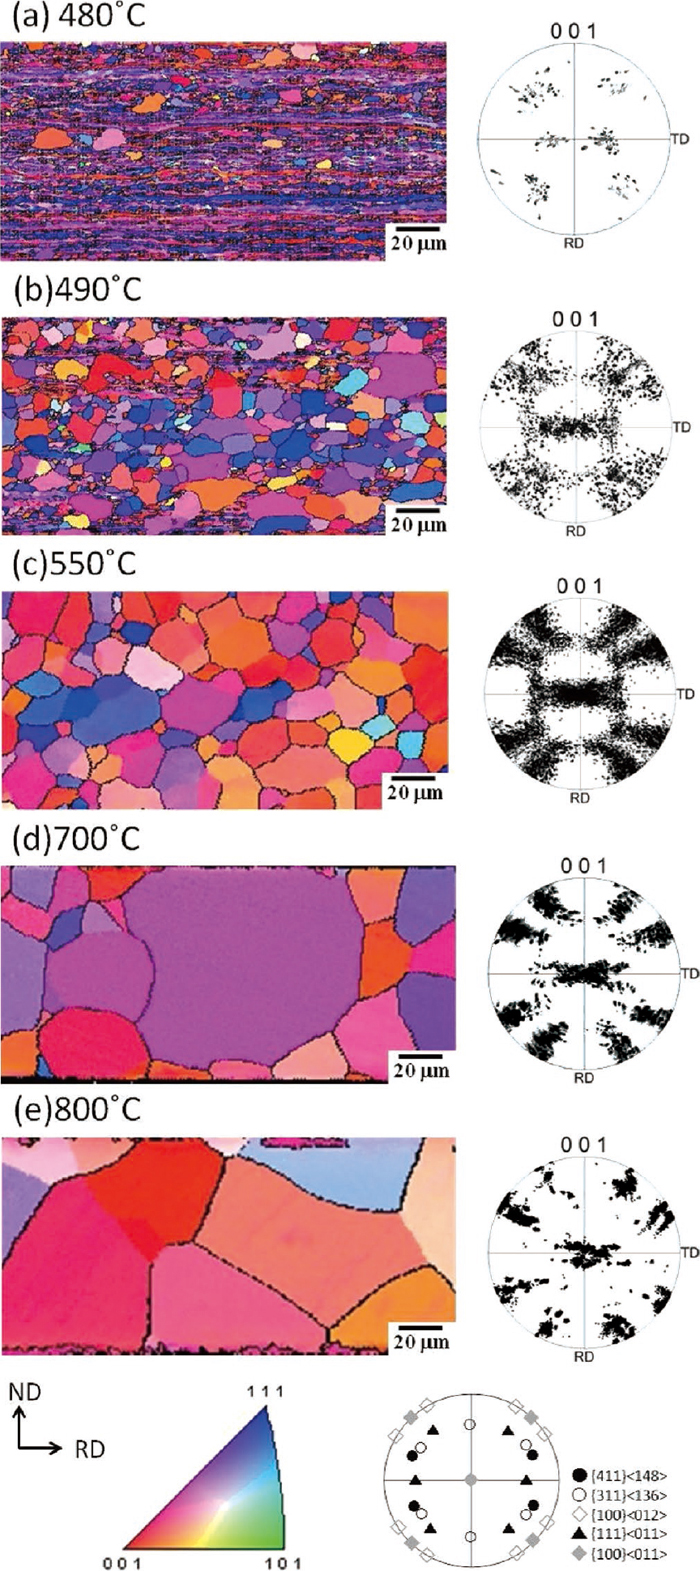
Change in EBSD ND-orientation maps observed from TD as a function of annealing temperature for 99.8% cold-rolled Fe-0.3%Si alloy.
Figure 7 shows the microstructure evolution as a function of heating temperature between 460°C and 800°C, as well as {001} pole figure of the recrystallized grains in Fe-0.3mass%Al alloy. The structure when heated to 460°C is shown in Fig. 7(a). The fraction recrystallized was approximately 0.1. Many of the recrystallized grains were elongated to the rolling direction, when compared to Fe-0.3mass%Si alloy. Their orientations were distributed from {111}<011> to {111}<112> and from {100}<011> to {211}<011>, showing relatively larger scatter of orientations than the case of Fe-0.3mass%Si alloy. Among these orientations, those from {100}<012> to {311}<136> were preferred. The texture when heated at 480°C is shown in Fig. 7(b). The fraction recrystallized was approximately 0.5. The orientations of recrystallized grains were distributed from {111}<011> to {111}<112> and from {100}<012> to {311}<136>. Many of the recrystallized grains were elongated to rolling direction similar to the case of the recrystallized grains heated to 460°C (Fig. 7(a)). The structure when heated to 550°C is shown in Fig. 7(c). While recrystallization completed, many recrystallized grains were confirmed to be still elongated to rolling direction. The orientations of recrystallized grains were distributed from {111}<011> to {111}<112> and from {100}<011> to {100}<012>, however wider distribution around ND//<100> axis were confirmed, when compared to Fe-0.3mass%Si alloy. The texture when heated to 700°C is shown in Fig. 7(d). Grain growth was slightly advanced during heating from 550°C to 700°C. The orientations of recrystallized grains did not substantially change. However, the intensity of {100}<011> orientation was weakened, while the slight strengthening of the orientation from {111}<011> to {111}<112> and from {100}<012> to {311}<136> was detected. When heated to 800°C (Fig. 7(e)), recrystallized grains grew so bulky that they can penetrate the sheet thickness. Regarding the orientation of recrystallized grains, the orientation from {111}<011> to {111}<112> disappeared and the orientation of {100}<012> was extremely intensified.

Change in EBSD ND-orientation maps observed from TD as a function of annealing temperature for 99.8% cold-rolled Fe-0.3%Al alloy.
Figures 8 and 9 show ODFs of the specimens of Fe-0.3mass%Si alloy and Fe-0.3mass%Al alloy, respectively, heated to 550°C and 700°C for examining the texture change with grain growth after the completion of recrystallization. When heated Fe-0.3mass%Si alloy to 550°C, which was immediately after the completion of recrystallization the orientations such as the intense {100}<012> to {311}<136>, together with the weak {111}<112> and {111}<123> were recognized (Fig. 8(a)). The maximum intensity was in {811}<1, 8, 16>. When heated to 700°C, which was after the significant grain growth, the texture strengthening occurred in {411}<148> orientation, but not in ND//<111> (Fig. 8(b)). Texture change with grain growth heated from 550°C to 700°C is revealed by the difference ODF (b)-(a) in Fig. 8. In Fe-0.3mass%Si alloy, it is very clear that the intensity of {411}<148> remarkably increased with grain growth, while the intensities of {100}<012> and near ND//<111> decreased.
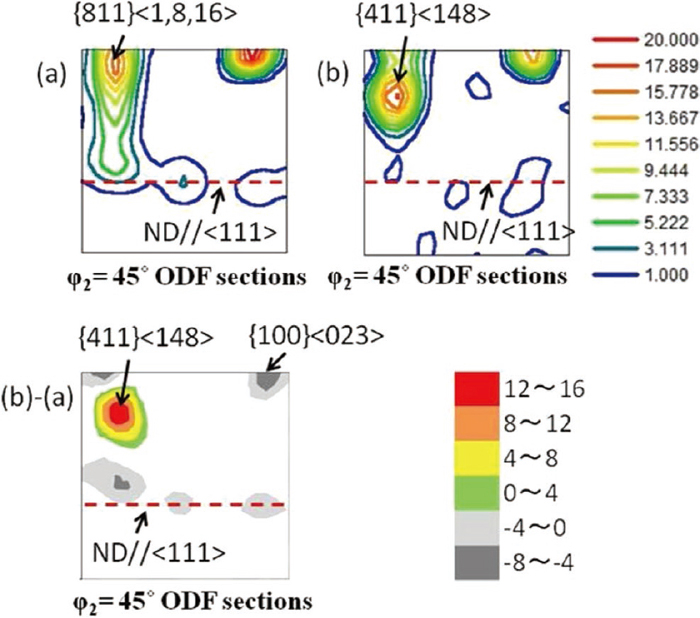
φ2=45° ODF sections of Fe-0.3%Si alloy showing textures followed by annealing (a) at 550°C, (b) at 700°C, and (b)-(a).
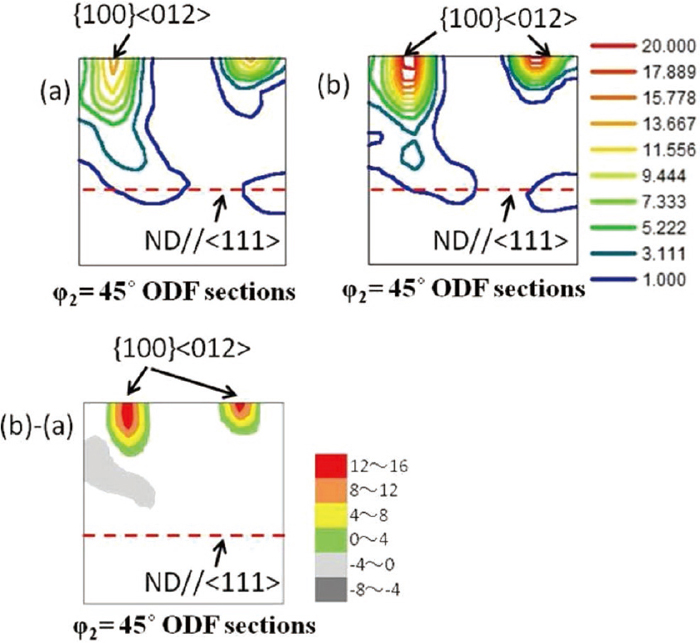
φ2=45° ODF sections of Fe-0.3%Al alloy showing textures followed by annealing (a) at 550°C, (b) at 700°C, and (b)-(a).
Figure 9 shows the change in texture with grain growth of Fe-0.3mass%Al alloy. When heated to 550°C, which was immediately after the completion of recrystallization, orientations such as the intense {100}<012> to {322}<236> orientations together with the weak {111}<112> orientation were recognized (Fig. 9(a)). At 700°C, which was after the growth of recrystallized grains, the {100}<012> component was intensified, while the {111}<112> intensity decreased. Texture change with grain growth heated from 550°C to 700°C is revealed by the difference ODF (b)-(a) in Fig. 9. It is very clear that the intensity of {100}<012> remarkably increased with grains growth in the Fe-0.3mass%Al alloy.
We examined the number of recrystallized grains that have {100}, {411}, {211}, and {111} orientations as a function of grain size for the specimens heated to 550°C where recrystallization completed. Figure 10 shows the number fraction of recrystallized grains with various orientations in Fe-0.3mass%Si alloy. The number of recrystallized grains examined was 1842. The average grain size was 11 μm. As far as the recrystallized grains smaller than the average grain size are concerned, recrystallized grains with {211} and {111} orientations exhibited a large proportion. On the other hand, those with {100} and {411} orientations occupied a large proportion of recrystallized grains that were larger than the average grain size. Many of the recrystallized grains larger than 25 μm in size had {100} orientation. However, no significant difference was obtained in the average grain size depending on the crystal orientation.
Number fraction of recrystallized grains with various orientations annealed at 550°C for Fe-0.3%Si alloy as a function of grain size.
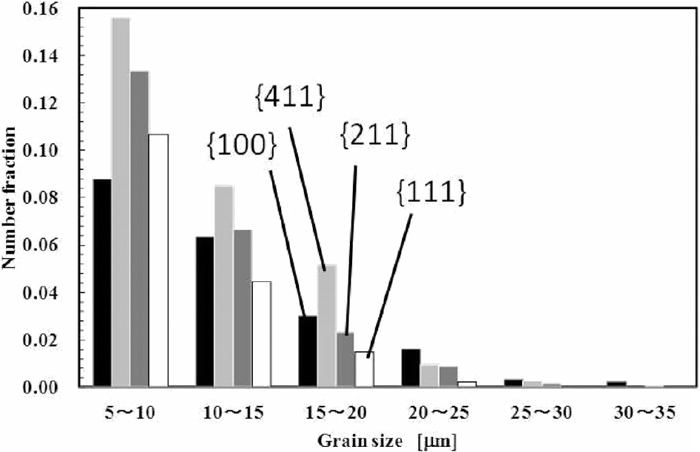
Figure 11 shows the result of Fe-0.3mass%Al alloy the number of recrystallized grains examined was 1650. The average grain size was 13 μm. Recrystallized grains that were smaller than the average seems to have more scattered orientations, when compared to Fe-0.3mass%Si alloy. On the other hand, the recrystallized grains that were larger than the average grain size tend to have {100} and {411} orientations. In particular recrystallized grains larger than 30 μm tended to have the {411} orientation. However, again in Fe-0.3mass%Al alloy, no significant difference was obtained in the average grain size depending on the crystal orientation.

Number fraction of recrystallized grains with various orientations annealed at 550°C for Fe-0.3%Al alloy as a function of grain size.
The deformed structure in the Fe-0.3mass%Si alloy was a fiber structure elongated to the rolling direction with a lath thickness of 100 to 250 nm as shown in Fig. 4(a). Suppose that the grain size of the material prior to cold-rolling was 880 μm, the distance between the grain boundary in the thickness direction is estimated to be approximately 2 μm after 99.8% cold-rolling. Thus, it is considered that the grains before cold-rolling changed into the fine laths-like cell structure during severe cold-rolling. Regarding severe cold-rolling texture, α-fiber texture from {100}<011> to {311}<011> intensely developed as shown in Fig. 1(b). Previous study of pure iron by the present authors,6) revealed that α-fiber texture with the maximum intensity in {411}<011> developed after sever cold-rolling. Accordingly, a difference in severe cold-rolling texture between Fe-0.3mass%Si alloy and pure iron was recognized. The Vickers hardness of severely cold-rolled Fe-0.3mass%Si alloy was around 310 HV, which is harder than those of pure iron and Fe-0.3mass%Al alloy, presumably due to the high work hardening behavior in the Fe-0.3mass%Si alloy. Barret et al.7) reported that 4-mass% Si–Fe alloy restricted slip systems to {011}<111>. Griffiths et al.8) reported that the solute Si in Fe decreased the stacking fault energy, resulting in the suppression of cross slip of dislocation. Although the amount of Si added in this study is small 0.3 mass%, it is postulated that the work hardening might be promoted due to the limitation of active slip system or the suppression of cross slip. Moreover, the reason for the difference in the severe cold-rolling texture between the Fe-0.3mass%Si alloy and pure iron is inferred to be related to the effect of the solute Si to limit slip system or suppress cross slip.
The Vickers hardness of the Fe-0.3mass%Si alloy did not change until heated up to 400°C, but suddenly decreased at 450°C. As shown in Fig. 3, this behavior differs from those observed in pure iron and the Fe-0.3mass%Al alloy. The reason will be discussed in 4.2 in detail. Furthermore, the thickness of lath-like elongated dislocation cell structure increased only 1.5 times after heating severely cold-rolled Fe-0.3mass%Si alloy at 350°C (Fig. 4), but 2.5 times in Fe-0.3mass%Al alloy (Fig. 5). This corresponds to the fact that the Vickers hardness in Fe-0.3mass%Si alloy hardly decreased until 400°C. Moreover, as shown in Fig. 6, recrystallization commenced at 480°C, which indicates that the Vickers hardness of Fe-0.3mass%Si alloy decreased with the progress of recrystallization without noticeable hardness change prior to recrystallization. As already discussed, the addition of Si can limit the active slip system7) or suppress the cross slip.8) Consequently, the rearrangement of dislocation is inferred to becomes harder in Fe-0.3mass%Si alloy, as compared to pure iron and Fe-0.3mass%Al alloy. This speculation is in good agreement with the fact that the Vickers hardness considerably decreased prior to the commencement of recrystallization in pure iron and Fe-0.3mass%Al alloy. When cross slip is suppressed by Si addition,8) the ratio of edge dislocations is expected to relatively increase. During the recovery, the climb up motion of an edge dislocation is considered to be one of the dominant processes.9) In this study, however, the recovery in the Fe-0.3mass%Si alloy was slower than that in pure iron and the Fe-0.3mass%Al alloy. This indicatesother roles of the Si addition on recovery. For instance, dislocation glide, which is another process of recovery, becomes difficult due to the strong interaction between dislocations and Si. Taking into account the fact that recrystallization tends to suddenly occurs in Fe-3mass%Si alloy (Figs. 3, 6), the suppression of recovery by the addition of Si plays an important role. Furthermore, the swells and the shear bands in the severely cold-rolled deformation structure (Figs. 4(a) and 5(a)) are considered to make the α-fiber structure heterogeneous and to play a role of promoting its recrystallization. The addition of Si presumably tends to introduce the heterogeneity in the α-fiber textured regions due to the promotion of work hardening. The transition band described by Walter et al.5) may also have played a role as a nucleation site of recrystallization.
In the Fe-0.3mass%Si alloy, as shown in Fig. 6(a), the orientations of recrystallized grains nucleated in the early stage of recrystallization are preferentially {411}<011> and {411}<148>, supporting the oriented nucleation theory. This is in contrast with the previously reported result of pure iron, in which recrystallized grains had similar orientations as the cold-rolling texture.6) As recrystallization progressed, recrystallized grains with orientations from {100}<012> to {311}<136> and from {111}<011> to {111}<112> were observed as shown in Fig. 6(b). At 550°C where recrystallization completed, the orientations of recrystallized grains were distributed from {100}<012> to {311}<136> and from {111}<011> to {111}<112> as shown in Fig. 6(c), showing no substantial change in texture. This result indicates that the orientation growth theory reported by Verbeken et al.,1) is not dominant in severely cold-rolled Fe-0.3mass%Si alloy. This is because the following finding by Verbeken et al.1) is not operating in the present case that the recrystallized grains with {311}<147> orientation preferentially grow by consuming unrecrystallized a-fiber grains with {211}<011> orientation. Furthermore, with the progress of grain growth from 550°C to 700°C, the orientations from {100}<012> to {311}<136>, centering in {411}<148>, were significantly intensified, while the orientations from {111}<011> to {111}<112> was no longer observed (Fig. 6(d)). It is implied that the selective growth in terms of grain orientation occurred during the grain growth process from 550°C to 700°C. The difference ODF (b)-(a) in Fig. 8 clearly demonstrates the strengthening of {411}<148> during grain growth, which supports the idea that the {411}<148> orientation grew in a selective manner, encroaching on recrystallized grains with other orientations such as {100}<023> and near ND//<111>.
4.2. Recrystallization Behavior of the Fe-0.3mass%Al AlloyThe deformation structure of the Fe-0.3mass%Al alloy had a fibrous structure elongated to rolling direction, consisting of the lath-like cell structure. The thickness of laths was 60 to 150 nm as shown in Fig. 2(a). As shown in Fig. 2(b), the cold-rolling texture is a very strong α-fiber texture with the maximum intensity in {211}<011>. Meanwhile in Fe-0.3mass%Si alloy, the maximum intensity was {411}<011> along α-fiber texture from {100}<011> to {311}<011>. This difference is speculated to stem from the different effects of Si and Al on slip systems. The 99.8% cold-rolling texture of pure iron in the previous report6) was α-fiber texture that was centered in {411}<011> and that did not spread to {100}<011>. This result suggests that the cold-rolling texture of the Fe-0.3mass%Al alloy resemble that of pure iron. Moreover the Vickers hardness of the cold-rolled Fe-0.3mass%Al alloy was about the same as that of pure iron as shown in Fig. 3. During heating the cold-rolled Fe-0.3mass%Al alloy, the Vickers hardness started to decrease at a heating temperature as low as 200°C, then showed a gradual change between 300°C and 400°C. The Vickers hardness started decreasing again when a heating temperature exceeded 450°C. This tendency differed from that of Fe-0.3mass%Si alloy, and was very similar to that of pure iron. When compared to the Fe-0.3mass%Si alloy shown in Fig. 4(a), the arrangement of dislocations in the lathlike cell structure in the Fe-0.3mass%Al alloy shown in Fig. 5(a) seems to be dynamically progressed in the state just after severe cold-rolling. This suggests that dynamic recovery has occurred during severe cold rolling in Fe-0.3mass%Al alloy. Furthermore, as shown in Fig. 5(b), the thickness of the lath structure after heated to 350°C was about 2.5 times thicker than that of cold-rolled material shown in Figs. 5(a) and 5(b). Therefore, the addition of Al is considered less effective in suppressing dislocation glide and cross slip. In this sense, the situation in Fe-0.3maa%Al alloy resembles that in pure iron, not in Fe-0.3mass%Si alloy. This is in agreement with the Vickers hardness change with heating temperature (Fig. 3) in the sense that the hardness of the Fe-0.3mass%Al alloy started decreasing at a lower temperature. Consequently, the formation of coarse and equiaxed subgrains are inferred to easily take place in Fe-0.3mass%Al alloy.
In the process of heating a cold-rolled material, point defects disappear first, followed by annihilation or rearrangement of dislocations. While dislocations on the same slip plane are concerned, they can annihilate by gliding on the same slip plane, however, those on different slip planes cannot be annihilated unless cross slip of a screw dislocation or climb motion of an edge dislocation occurs.10) While vacancies are required for dislocations to climb, it is necessary to take into account the interaction between a vacancy and solute atom, as a factor affecting dislocation climb motion. Since Si in steel has stronger solid-solution strengthening ability even at elevated temperature than Al,11) it is speculated that Si has a stronger interaction with dislocations as well as vacancies than Al. In addition, Si in steel is known to suppress cross slip.8) Therefore, it is considered that Al scarcely suppressesrecovery and exhibits the similar behavior to pure iron during heat treatment.
As shown in Fig. 7(a), in Fe-0.3mass%Al alloy, the orientations of recrystallized grains nucleated in the early stage of recrystallization were widely distributed from {100}<011> to {100}<012>, {411}<148>, and from {111}<011> to {111}<112>, which differed from the distribution in the Fe-0.3mass%Si alloy as shown in Fig. 6(a). The orientations nucleated in the early stage of recrystallization were relatively scattered. However, when the fraction recrystallized increased from 0.1 to 0.5, the texture strengthening seemed to take place in the orientations from {100}<012> to {311}<136> and from {111}<011> to {111}<112> as shown in Fig. 7(b). Further, as shown in Fig. 7(c), no significant change in recrystallization texture occurred with the further progress of recrystallization, but an increase in the number of recrystallized grains distributed from {100}<012> to {311}<136> and from {111}<011> to {111}<112> was recognized. The continuous recrystallization-like behavior observed in severely cold-rolled pure iron seemed to be suppressed in Fe-0.3mass%Al alloy. During grain growth between 550°C and 700°C, {100}<012> markedly increased and the orientation from {111}<011> to {111}<112> disappeared as vividly shown in difference ODF (b)-(a) in Fig. 9. This result suggests that in Fe-0.3mass%Al alloy, the selective grain growth in terms of grain orientations occurred in the process of grain growth, resulting in the sharp {100}<012> texture. This textural change with grain growth was very similar to the case of severely cold-rolled pure iron.6)
4.3. Textural Change during Grain Growth of Recrystallized GrainsIn the Fe-0.3mass%Si alloy, the recrystallized grains with {411}<148> selectively grew as a result of normal grain growth, while in the Fe-0.3mass%Al alloy, the recrystallized grains with {100}<012> grew. Hillert et al.12) expressed the growth velocity of grain with radius R using Eq. (1) as follows,
| (1) |
Investigation of the recrystallization behavior and texture development in 99.8% cold-rolled Fe-0.3mass%Si alloy and Fe-0.3mass%Al alloy was conducted and the following results were obtained:
(1) In Fe-0.3mass%Si alloy, both recovery and recrystallization were suppressed, by the solute Si. In the early stage of recrystallization, the recrystallized grains had the preferential orientations {411}<148> to {411}<011>, supporting the importance of the orientated nucleation mechanism. During normal grain growth the recrystallized grains with {411}<148> selectively grew.
(2) In Fe-0.3mass%Al alloy, the heating up to 350°C, promotes the formation of coarse and equiaxed subgrains from the elongated fine lath-like cell structure. This behavior, which was also recognized in severely cold-rolled pure iron, is speculated to stem from the fact that the rearrangement of dislocations occurs easily in Al-added alloy compared to Si-added alloy. Recrystallized grains nucleated have less tendency for oriented nucleation. However, as recrystallization progressed, the orientations of {100}<012> and from {111}<011> to {111}<112> become major. During the normal grain growth, the clear selective growth of {100}<012> recrystallized grains was confirmed.
(3) The selective growth of {411}<148> and {100}<012> in the Fe-0.3mass%Si and Fe-0.3mass%Al alloys were not necessarily explained by the size advantage effect during normal grain growth. Therefore, a rigorous model of grain growth is required in future considering the grain boundary energy and the grain boundary mobility as a function of grain boundary characteristics.