Abstract
The bubbling in liquid steel can improve steel cleanliness effectively. To understand the single bubble behavior and the interactions between two bubbles, which are basis to analyze the mechanism of gas-liquid two-phase flow in metallurgical vessel, the bubbling at a laminar flow has been systematically studied by both water-model experiment and three-dimensional numerical simulation. Nozzle diameters of 1.5, 2, and 2.5 mm were investigated within a certain range of gas flow rate. The images of bubbles emerging from the nozzle were observed by the water-model experiment. The volume of fluid (VOF) model in conjunction with continuum surface force (CSF) model was used to describe the interface between the gas and liquid on the software platform of Fluent 14.5. The phenomena of bubbling, rising motion, coaxial bubbles coalescence and parallel bubbles bounce with one- and two-nozzle were found in air-water and argon-steel system. The initial bubble sizes increase with increasing gas flow rate or nozzle size, whereas is relatively independent of the nozzle size when gas flow rate is 0.975 L/min. The terminal velocities of all bubbles are around 0.32 m/s. The evolution history of bubble shape changes from non-deformed (spherical) to the deformed shapes (spherical cap, ellipsoidal, wobbly or ellipsoidal cap) without coalescence. Calculated velocity and pressure distributions indicated that the rising velocity of the trailing bubble is larger than that of the leading bubble, which result in two coaxial bubbles coalescence. The small eddies on the inner edge of two parallel bubbles eventually lead to bubbles bounced each other.
1. Introduction
Gas injection is widely applied in secondary metallurgical processes and continuous casting.1,2,3) Bubbles injected into the liquid steel to homogenize the chemical composition and temperature distribution as well as remove non–metallic inclusions from liquid steel. The efficiency of inclusions removal by bubble flotation depends considerably on various factors such as bubble size, shape, rising trajectory, bubbles interaction or breakup and so on. Hence, the prediction of bubble formation, rising motion and the interactions between bubbles provides the theoretic guidance for the efficiency of inclusion removal.
Oryall et al.4) reported the jet behavior into a mercury converter-shaped vessel and measured the distribution of gas volume fraction and bubble frequency. Andreini et al.5) achieved the bubble formation frequencies and bubble rising velocities in tin, lead, or copper melts through utilizing noises generated by bubbles. Using X-ray cinematography, the individual bubble rising through a low-temperature metallic alloy was measured by Davis et al.6) An experimental approach utilizing an acoustic device to measure bubble size formed at nozzles in liquid pig iron was studied by Irons et al.7) Mori et al.8) observed the behavior of nitrogen injecting into a mercury bath under different orifices diameter at the transparent bottom plate by using a high-speed cinecamera. Iguchi et al.9) acquired the formation and rising behavior of bubbles at a nozzle in a molten iron bath at 1523 K using a high-voltage X-ray fluoroscope and a high-speed video camera. Iguchi et al.10) developed a two-needle, electroresistivity probe to measure bubble characteristics and bubble rising velocity in a molten iron bath at 1873 K. Llanos et al.11) used a VOF model to simulate the optimization of the ladle stirring operation with the bottom argon bubbling. Liu et al.12) used a Lagrangian method to track the bubble behavior in the argon-stirred ladles with off-centered bottom argon injection. Xu et al.13) discussed the effect of the wettability on the bubble formation by water model experiments and three-dimensional numerical simulations.
The bubbles interaction can significantly change flow structure characteristic and the interfaces of gas-liquid, in which profoundly influence the characteristics in the whole system. However, few work on the interactions of bubbles are studied in liquid steel. Crabtree et al.14) studied coalescence of the coaxial bubbles and velocity of the trailing bubble over a wide range of volumes in a viscous liquid. Katz et al.15) experimentally studied the motion of nearly spherical air bubbles rising in a column in stagnant water. Chen et al.16) simulated the motion of interacting bubbles in a viscous liquid by a modified VOF method incorporating surface tension stresses. Sanada et al.17) carried out both experimental and numerical study on the effects of liquid viscosity on the coalescence of a bubble impacting with a free surface. Van Sint Annaland et al.18) simulated the co-axial and oblique coalescence of two gas bubbles by using a VOF method under a large density and viscosity ratio and a large value of the surface tension coefficient. Hasan et al.19) studied two coaxial bubbles rising in a cylinder by a VOF method. Sanada et al.20) investigated the interactions of a pair of ellipsoid bubbles rising side by side and the wakes of bubbles in a quiescent silicone oil and water using a high-speed video camera and a photochromic dye. Fan et al.21) simulated the interaction of two bubbles rising side by side in shear-thinning fluid using VOF method coupled with CSF method. Yang et al.22) summarized in a review presented recently on the process of bubble formation and bubble rising in gas-liquid-solid systems.
In the present work, the behavior of a single bubble and the interaction of coaxial and parallel bubbles were investigated by using physical modeling and mathematical simulation methods. First a gas bubbling water model was established and images of bubble formation and rising motion were investigated. Subsequently we applied a three dimensional mathematical model to simulate the bath with gas injection and the simulations were validated with the water modeling results. Finally the validated mathematical model was applied to investigate the bubble formation, rise motion and the interactions between bubbles with one-and two-nozzle in argon-steel systems.
2. Research Method
2.1. Experimental Apparatus and Procedure
Figure 1 shows a schematic diagram of gas bubbling water model experimental apparatus. A cylinder vessel made of plexiglass having an inner diameter of 120 mm and a height of 80 mm is built to investigate experimentally the bubbling behavior including the bubble formation, growth, detachment and rising motion. The vessel is wrapped in a square container which is made of the same material to eliminate the impact of light refraction on the visual measurements. A bolt with a outer diameter of 30 mm is matched different nozzles at the center of the vessel bottom in the single nozzle bubbling. The images of bubbles formation and movement were captured when bubble detached from the nozzle. A metal halide lamp was used to provide a strong illumination because the camera requires a very long exposure time. In porous bubbling, each nozzle diameter is 2 mm. The initial distance between nozzles was 4 mm and increased step by a value of 2 mm with gas flow rate of 0.085 L/min until no influence between two parallel bubbles. The nozzle is made of stainless steel and the contact angle, θ, is approximate 80 ± 2 deg in air-water systems with good wettability.23) The nuzzle diameter of 1.5, 2.0 and 2.5 mm were chosen for the water model experiment.

During the experiment, water in the vessel was filled to a height of 80 mm. Air was injected vertically upward into the vessel through a 70-mm-long bottom nozzle. The first bubble in the experiments is a relative concept, and it is the first bubble in a bubble formation period.
2.2. Mathematical Model and Simulation Methods
2.2.1. Assumptions
In the mathematical model, several assumptions have been specified to the system as following:
(1) Liquid steel and argon are treated as incompressible Newtonian fluids, and the flow in the ladle is laminar. The physical properties of the liquid steel such as density, viscosity, and surface tension coefficient are constant value. They are showing in Table 1.
Table 1. Properties of the materials used in the current simulation.
| Property | Symbol | Unit | Air-water system (at 298 K) | Argon-steel system (at 1873 K) | Ref.(Air-water ) | Ref.
(argon-steel) |
|---|
| Gas density | ρg | kg/m3 | 1.225 | 1.784 | 24 | 25 |
| Liquid density | ρl | kg/m3 | 998.2 | 7000 | 24 | 26 |
| Gas viscosity | μg | kg/(m s) | 1.789×10⁻⁵ | 2.25×10⁻⁵ | 24 | 25 |
| Liquid viscosity | μl | kg/(m s) | 0.001 | 0.007 | 24 | 26 |
| Surface tension coefficient | σ | N/m | 0.0728 | 1.4 | 24 | 25 |
(2) The influence of slag layer on fluid flow is neglected. Slag-liquid steel surface is treated as free surface.
(3) Chemical reactions is neglected for simplicity.
(4) The temperature is constant and neglect the influence on bubble.
2.2.2. Governing Equations
For the 3-dimensional unsteady state simulation of the bubble behavior in the liquid steel under laminar conditions, the following developed governing equations were involved: continuity equation and momentum equation for incompressible Newtonian fluids, volume fraction equation to track the interface between the gas and liquid, additional scalar equation to calculate the density and the viscosity of a mixed fluid, and the continuum surface force model to calculate the surface tension force.
Continuity equation is given by
Momentum equation is given by
|
∂
∂t
(
ρu
)
+∇(
ρuu
)
=-∇p+∇[
μ(
∇u+∇
u
T
)
]+ρg+
F
S
| (2) |
The VOF model given by Hirt and Nichols27) is based on different phases are not interpenetrating, and the method of tracing inter-phase boundary is achieved by solving volume fraction continuity equation of one phase or several phases. As for the gas phase, the volume fraction equation is given by
The liquid-phase volume fraction is given by
Additional scalar equation given by Valencia et al.28) to calculate density and viscosity of mixed fluid in the each cell as follows
|
ρ=
α
g
ρ
g
+(
1-
α
g
)
ρ
l
| (5) |
|
μ=
α
g
μ
g
+(
1-
α
g
)
μ
l
| (6) |
The continuum surface force (CSF) model given by Brackbill et al.29) to deal with the surface tension force term in Eq. (2). The surface tension force at the bubble-liquid interface regarded as the volume force according to the divergence theorem. The volume force is given by
|
F
s
=σ
ρκ∇
α
l
1
2
(
ρ
g
+
ρ
l
)
| (7) |
where
κ=∇⋅
n
ˆ
,
n
ˆ
=
n
| n |
,
n=∇
α
g
.
2.2.3. Boundary Conditions and Numerical Scheme
Figure 2 shows the geometry configuration of simulated vessel is a cylinder and has the same dimensions as the experimental apparatus. The outflow was a pressure outlet condition and the inflow was given a constant gas flow rate. The wall was defined as no-slip wall. The contact angle of the liquid wetting the wall was a constant value of 80 deg. A fully structured mesh was generated using GAMBIT software, and examined few times until it was found that the solution is less dependent on mesh. The meshes were refined in the central region of the vessel where the bubble was present in order to reduce the computational time. Figure 3 shows a detailed view of the mesh of gas nozzle distributed in the bottom plane. The model equations were separated and solved using the pressure based method. The detail computational parameters are shown in Table 2.

Table 2. Computational parameters for bubbling model.
| Computational parameter | Settings |
|---|
| Mesh type | Hexahedral |
| Solver | Unsteady |
| Discretization | Pressure (body force weighted), momentum (second order upwind), volume fraction (QUICK) |
| Pressure–velocity coupling | The pressure-implicit with splitting of operators (PISO) |
| VOF parameters | Geometric reconstruction |
| Convergence criteria | 1 × 10⁻⁵ |
| Time step | Minimum: 0.0001 s |
The set of governing equations were discretized using the finite volume method and executed on the software platform of FLUENT 14.5. The post-processing of simulated data and results were processed by using the visual post-processing software system of TECPLOT 360.
3. Results of Experimental and Numerical Simulation
First, the accuracy of the numerical simulation has been validated by comparing the results of an experiment with one- and two-nozzle in air-water system. Next, we discussed bubble behavior in argon-steel system. The calculation had been carried out under the conditions of different gas flow rates and nozzle sizes, and the bubble terminal velocity, corresponding profiles of velocity and pressure to profoundly evaluate their effects on bubble formation and the interactions between two bubbles.
3.1. Numerical Simulation Verification
The bubble successive generation from a nozzle when air was introduced in the vessel at a constant flow rate. The validations between simulation and experimental results of the single bubble behavior in the air-water system were carried out within the bubbling regime, because the simulation model was restricted to only solving a laminar flow. Comparisons of bubble formation and rising motion from single nozzle with gas flow rate of 0.025 L/min is shown in Fig. 4. It can be found from that the bubbles topologies from numerical simulation generally agreed well with experimental results when considering the complexity of a bubble generation and rising motion. There is also certain difference between experiment and simulation in bubble diameter, shape or motion path. One reason is that the gas flow rate is approximate constant in the experiment while it is strict in the simulation. Another reason is that the liquid flow fields in the experiment is disturbed by continuously passing leading bubbles, so the bubble detaches from the nozzle earlier and smaller bubble diameter were obtained.

The comparisons between simulations and experiments with two-nozzle bubbling processes are shown in Fig. 5. As illustrated in Fig. 5, we can see that the compare between simulation results and the experimental images are reasonable consistency during the entire process of bubble rising. Compared with the experiment, the pair of bubbles in the simulation tends to rotate to line up horizontally.
3.2. Bubble Behavior with One Nozzle Bubbling
The experimental images of bubble formation and rising motion with different nozzle size are shown in Fig. 6. The bubble is going to detach from the nozzle at the moment (t = 0) in the first row. The bubble is formed with a period of T in the bubbling regime. The second row represents the next bubble starts to be generated from the nozzle at the moment of T/2. The third row demonstrates the bubble formation completion at the moment of T.

The bubbling regimes was investigated by varying the air flow with 0.005 L/min and increased by 0.02 L/min, and until it fell into gas flow regimes. The upper limits of the bubbling regimes for 1.5, 2 and 2.5 mm nozzle are 0.245, 0.265 and 0.285 L/min, respectively. The bubble volume is calculated with
V
b
=
Q
f
when the bubble just detached from the nozzle.7) The frequency of the bubble formation, f, is the number of bubbles generated within 1 second. Comparisons between simulations and experiments of bubble diameter and bubble frequency as a function of gas flow rate with different nozzles are shown in Fig. 7. It can be found from Fig. 7 that the agreements between experiments and simulations are acceptable. However, the bubble frequency of numerical simulation is a little bit smaller than that of experiment, which means the bubble diameter of numerical simulation is bigger than that of experiment. It can clarify that unevenness of the gas flow rate in experiment is a main reason which makes a difference between experiment and numerical simulation, as mentioned above in Fig. 4.

Figure 8 shows the bubble rising motion in liquid steel with different nozzles at gas flow rate of 0.525 L/min. It shows that the bubbles are not invariably found to catch up with each other even though the leading bubble arrived at the top of liquid steel. The bubble shape changes include the initial spherical, spherical cap, ellipsoidal and ellipsoidal cap. We observed that the trajectory of 3D rising bubbles with the size of 7.82–10 mm is a spiral way with strong instabilities by changing their instantaneous shapes in the liquid steel, while 10–15 mm bubbles rise rectilinearly.

Figure 9 shows the bubble diameter and frequency as a function of gas flow rate in argon-steel system. The results show that the bubble diameters increase with increasing in gas flow rate and nozzle size, whereas the interaction of nozzle size is not significant when gas flow rate is 0.975 L/min. Nozzle size leads to a bigger bubble and a lower bubble frequency under the same gas flow rate. We observed a approximately constant bubble volume stage and a constant bubble frequency stage when the gas flow rate is 0.175 L/min and 0.675 L/min for the nozzle size of 1.5, 2 and 2.5 mm, respectively. Moreover, the bubbling regimes for different nozzles are shown in Table 3.
Table 3. The bubbling regimes for numerical simulation in the argon-steel system.
| Nozzle Diameter (mm) | 1.5 | 2 | 2.5 |
|---|
| Simulated Values (L/min) | 0.975 | 1.025 | 1.325 |
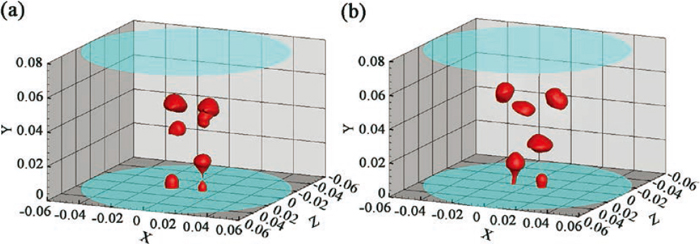
We observe that phenomena of two coaxial bubbles coalescence both experiment and numerical simulation in the air-water system and the images are shown in Fig. 10. It can be obtained that the reasonable agreements between experiments and simulations of two coaxial bubbles coalescence in the process of bubble rising motion. Figure 11 shows two coaxial bubbles coalescence occurred when the gas flow rate gets higher in the argon-steel system. In order to obtain detailed information on the bubble behavior, these figures are zoomed. In Fig. 11(a), the bubbles become slightly ellipsoids in shape and start approaching each other. In Fig. 11(b), the two bubbles touch with each other when the spacing between them is close, the leading bubble varies from initial ellipsoid to an umbrella, and the motion of the leading one induces a deformation in the trailing bubble, giving it a pear-like shape. In Fig. 11(c), the bubbles finally merge and coalesce into a big one. The trailing bubble is sucked into the leading bubble with the shape oscillations.

When two-nozzle is far from each other, the bubble behavior will be similar to one nozzle bubbling with the same nozzle size and gas flow rate. The interaction of bubbles rising side by side occurs while the distance between two nozzles is close. A pair of bubbles are simultaneously generated and released from two-nozzle with a diameter of 5.36 mm with gas flow rate is 0.085 L/min. The nozzle spacing begins with 4 mm and gradually increases 2 mm until no interaction tacks place between parallel rising bubbles. Then, the critical distance, Dcr, between two nozzles is obtained in the water mode experiment, and the critical distance is 16 mm. This is almost same as the study by Li et al.30) and illustrated in Fig. 12.

The critical distance in the argon-steel system is 34 mm when the gas flow rate is 0.575 L/min. In order to detect the two parallel bubbles rising interaction phenomenon, we reduced the distance to 18 and 20 mm. Figure 13 shows the simulation results of this two cases. In Fig. 13(a), the interaction of two parallel bubbles is observed obviously and the whole process for each nozzle bubbling as described above. The formation and the rising process of right bubble precedes the one of the left bubble. However, the bounce of two parallel bubbles still does not happen. On the contrary, the bubbles approach each other after they were generated and then bounce in Fig. 13(b).
The process of two parallel bubbles bounce in the air-water system are also found when two-nozzle close each other and the images are shown in Fig. 14. It can be said that the simulation results of two parallel bubbles bounce show reasonable consistency with the experimental images. Figure 15 shows two parallel bubbles bounce in the argon-steel system. The two parallel bubbles attract towards each other and the distance between the bubbles diminishes gradually in Fig. 15(a). The bubbles are bounced after collision and the separation distance between the bubbles becomes greater than the initial one in Figs. 15(b) and 15(c).
4. Discussions
4.1. Bubble Shape
Bubble shapes are characterised in terms of three dimensionless parameters, the Eötvös number, Eo, the Morton number Mo, and the bubble Reynolds number, Re, which are defined as:
|
Mo=
g
μ
l
4
Δρ
ρ
l
2
σ
3
| (9) |
Where Δ
ρ=
ρl−
ρg and
ut is the bubble terminal velocity.
Figure 16 shows the bubble rising velocities in the present simulated conditions by the VOF model. Zhang
et al.31) calculated the terminal velocities of gas bubbles in liquid steel from different models and obtained a smoothed mean value. Xu
et al.32) also obtained the bubble terminal velocity by the VOF mode. The present simulation results show that the bubble terminal velocities are around 0.32 m/s for the current conditions. Clift
et al.33) summarized existing experimental data on rising velocity and the shape of single bubble in terms of these parameters and generalized a regime of bubble shapes. However, it is out of the regime because no experimental data exists for the argon-steel system. The simulation results of the bubble rising trajectories and shapes in liquid steel with different bubble sizes have given in
Fig. 9. The present authors suggest that the shape for various bubble conditions in the argon-steel system are summarized in
Table 4.
Table 4. The shape for different bubble diameters in the argon-steel system.
| Bubble diameter (mm) | Eo | Mo | Re | Shape |
|---|
| 7.82 | 2.99 | 1.22×10⁻¹² | 2231 | spherical-spherical
cap-ellipsoidal-wobbly |
| 8.52 | 3.56 | 1.22×10⁻¹² | 2454 |
| 9.39 | 4.32 | 1.22×10⁻¹² | 2730 |
| 10.12 | 5.02 | 1.22×10⁻¹² | 3051 | spherical-spherical
cap-ellipsoidal-ellipsoidal cap |
| 11.68 | 6.68 | 1.22×10⁻¹² | 3624 |
| 12.27 | 7.38 | 1.22×10⁻¹² | 3916 |
| 13.26 | 8.61 | 1.22×10⁻¹² | 4262 |
| 14.89 | 10.86 | 1.22×10⁻¹² | 4805 |
| 15.00 | 11.02 | 1.22×10⁻¹² | 4950 |
Figure 17 shows the velocity vector in and around the leading bubble and the trailing bubble, which previously described the detailed process of two coaxial bubbles coalescence in Fig. 11. The velocity vectors are roughly symmetric around bubble for the symmetric shape in Fig. 17(a). The rising velocity of the trailing bubble is larger than that of the leading bubble, indicating that the trailing bubble is chasing. The behavior of the trailing bubble is significantly affected when located in the wake of the leading bubble. In Fig. 17(b), the highest velocity appears at the bottom of the leading bubble and at the top of the trailing bubble, respectively. Hence the leading bubble and the trailing bubble become flat and elongated. Figure 17(c) shows the bubble deforms in shape to a ball. The overall motion direction during bubble rising is upward and other motion directions also can be seen in Fig. 17. The corresponding pressure fields of two coaxial bubbles coalescence are shown in Fig. 18. There is a pressure difference between the upper and lower surfaces for each bubble, which generates lift so that the bubbles moved upward. The pressure difference of the trailing bubble is higher than the leading bubble and it also shows that the trailing bubble is chasing.

We observed that the coalescing processes include three steps: (1) the acceleration of the trailing bubble; (2) the elongation of the trailing bubble overtaking the leading bubble; and (3) drainage, thinning, and rupture of the thin film of liquid merging one bubble. The leading bubble behaves like an isolated bubble before coalescence, but the shape and the rising speed of the trailing bubble are significantly influenced when located in the wake of the leading bubble.
4.3. Bouncing of Two Parallel Bubbles
Figure 19 shows the velocity fields of two parallel bubbles bounce in liquid steel, which previously described the detailed process in Fig. 15. In Fig. 19(a), there is a pair of symmetrical large eddies on the outer edge of bubbles and small ones on the inner edge, respectively. The bubbles are repelled, separated and bounced when they are closed and the small eddies on the inner edge disappear in Fig. 19(b). In consequence, the separation distance between the bounced bubbles becomes greater than the initial distance in Fig. 19(c). The corresponding profile of velocity verifies the phenomenon. We can see that the small eddies on the inner edge would play an important role when two parallel bubbles bounced. The typical motioning patterns of a pair of bubbles observed that two bubbles collision, bubbles bouncing and larger horizontal separation than the initial distance between bubbles.
5. Conclusions
In this paper, the behavior of bubbling, rising motion, bubble shape and the interactions between two bubbles were investigated with a water model experiment and a 3D numerical simulation in air-water and argon-steel system, respectively. The main conclusions can be summarized as follows:
(1) The initial bubble size increases with increasing in gas flow rate or nozzle size. The bubble size is relatively independent of the nozzle size when gas flow rate is the critical value 0.975 L/min with the nozzle size of 1.5, 2 and 2.5 mm.
(2) The terminal velocities of all these bubbles are around 0.32 m/s. The bubble shape evolution history includes the spherical, spherical cap, ellipsoidal and wobbly changes when the initial bubble diameter is 7.82–9.39 mm, and it undergoes spherical, spherical cap, ellipsoidal and ellipsoidal cap when the initial bubble diameter is 10–15 mm.
(3) The motion and deformation of the trailing bubble are significantly affected by the wake of the leading bubble. The rising velocity of the trailing bubble is larger than that of the leading bubble, which leads to two coaxial bubbles coalescence.
(4) The small eddies on the inner edge of two parallel bubbles have significant effect on the bounce process, which cause bubbles repelled, separated and bounced each other.
Acknowledgements
The authors gratefully express their appreciation to Natural Science Foundation of Liaoning Province (2015020181) for supporting this work.
Nomenclature
Db: Bubble diameter (mm)
Dn: Nozzle diameter (mm)
Dcr: The critical distance between two nozzles (mm)
f: Bubble formation frequency (s−1)
Fs: Surface tension force (N/m3)
g: Acceleration of gravity (9.8 m/s2)
P: Pressure (Pa)
Q: Gas flow rate (L/min)
t: Time (s)
T: A bubble formation period (s)
u: Velocity (m/s)
ut: Bubble terminal velocity (m/s)
Vb: Bubble volume (m3)
Eo: Eötvös number (−)
Mo: Morton number (−)
Re: Reynolds number (−)
α: Value of volume fraction (−)
μ: Viscosity (kg/(m•s))
ρ: Density (kg/m3)
σ: Surface tension coefficient (N/m)
θ: Contact angle (rad)
κ: Curvature (m−2)
n
ˆ
: Surface normal (−)
References
- 1) L. T. Wang, Q. Y. Zhang, S. H. Peng and Z. B. Li: ISIJ Int., 45 (2005), 331.
- 2) H. Bai and B. G. Thomas: Metall. Mater. Trans. B, 32 (2001), 1143.
- 3) L. F. Zhang, J. Aoki and B. G. Thomas: Metall. Mater. Trans. B, 37 (2006), 361.
- 4) G. N. Oryall and J. K. Brimacombe: Metall. Trans. B, 7B (1976), 391.
- 5) R. J. Andreini, J. S. Foster and R. W. Callen: Metall. Trans. B, 8B (1977), 625.
- 6) K. G. Davis, G. A. Irons and R. I. L. Guthrie: Metall. Trans. B, 9B (1978), 721.
- 7) G. A. Irons and R. I. L. Guthrie: Metall. Trans. B, 9B (1978), 101.
- 8) K. Mori, Y. Ozawa and M. Sano: Trans. Iron Steel Inst. Jpn., 22 (1982), 377.
- 9) M. Iguchi, T. Chihara, N. Takanashi, Y. Ogawa, N. Tokumitsu and Z. I. Morita: ISIJ Int., 35 (1995), 1354.
- 10) M. Iguchi, H. Kawabata, K. Nakajima and Z. I. Morita: Metall. Mater. Trans. B, 26 (1995), 67.
- 11) C. A. Llanos, S. G. Hernandez, J. A. R. Banderas, J. D. J. Barreto and G. S. Diaz: ISIJ Int., 50 (2010), 396.
- 12) H. P. Liu, Z. Y. Qi and M. G. Xu: Steel Res. Int., 82 (2011), 440.
- 13) Y. G. Xu, M. Ersson and P. G. Jönsson: Metall. Mater. Trans. B, 46 (2015), 2628.
- 14) J. R. Crabtree and J. Bridgwater: Chem. Eng. Sci., 26 (1971), 839.
- 15) J. Katz and C. Meneveau: Int. J. Multiphas. Flow, 22 (1996), 239.
- 16) L. Chen, S. V. Garimella, J. A. Reizes and E. Leonardi: Numer. Heat Transfer A, 31 (1997), 629.
- 17) T. Sanada, M. Watanabe and T. Fukano: Chem. Eng. Sci., 60 (2005), 5372.
- 18) M. van Sint Annaland, N. G. Deen and J. A. M. Kuipers: Chem.Eng. Sci., 60 (2005), 2999.
- 19) N. Hasan and Z. B. Zakaria: Int. J. Heat Fluid Fl., 32 (2011), 755.
- 20) T. Sanada, A. Sato, M. Shirota and M. Watanabe: Chem. Eng. Sci., 64 (2009), 2659.
- 21) W. Y. Fan and X. H. Yin: Chem. Eng. Sci., 21 (2013), 705.
- 22) G. Q. Yang, B. Du and L. S. Fan: Chem. Eng. Sci., 62 (2007), 2.
- 23) V. V. Buwa, D. Gerlach, F. Durst and E. Schlücker: Chem. Eng. Sci., 62 (2007), 7119.
- 24) D. Ma, M. Y Liu, Y. G. Zu and C. Tang: Chem. Eng. Sci., 72 (2012), 61.
- 25) T. A. Engh, H. Sandberg, A. Hultkvist and L. G. Norberg: Scand. J. Metall., 1 (1972), 103.
- 26) L. H. Wang, H.-G. Lee and P. Hayes: ISIJ Int., 36 (1996), 7.
- 27) C. W. Hirt and B. D. Nichols: J. Comput. Phys., 93 (1981), 201.
- 28) A. Valencia, M. Cordova and J. Ortega: Int. Commun. Heat Mass Transfer, 29 (2002), 821.
- 29) J. U. Brackbill, D. B. Kothe and C. Zemach: J. Comput. Phys., 100 (1992), 335.
- 30) Y. Li, G. Q. Yang, J. P. Zhang and L.-S. Fan: Powder Technol., 116 (2001), 246.
- 31) L. F. Zhang and S. Taniguchi: Int. Mater. Rev., 45 (2000), 59.
- 32) Y. G. Xu, M. Ersson and P. G. Jönsson: Steel Res. Int., 86 (2015), 1289.
- 33) R. Clift, J. R. Grace and M. E. Weber: Bubbles, Drops and Particles, Academic Press, New York, (1978), 23.


