Regular Article
Effect of Coarse-grain and Low-grade Iron Ores on Sinter Properties
2017 年 57 巻 5 号 p. 795-804

詳細
2017 年 57 巻 5 号 p. 795-804
In sintering of iron ore, small particles act as a binder that joins larger particles through diffusion and melting. In order to understand the effect of gangue and structure of coarse ore on sinter properties, melt formation in three coarse-grain, low-grade iron ores was investigated. The melt fractions at the sintering temperature were estimated using the phase diagrams and melt fluidity was quantified by testing ore compacts in an infrared furnace. The result indicates that SiO2 can significantly increase the quantity and fluidity of melt during sintering, whereas the effects of Al2O3 and MgO are small. Excessive quantity and fluidity of liquid phase result in merging of micro pores, leaving large pores behind. The impact of blending three ores with a base ore on sinter structure were tested in a mini-sinter pot. The result shows that bonding and pore structure of sinter are dominantly affected by the melt behavior and pore structure of the coarse ore. Relationships between the fluidity index of sinter feed and product properties were explored, showing meaningful and predictable trends. It was demonstrated that fluidity index can be used as parameter to link sinter mix composition and sintering conditions to the properties of the produced sinter.
The utilization of coarse-grain, low-grade iron ores which are often available at lower price compared to high quality ores is of interest to Chinese steelmakers to reduce their raw materials cost. However, the adverse effects associated with the use of these ores including high gangue content and low sinter ability have limited their consumption. Some reports have indicated that with proper sintering conditions including the time and temperature of sintering, as well as the sinter mix basicity, such negative effects can be overcome.1,2,3,4)
The small particles of iron ore blend more readily and are easier to adhere to flux and coke particles during mixing and granulating process.5,6,7) Consequently, they are heated more quickly than the larger particles during sintering, both due to their smaller size and proximity to coke particles, and are also more likely to form liquid phases due to their improved fluxing.8,9,10) Umadevi et al.11) have shown that the majority of −2.5 mm particles in a sinter feed will melt in the process. Meanwhile, most of the large particles that are often only partially wetted by the liquid phase play a vital role in the sinter quality, by providing a porous sinter that maintains the permeability of sinter bed. Generally, smaller particles bond through a liquid slag whereas bonding between coarser particles is dominantly by diffusion.6,12,13) It is therefore important to maintain an optimum size distribution and sinter mix composition for a balance of strong bonding and appropriate sinter permeability.14,15,16)
In this paper, the relationship between the gangue content and amount and fluidity of liquid phase formed during sintering of three coarse-grained, low-grade ores is discussed.
The raw materials were collected from the stock yards of sinter plant in (Wuhan Iron and Steel Co., Ltd.). The chemical composition of four iron ores, together with the sinter additives are presented in Table 1. Table 2 shows the particle size distribution of the ores. Ores A, B and C are hematite type and considered as coarse-grain and low-grade, compared to the typical blended ore used as the sinter mix. The blended ore is a mixture of several ore grades and is used in the present study as the reference material. As seen in Table 1, ores A–C contain a considerably higher gangue; ore A has the highest SiO2, ores B and C contain 3.8% Al2O3, and ore C has the highest MgO among the four ores, at 1.22%.
| Iron ore | TFe | FeO | SiO2 | Al2O3 | MgO | CaO | LOI |
|---|---|---|---|---|---|---|---|
| A | 53.51 | 0.90 | 15.65 | 1.32 | 0.29 | 0.93 | 3.4 |
| B | 55.29 | 1.13 | 10.41 | 3.88 | 0.12 | 0.42 | 4.6 |
| C | 47.32 | 0.97 | 8.93 | 3.76 | 1.22 | 1.03 | 2.4 |
| Blended ore | 62.08 | 1.66 | 5.83 | 1.74 | 0.25 | 0.17 | 3.1 |
| Lime | 0.22 | 3.01 | 0.31 | 0.74 | 82.53 | 0.5 | |
| Limestone | 1.46 | 2.48 | 0.21 | 3.88 | 50.36 | 48.6 | |
| Dolomite | 2.34 | 1.14 | 0.11 | 19.54 | 32.29 | 46.7 | |
| Coke breeze | 2.01 | 5.68 | 3.41 | 0.21 | 0.17 | 12.3 |
| Iron ore | Size (mm) | |||||
|---|---|---|---|---|---|---|
| +5 | 3.5–5 | 2–3.5 | 1–2 | 0.5–1 | –0.5 | |
| A | 32.6 | 25.1 | 16.1 | 14.0 | 5.0 | 7.2 |
| B | 50.5 | 13.8 | 7.7 | 7.2 | 9.2 | 11.6 |
| C | 57.9 | 20.6 | 10.7 | 6.4 | 2.5 | 1.9 |
| Blended ore | 21.9 | 18.7 | 18.7 | 14.4 | 7.0 | 19.4 |
Bergstrand et al.17) have reported that the liquid phase of sinter is primarily formed by the −0.5 mm particles. Other researchers12,13,18) have carried out basic sintering experiments using grinded ores of −0.125 mm. In order to be able to compare the results, the ores and lime used in the assimilation and melt fluidity tests were also grinded to −0.125 mm in a vibration mill.
According to literature,4,19,20) CaO/SiO2 greater than 1.8 in the sinter feed promotes formation of calcium ferrite which is beneficial for sinter strength. In order to separate the effect of particle size and composition on the melt properties, the dry final feed, with composition shown in Table 3, was screened to various size fractions, and the CaO/SiO2 ratio was measured for each batch. Figure 1 provides the results indicating that the basicity is rather uneven across the range of particle sizes. The average basicity of sintered dry final feed was found to be close to the starting material (1.76 after sintering, versus 1.8). The highest and lowest basicity values were 2.53 and 1.5 for the 1.0–2.0 mm and +5.0 mm fractions, respectively. Considering these findings, the range of basicity covered in the fluidity was varied between 1.0 and 3.0.
| Constituents (wt-%) | CaO/SiO2 (sinter) | |||||
|---|---|---|---|---|---|---|
| Blend ore | Return sinter | Lime | Limestone | Dolomite | Coke | |
| 55 | 30 | 2.1 | 6.5 | 2.5 | 3.90 | 1.76 |

Basicity distribution in different size fractions of the dry final feed.
The formation of calcium ferrite in sinter is known to improve its properties significantly.13,21) Literature22,23,24) also indicates that the proper sintering conditions for calcium ferrite formation are treatment of up to 3 minutes at 1200–1300°C.
Figure 2 shows the temperature profiles in the upper (100 mm), middle (300 mm) and lower (500 mm) layers of the bed in a sinter pot with Ø 200 mm and 700 mm height. From top to bottom, the maximum measured temperatures are 1265°C, 1340°C, and 1400°C, respectively, with corresponding sintering time above 1250°C of 0.8, 2.1, and 2.9 minutes. In a series of mini-pot sintering tests described later, the temperature profile of the middle layer of the large pot was reproduced by applying the heating regime shown in Table 4.

Temperature profiles at different positions of the sintering bed in a pot.
| Stage | Rising period of temperature | Soaking period | Cooling period | |||||
|---|---|---|---|---|---|---|---|---|
| Atmosphere | N2 (2.0 L/min) | Air (2.0 L/min ) | ||||||
| Temp. (°C) | 0→600 | →1000 | →1200 | →Max | Max | →1100 | →1000 | →400 |
| Time (min) | 5 | 2.5 | 1.5 | 1.5 | 0–3.0 | 2.0 | 1.5 | 5 |
The assimilation of iron ores with lime was studied at 1300°C. Disks of iron ore (6 mm dia., 5 mm height) were prepared by compacting −0.125 mm particles in a die under a 10 MPa load using a hydraulic press. The same procedure was employed to produce disks of lime with 20 mm dia. and 5 mm height. The iron ore disk was centered on the lime disk, the two were then placed in an infrared furnace, and heated according to the program presented in Table 3. The quantities of lime reacted with the four types of ores were then quantified.
2.2.4. Melt Fluidity TestsIron ores of −0.125 mm were first blended with appropriate amounts of lime to reach the desired basicity. Then, the mixture was pressed into compacts of 6 mm dia., 5 mm height, and heated in the infrared furnace following the procedures of Table 3.
The degree of spreading of compacts during sintering was used to evaluate melt fluidity. In sintering process, the primary liquid will assimilate the large particles, thus the spreading and interactions are critical to the bonding condition along the melt-particle interface. The initial (A0) and spread (A1) areas were measured as seen in Fig. 3, and used in Eq. (1) to determine the fluidity index, F. Using this technique, the effects of sintering time and temperature, as well as the mixture basicity on melt fluidity were established and cast into empirical correlations. Further, the structure of the produced sinter was investigated using optical microscope.
| (1) |
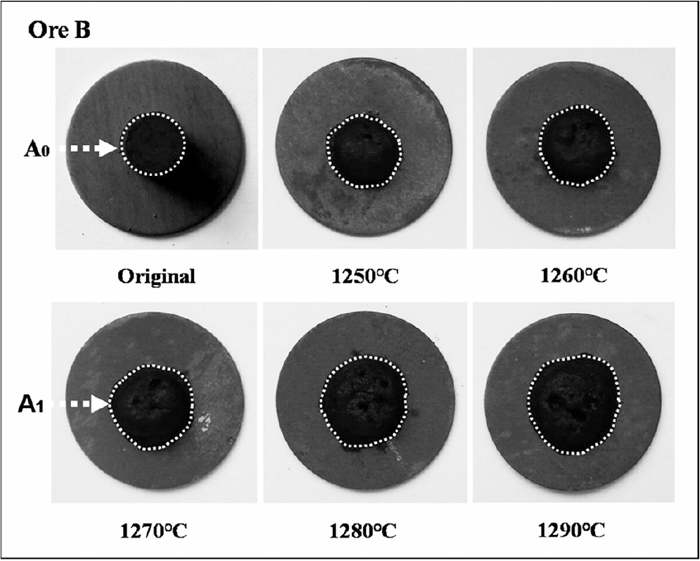
Original and spread samples sintered form 1250 to 1290°C.
In order to investigate the effect of the three ores on sintering behavior and sinter structure, tests were carried out in a mini-pot. First, three mixtures were prepared by adding ores A, B and C to the blended ore in a ratio of 15:85. The sinter feed was produced by blending these ore mixtures with sinter return (30%), coke (3.9%) and appropriate amounts of lime, limestone and dolomite to adjust the calculated basicity to 1.8. Then, the material was fed to a drum mixer (dia. 300 mm) and blended for 3.0 min while ~6.3 wt% of atomized water was added.
The mini-pot consisted of a corundum-tube (Ø =25 mm, height=30 mm) that was filled with 15 g final feed, and was expected to duplicate the sintering conditions in the middle layer of the larger pot, by following the heating procedures of Table 3. The maximum temperature in these tests was 1300°C with a dwell time of 1.0 min. Air was purged from the bottom of pot during sintering. After cooling, the specimen was sectioned and observed under optical microscope to study the structure and mineralogy of the sinter.
2.4. Standard-pot SinteringIn order to investigate the relationship between the fluidity index and sinter properties, the final feed was sintered in a standard sintering pot of 200 mm dia. and 700 mm height, and the sinter properties were studied. As shown in Table 5, ten mixtures of blended ore (85%) and low-grade ores (15%) were prepared using a procedure similar to the mini-pot tests. For each mixture, the material was charged into the pot and ignited at 1050°C for 2.0 min while a draft of −10 kPa was maintained during the process. After cooling in the air, sinter quality indices such as drum strength (ISO TI), Reduction Degree (RI), Low Temperature Reduction Degradation Index (RDI), and softening properties were evaluated. In addition, the coke consumption and FeO content of the sinter were quantified.
| Tests | Mixture | Final feed | ||||||
|---|---|---|---|---|---|---|---|---|
| Composition (wt.%) | Moisture | Size Distribution/(wt.%) | ||||||
| Blended ore | Ore A | Ore B | Ore C | (wt.%) | −2.0 mm | 2.0–3.15 mm | +3.15 mm | |
| S1 | 85 | 5 | 10 | 6.22 | 38.30 | 10.30 | 51.40 | |
| S2 | 85 | 10 | 5 | 6.07 | 39.66 | 10.47 | 49.87 | |
| S3 | 85 | 15 | 6.34 | 38.90 | 13.06 | 48.04 | ||
| S4 | 85 | 5 | 10 | 6.42 | 34.74 | 12.32 | 52.94 | |
| S5 | 85 | 10 | 5 | 6.01 | 36.83 | 11.36 | 51.81 | |
| S6 | 85 | 15 | 6.17 | 40.21 | 9.46 | 50.33 | ||
| S7 | 85 | 10 | 5 | 6.11 | 37.88 | 13.86 | 48.26 | |
| S8 | 85 | 5 | 10 | 6.35 | 36.33 | 13.21 | 50.46 | |
| S9 | 85 | 15 | 6.47 | 34.07 | 12.80 | 53.13 | ||
| S10 | 85 | 5 | 5 | 5 | 6.44 | 38.89 | 10.67 | 50.44 |
| S | 100 | 6.32 | 38.16 | 13.97 | 47.87 | |||
Ores A, B, C, as shown in Table 1 have a relatively wide range of SiO2 from 9–16%, which is a component known to significantly affect liquid phase formation in sinter.13,15) Other components have shown different effects. For example, Kongoli and Yazawa25) reported that increasing Al2O3 up to 7% in Fe2O3–CaO–SiO2–Al2O3 results in approximately 6–8°C increase in liquidus temperature of slag per each 1% of alumina. For a similar ternary system of Fe2O3–CaO–SiO2, the liquid region of the phase diagram was enlarged by the addition of Al2O3 and shrunk by the addition of MgO at 1300°C.26)
In the current study, the phase diagrams of Fe2O3–CaO–SiO2 system corresponding to the compositions of the three coarse-grain and low-grade ores were produced using FactSage™ 7.0, and the effect of ore gangue content on liquid phase at a temperature of 1200–1350°C was investigated. Because of the small and comparable concentrations of FeO in the three original ores, the FeO content in the following diagrams was fixed at 1.0%.
Figures 4, 5, 6, 7 present the liquid region in the Fe2O3–CaO–SiO2 with different additions of Al2O3 and MgO.
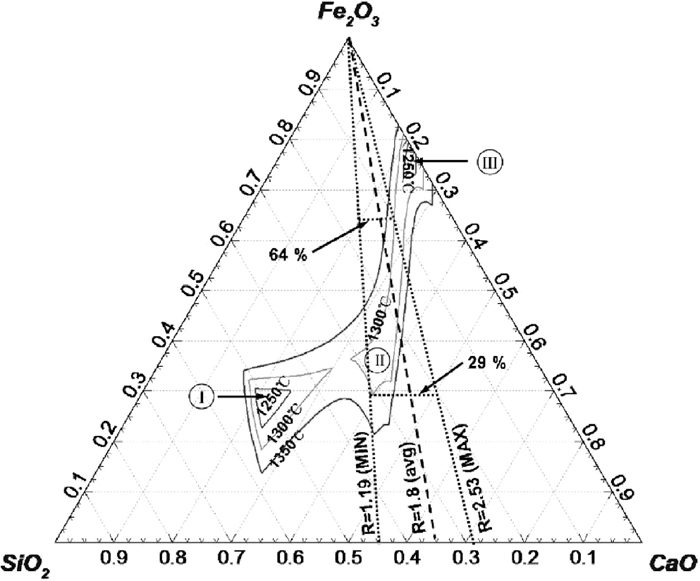
Liquidus isotherms for the Fe2O3–SiO2–CaO system at 1250–1350°C (1 mass% FeO).

Liquidus isotherms for Fe2O3–SiO2–CaO–1.32 mass% Al2O3 at 1250–1350°C (1 mass% FeO).
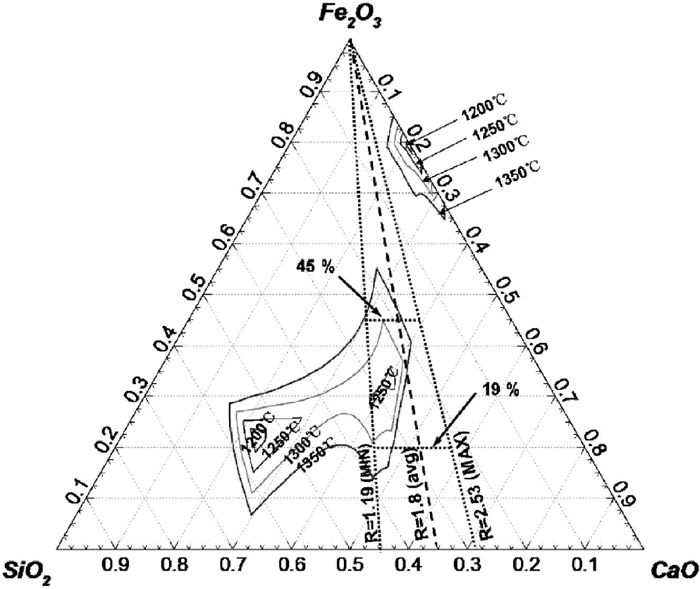
Liquidus isotherms for Fe2O3–SiO2–CaO–3.88 mass% Al2O3 at 1250–1350°C (1 mass% FeO).

Liquidus isotherms for Fe2O3–SiO2–CaO–3.76 mass% Al2O3–1.22 mass% MgO at 1250–1350°C (1 mass% FeO).
Figure 4 shows that at 1300°C there are three liquid phase areas. Zone I is an isolated area with Fe2O3 of approximately 20%–35% and basicity of 0.43–0.53. Zone II and III are joined to a long narrow strip with Fe2O3 ranging from 29 to 80%, Zone II with the basicity of ~1.2 and Zone III with the basicity greater than 10. According the basicity range in the sinter feed (1.19–2.53) that falls on or around Zone II this is where liquid composition could be during sintering. The Fe2O3 concentration at 1300°C in this zone is in the 29–64% range depending on the basicity. For the ores with lower basicity (higher SiO2), the liquid region is widened, covering a greater range of Fe2O3. This indicates that a sinter made from ore A would have a larger amount of liquid than B and C at 1300°C.
Figure 5 shows the Liquidus isotherms for ore A with 1.32 Al2O3. Compared to the Al2O3-free system (Fig. 4) at 1300°C, addition of this small amount of alumina expands Zone II so that it is merged with Zone I, while Zone III is separated from Zone II. The liquid region in this system at the basicity of 1.19–2.53 covers a smaller Fe2O3 content of 27–56% at 1300°C. Figure 6 shows the liquidus for ore B with 3.88% Al2O3. Comparing Figs. 6 with 5 at 1300°C, one can see a larger liquid region in the middle of diagram (merging of Zones I and II) and a smaller content of Fe2O3 in this region, 19–45%. Figure 7 displays the liquidus isotherms for ore C with 3.76% Al2O3 and 1.22% MgO. In comparison with Fig. 6 at 1300°C, Zone I has expanded and Zone II has slightly shrunk, with the percent of Fe2O3 in liquid region being 21–44%.
The above results show that the liquid formation is greater for ore A and is suppressed when ores B and C are used. The effects of SiO2, Al2O3, and MgO on melt formation are consistent with earlier reports and will be discussed in the following sections based on sintering tests.
3.1.2. Effect of Gangue on Melt FluidityThe viscosity of melt formed during sintering of the three ores with basicity of 1.8 at 1250°C was calculated using FactSage™ 7.0. The results, presented in Fig. 8, indicate significantly lower viscosity for melt A, and comparable values for B and C. The blended ore, currently being used at WISCO would have a melt with the highest viscosity. These results confirm the critical effect of SiO2 on melt fluidity, in addition to its known effect on melt quantity.

Calculated viscosity of melt formed from different ores.
Figure 9 presents the extent of assimilation with lime for the four kinds of ores at 1300°C. Ore A has the highest assimilation, presumably because of its high SiO2 content. Ores B and C exhibit lower assimilation than A, and slightly better than the blended ore, which can be explained by their SiO2 and Al2O3 contents. Higher MgO in C may have been the reason for greater assimilation in C than B. These results are also consistent with the variation of liquid region (Zone II) discussed above.

Amount of assimilated CaO with different ores at 1300°C.
Figure 10 shows the relationship between fluidity index of melt and basicity for the three coarse ores and the ore blend. For each material, samples were prepared with a range of basicity, and sintered at 1260°C for 2.0 min. The empirical correlation was established between the fluidity indexes (F) and basicity (R) by regression analysis, with the results provided in Eqs. (2), (3), (4), (5). The correlations are strong, showing increased melt fluidity with basicity, and at the same time, there are noticeable differences between different ores, ore A showing the highest fluidity, followed by B, C, and finally the blended ore. The constants and coefficients in these correlations have different sigs for each ore which is a result of regression which yields constants that would produce the best fit between the experimental data and the curve.
| (2) |
| (3) |
| (4) |
| (5) |

Relationship between fluidity index of sintering melt and CaO/SiO2.
Figure 11 shows that the fluidity index of samples increases with the increase of temperature. The samples with CaO/SiO2 of 2.6 were heated form 1220 to 1300°C in interval of 10°C for 2.0 min. Comparing the results, the trend of fluidity is as following, A has the highest index while B, C, and blended ore show comparable values. The regression equations of fluidity index (F) as a function of temperature (T) are presented in Eqs. (6), (7), (8), (9).
| (6) |
| (7) |
| (8) |
| (9) |

Relationship between fluidity index of sintering melt and temperature.
Ore samples with CaO/SiO2 of 2.6 were sintered at 1260°C with 1.0 to 3.0 min holding time at this temperature. The results are shown in Fig. 12 and the regression equations are presented below. Similar to the effect of temperature, Ore A has the highest fluidity indexes, while B, C, and blended ore show comparable values. This follows a trend consistent with the SiO2 content of the ores.
| (10) |
| (11) |
| (12) |
| (13) |

Relationship between fluidity index of sintering melt and soaking time at 1260°C.
The above results indicate that the quantity and behavior of melt in sintering depends on gangue content, particularly SiO2, as well as basicity, temperature and soaking time. According to the Eqs. (2), (3), (4), (5) and (6), (7), (8), (9) and (10), (11), (12), (13), it can be deduced that the quality of reactant (CaO) and temperature are the two main factors affecting the rates of formation and spreading of liquid. It is also evident that the soaking time affects the rates but not the same extent.
3.3. Effect of Melt Fluidity and Amount on Sinter Structure and Mineral PhasesFigure 13 shows the cross-section of sinters made from the four ores at 1260°C for 1.0 min. The basicity for all sinter feeds was adjusted to 1.8. It can be seen that a large pore of 2.7 mm and several pores <1 mm are formed in sinter A. ores B and C contain a larger number of pores in the range of 0.5–1.0 mm. Blended ore has the highest number of visible pores, and they look more uniform in size with majority in the 0.5–1.0 mm range. These results indicate that excessive melt fluidity and content, as expected for ore A, result in formation of larger pores at the expense of merging smaller ones. Conversely, when the melt does not have the sufficient quantity and fluidity, the tendency is towards formation of a large number of small pores. Both these extreme cases produce a sinter of low quality.

Cross section of fluidity samples sintered at 1260°C for 1.0 min (CaO/SiO2=1.8).
Figure 14 shows the microstructure of sinters produced in the mini pot at 1300°C for 1.0 min from a mixture of one of the coarse ores (A–C) and the blended ore. The wetting of large particles (+5.0 mm) with melt and bonding of them is of interest to investigate the effect of coarse ore on sinter structure. Figure 14(a1) exhibits formation of a few pores along the melt-particle interface. This is due to the excessive quantity and fluidity of the melt, i.e. the bonding phase, which leads to merging of pores and draining of the melt from these particles, leaving large pores near them. Figure 14(a2) confirms that the +5.0 mm particles of ore A are difficult to be wetted by the melt. Figure 14(b1) corresponding to ore B shows a structure with a large number of pores and cracks along the interface. The reason for this is believed to be that the melt infiltration between particles has been suppressed due to the inadequate melt fluidity of ore B. Figure 14(b2) shows that the +5.0 mm particles of ore B are thinly coated by the melt and a melt-infiltrated layer with little porosity has formed at edge of large particles. As seen in Fig. 14(c1), there are less pores in the solidified phase along the interface because of the easily percolated structure and proper melt fluidity of ore C. Figure 14(c2) shows that the +5.0 mm particles of ore C are more easily wetted by melt than ore B due to the lower density (higher porosity), so the melt-infiltrated layer is thicker. Further, the formation of SFCA (Silico-ferrites of Calcium and Aluminum) was confirmed using SEM-EDS, as shown in Fig. 15. In general, the sinter structure is influenced by both melt properties and density of ore. The above results show that among the three ores, C results in a sinter of more favorable structure, followed by A and B.

Microstructures of sample sintered at 1300°C for 1.0 min in the mini pot. (CaO/SiO2=1.8) 1. Hematite, 2. Calcium ferrite, 3. Magnetite, 4. Pore, 5. Silicate.

SFCA (Silicoferrite of Calcium and Aluminum) at the interface sinter of blended ore.
Equations (2), (3), (4), (5), (6), (7), (8), (9), (10), (11), (12), (13) show that R, T and t are the main factors affecting the fluidity index (F). Supposing reference values of Fi(R), Fi(T) and Fi(t) for ore i are Fi(R0), Fi(T0) and Fi(t0) and the F-R, F-T and F-t correlations are independent from one another, any variation in one of these parameters would change F by ΔFi, which can be calculated as following.
| (14) |
| (15) |
| (16) |
Taking Fi(R0, T0, t0) as a common point and reference value of Fi(T), Fi(R) and Fi(t), the fluidity index corresponding to different conditions of R, T, t varying can be estimated by adding the ΔFi(R), ΔFi(T), ΔFi(t) to the reference value point as:
| (17) |
The following reference values were selected for the four ores: R0=2.6, T0=1260°C and t0=2.0 min. In order to validate Eq. (17), four ores were grinded to −0.125 mm, pressed to cake with R=2.0 and sintered at T=1300°C for t=1.0 min. Figure 16(a) compares the measured and calculated F values for these conditions, demonstrating good agreement.
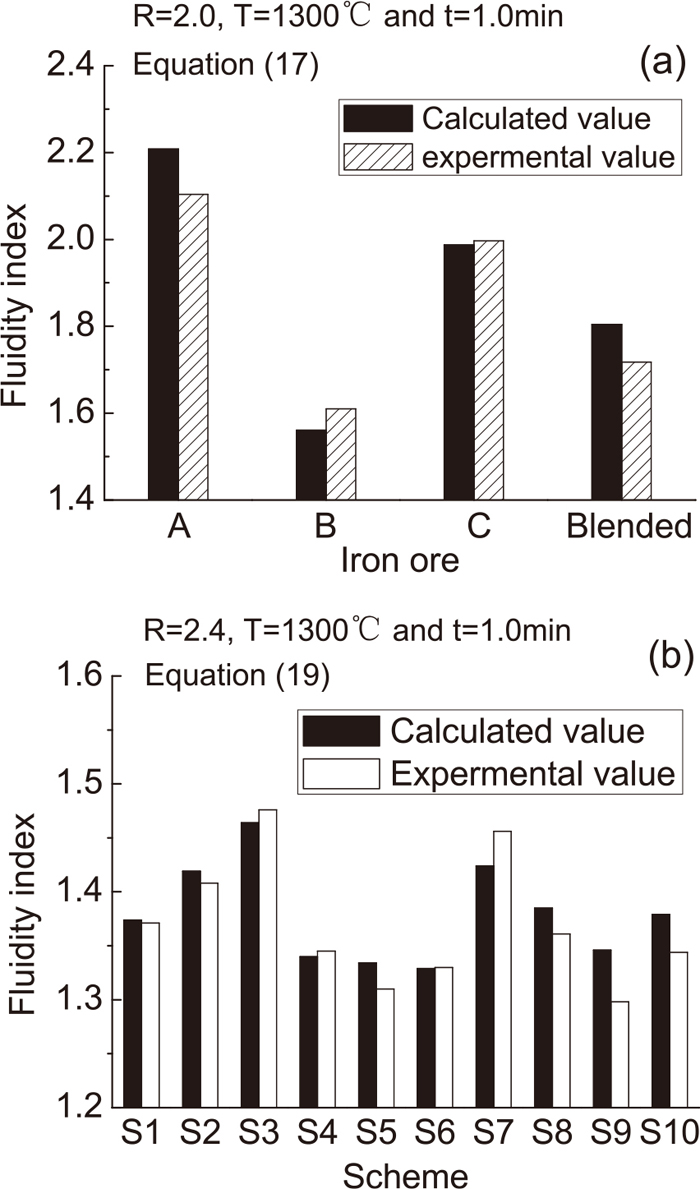
Comparison of calculated and measured fluidity for various sintering conditions.
Figure 1 showed that the basicity of one ore is uneven for different particle size fractions, i.e. the ore is an inhomogeneous mixture. In order to calculate fluidity index of such mixture, we assume that the ore constitutes n size fractions with mass of fraction j being αj, and its basicity being Rj. The fluidity index of the ore, F* is the weighted average of fluidity index for different size fractions, i.e.:
| (18) |
This correlation assumes that the interactions between the different size fractions is negligible compared to the effects R, T and t. If a blended ore is made by mixing n different ores with mass of ore i being γi and its composite fluidity index being
| (19) |
In order to validate Eq. (19), the 10 mixtures of Table 5 were grinded to size of −0.125 mm (α−0.125 mm =100 wt%), pressed to cakes with R=2.4 and sintered at T=1300°C for t=1.0 min. The comparison between calculated and measured values in Fig. 16(b) again shows a very good agreement.
In order to explore a correlation between fluidity index and sinter properties, the final feeds in Table 5 were sintered in a sinter pot and their properties were measured (Table 6). In addition, from the basicity ratio of different size fractions in Fig. 1, size distribution of the ores (Table2) and method described above, the fluidity index of S1-10 was calculated and the results are provided in Table 5.
| Tests | F | Sinter properties | Sinter reducibility | |||||||
|---|---|---|---|---|---|---|---|---|---|---|
| ISO TI | Coke consumption | FeO | CaO/SiO2 | RDI | RI | Softening properties | ||||
| T10% | T40% | ΔT | ||||||||
| +6.3 mm% | Kg/t | wt.% | −3.15 mm% | % | °C | °C | °C | |||
| S1 | 0.993 | 63.87 | 58.68 | 7.33 | 1.77 | 36.2 | 87.25 | 1189 | 1353 | 164 |
| S2 | 1.033 | 66.47 | 57.67 | 7.65 | 1.82 | 32.9 | 86.31 | 1197 | 1348 | 151 |
| S3 | 1.073 | 65.58 | 56.14 | 7.99 | 1.81 | 33.7 | 86.22 | 1177 | 1338 | 161 |
| S4 | 0.955 | 64.38 | 63.73 | 6.97 | 1.80 | 37.9 | 88.51 | 1161 | 1349 | 188 |
| S5 | 0.974 | 65.21 | 59.86 | 7.29 | 1.81 | 40.3 | 89.53 | 1175 | 1348 | 173 |
| S6 | 0.988 | 63.48 | 58.33 | 7.46 | 1.71 | 38.5 | 88.38 | 1181 | 1347 | 166 |
| S7 | 1.034 | 68.53 | 57.16 | 8.26 | 1.79 | 33.4 | 84.73 | 1193 | 1350 | 157 |
| S8 | 0.995 | 70.80 | 59.58 | 8.02 | 1.80 | 29.7 | 82.16 | 1182 | 1334 | 152 |
| S9 | 0.955 | 67.94 | 62.85 | 7.70 | 1.83 | 23.6 | 84.46 | 1179 | 1319 | 140 |
| S10 | 0.994 | 66.41 | 58.49 | 7.82 | 1.78 | 34.8 | 85.63 | 1186 | 1347 | 161 |
| S | 0.980 | 66.17 | 58.76 | 7.73 | 1.76 | 32.2 | 83.14 | 1192 | 1349 | 157 |
| Average | 66.24 | 59.20 | 7.66 | 1.79 | 33.9 | 86.03 | 1183 | 1344 | 161 | |
Different groups of mixtures were prepared and tested for the following purposes. Sinters S3, S6 and S9 were made to study the effect of adding different low-grade ores to the base ore, therefore their amount was fixed at 15 wt%. The ISO TI (+6.3 mm) of three sinters are 65.6%, 63.5%, 67.9%, and the RDIs (+6.3 mm) are 33.7%, 38.5%, 23.6%, respectively. These trends are fully consistent with the effect of three ores on sinter structure, Fig. 14.
Mixtures S7, S8 and S9 reveal the effect of A+C on sinter properties, with increasing the rate of ore C and decreasing ore A the fluidity is more favorable to promote the sinter strength, so their ISO TI exceed the average value of 66.2% by 2.3%, 4.6%, 1.7%, respectively. The RDIs are below the average value of 33.9% by 0.5%, 4.2%, and 10.3%, respectively.
The effects of adding A+B, and B+C were studied through (S1, S2, S3) and (S4, S5, S6) groups, respectively. Figure 17 presents the properties and calculated fluidity index of all sinters for comparing the trends. It is evident that some properties of sinter such as coke consumption and FeO content are related to the F. For example, the calculated F of S1, S2 and S3, which test the influence of increasing ore A and decreasing ore B, are 0.993, 1.033, and 1.073. They follow the same order as FeO content (7.3%, 7.7%, 8.0%) and an inverse trend with the coke consumption (58.7%, 57.7%, 56.2%).

Trends of the calculated fluidity index and the experimental sinter properties.
The trends of ISO TI and fluidity index are not strongly consistent, likely due to the different densities of ore A, B and C. Nevertheless, it is clear that the way important sinter properties change with varying the blend composition can be predicted using the methods discussed here.
The effect of addition of coarse-grain, low-grade iron ores to a base ore on the melt formation and sinter structure properties was studied. Correlations were established between melt fluidity and sintering conditions. The following conclusions were drawn.
(1) The quantity and fluidity of liquid phase in sinter is significantly increased by SiO2 addition. Al2O3 has a small positive effect on these and MgO suppresses them slightly.
(2) The formation of liquid phase and its interactions with solids are mainly influence by the gangue content of ore as well as basicity, temperature and soaking time. For ores with good assimilation and high melt fluidity, the small pores merge to form large ones.
(3) The bonding and pore structure of sinter are primarily determined by melt behavior and are also effected by the density (pore structure) of coarse ore. Proper melt can decrease the pores and improve the bonding in sinter. Coarser particles with low density favor development of a melt-infiltrated layer on particles.
(4) Empirical correlations can be established to calculate melt fluidity from the ore composition and sintering regime. Such correlations are effective for predicting the behavior of various ore mixtures in sintering.