Abstract
The effect of the Al-based oxide layer which segregates on the surface of hot-dip galvanized steel sheets (GI) with aging on the frictional properties of the GI was investigated.
Conventional GI with the Zn coating weight of 67 g/m2 including 0.36 mass% Al were used as test specimens. It was found that an Al-based oxide layer grew on the GI surface with aging after production, and the friction coefficient tended to decrease due to the existence of these Al-based oxides. However, this tendency was clearer under the sliding conditions of shorter tool length and higher contact pressure than of longer tool length and lower contact pressure.
In order to understand this behavior, surface observation and analysis of both the test specimens and the tools after sliding were carried out by SEM, EDX and EPMA. Both Al-based oxides and metallic Zn were detected as adhered materials on the tool surface after sliding, and the surfaces of adhered materials were covered with Al-based oxides. This suggests that the adhered materials on the tool have the effects of reducing the adhesion force between the metallic Zn of the GI and the tool and reducing the tool roughness. These effects led to a lower friction coefficient because both shearing and plowing resistance were decreased. In addition, the area on the tool which were covered by the adhered materials depended on the tool length. This is thought to be the reason why the effect of the Al-based oxide layer depended on the sliding conditions.
1. Introduction
Zn-based coated steel sheets are widely used worldwide for automotive body parts because of their high corrosion resistance. Three kinds of Zn-based coated steel sheets are mainly used in automotive parts, galvannealed steel sheets (GA), hot-dip galvanized steel sheets (GI) and electrogalvanized steel sheets (EG). In particular, GI is used widely by automakers in Europe and the United States because it is easier to satisfy both high corrosion resistance and low manufacturing cost due to the ease of controlling the thickness of the Zn coating layer, and because GI has excellent anti-chipping properties.1)
However, all three types have a higher friction coefficient than cold-rolled steel sheets,2,3) causing adhesion of Zn to the tool and delamination of Zn following adhesion, especially in EG and GI, which have a relatively soft Zn coating layer. It is well known that the surface roughness of GI affects its frictional properties,4) and a technology for controlling surface texture by temper rolling in order to improve frictional properties has also been reported.5)
Generally, less than 1 mass% of Al is added to molten Zn in the GI manufacturing process in order to decrease dross and to prevent Zn from alloying with the base steel.6,7) Although the amount of added Al is small, it has been reported that this Al segregates on the GI surface as oxides with increasing aging time.8) This segregated Al-based oxide layer presumably affects the various quality properties which are demanded in the product, however few reports have investigated the effect of this Al-based oxide layer on quality properties.
As a quality property, this study focuses on frictional properties, which are regarded as important for automotive steel sheets and investigates the effect of the Al-based oxide layer which segregates with aging time on the friction coefficient.
2. Experimental Procedure
2.1. Test Specimens
An annealed steel sheet with the thickness of 0.7 mm was hot-dip galvanized by the usual method, and was then temper rolled with a dull roll. This process was performed continuously, and the effects of aging time after production on the GI surface and the friction coefficient were investigated. The time when temper rolling was performed was defined as the starting point of aging time. The test specimens were aged for a certain time period in a desiccator without oil. The coating weight of the Zn, the Al content in the Zn coating layer and the arithmetic average roughness (Ra) of the evaluated side of the test specimen were 67 g/m2, 0.36 mass% and 0.94 μm, respectively. These values were constant regardless of aging time.
2.2. Flat Sliding Test
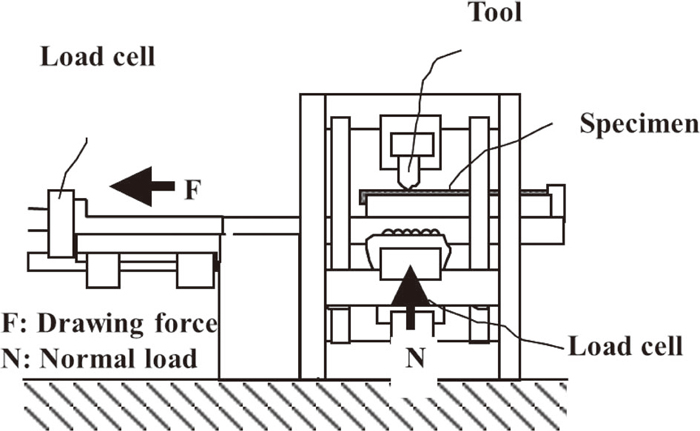
The friction coefficient was measured in a flat sliding test. A schematic diagram of the flat sliding test is shown in Fig. 1. The test specimen was set, and the tool was pressed with a constant normal load N. The specimen was drawn at a constant speed, and the drawing force F was measured. The friction coefficient was calculated by F/N. Before the test, the tools were polished with #2000 polishing paper orthogonally to the sliding direction. The specimens were ultrasonically degreased in alcohol, after which 2 g/m2 of lubricant oil was applied before the sliding test. The lubricant oil was a commercial washing oil with the viscosity of 2.0 cSt at 40°C.
The friction coefficient was measured under two conditions, as shown in Table 1, because the contact length and contact pressure between steel sheets and tools in actual press forming depends on the shape and the position of the part. Condition A has a shorter contact length (tool length), higher contact pressure and higher sliding speed, and has a good correlation with the drawing beads of the tool.9,10) The effect of fluid lubrication on the friction coefficient is considered to be relatively large under this condition.11) Condition B has a longer contact length (tool length), lower contact pressure and lower sliding speed, and has a good correlation with the flat parts of the tool such as die faces, punch bottoms and so on.9,10) The effect of fluid lubrication on the friction coefficient is thought to be relatively small under this condition.11)
Table 1. Summary of flat sliding test tools and test conditions.
Three test specimens with the same history were prepared, and their friction coefficients were measured continuously in order to simulate the continual press forming process used in industry. The lubricant oil was applied to all the test specimens before the test, but measurements were performed without polishing the tool between the three specimens.
2.3. Surface Observations and Analysis
The following surface observations and analysis of both the test specimens and the tools before and after the sliding test were carried out after the specimens and tools were ultrasonically degreased in alcohol.
The florescence X-ray intensity of Al of the test specimens before the sliding test was measured with an X-ray fluorescence spectrometer (XRF), ZSX-101E (manufactured by Rigaku). The amount of Al was calculated from the intensity of Al obtained with specimens and reference steel sheets having a known coating layer, on which metallic Al was vapor deposited. The tube voltage, tube current and measured area were 45 kV, 45 mA and 35 mmφ, respectively.
Al and O on the tool surfaces before and after the sliding test were analyzed with an electron probe micro-analyzer (EPMA), JXA-8100 (manufactured by JEOL). The acceleration voltage, irradiation current and integration time were 15 kV, 0.1 μA and 50 ms, respectively.
The surfaces of both the test specimens and the tools before and after the sliding test were observed with a scanning electron microscope (SEM), ULTRA PULS (manufactured by Carl Zeiss) and analyzed by energy dispersive X-ray spectroscopy (EDX) which was installed in the SEM. The acceleration voltages in the observation and analysis were controlled to 1 kV and 5 kV, respectively.
The analytical depth in XRF was estimated at approximately 2 μm from a theoretical calculation of the X-ray attenuation length.12) In EPMA and EDX, it was estimated at approximately 2 μm and 300 nm respectively, from the result of a Monte Carlo Simulation.13)
3. Results
3.1. Segregation Behavior of Al-based Oxides on GI Surface with Aging Time
Figure 2 shows the relationship between aging time and the amount of Al measured by XRF. The amount of Al after 24 hours of aging is about 2 mg/m2 and increases to approximately 10 mg/m2 after 3000 hours of aging. This behavior is similar to that observed in a previous report8) investigating the segregation behavior of the Al-based oxide layer on the GI surface.

The surfaces of the test specimens after 24 hours of aging (hereinafter, GI after 24 hr) and 3000 hours of aging (hereinafter, GI after 3000 hr) were observed by SEM, and the Al and O contents were analyzed by EDX. The results are shown in Fig. 3. Although the morphology is constant regardless of aging time, as shown in Figs. 3(a) and 3(d), a significant difference is observed in the analytical results of Al, as shown in Figs. 3(b) and 3(e). Although the intensity of Al on the GI after 24 hr is low, some regions which have higher intensities of Al are observed on the GI after 3000 hr. This is considered to be Al which segregated on the GI surface with increasing aging time. In addition, it was found that the segregated Al exsists as oxides because the distributions of Al and O, which are shown in Figs. 3(e) and 3(f) respectively, are substantially the same.
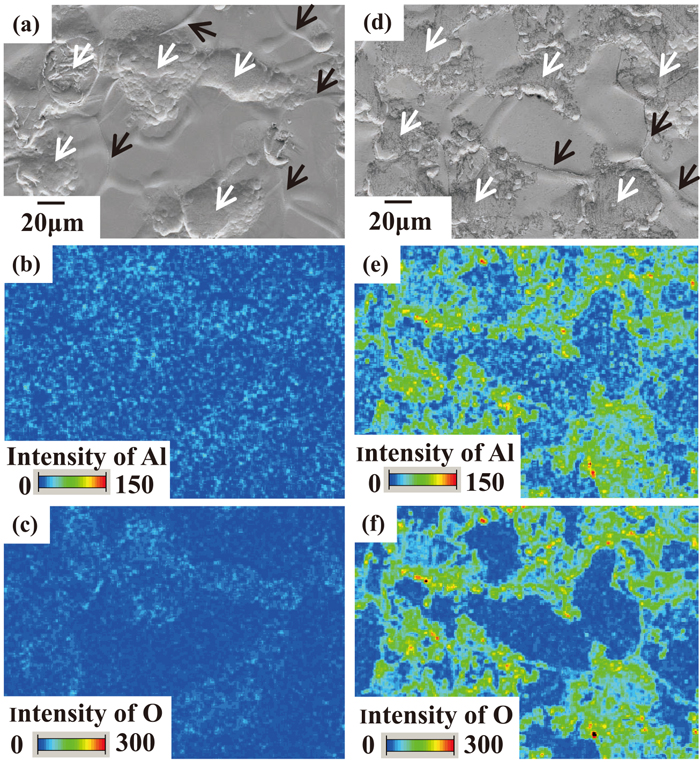
Figure 4 shows SEM images of the GI surface before and after temper rolling. Because the depressions on the GI surface are observed only after temper rolling, this suggests that these depressions were formed by contact with the temper roll. This means that the depressions on the GI surface are areas which came into contact with the temper roll (hereinafter, tempered areas), and the other parts are areas where contact with the temper roll did not occur (hereinafter, non-tempered areas). Therefore, the areas where the Al-based oxides strongly segregated are tempered areas, which are indicated by the white arrows, and the grain boundaries of metallic Zn on non-tempered areas, as indicated by the black arrows in Fig. 3.

The thickness of the Al-based oxide layer can be estimated as several 10 nm at most, even though the Al-based oxides exists heterogeneously, as shown in Figs. 3(e) and 3(f), because the amount of 10 mg/m2 of Al (see Fig. 2) corresponds to the thickness of approximately 10 nm if it is assumed that all the Al-based oxide layer consists of α-Al2O3 and the layer exists uniformly. Therefore, the Al-based oxide layer can be analyzed accurately by all the analytical methods used in this study because the estimated analytical depth of each analytical method, as mentioned in Section 2.3, is much larger than the estimated thickness of the Al-based oxide layer.
3.2. Frictional Behavior
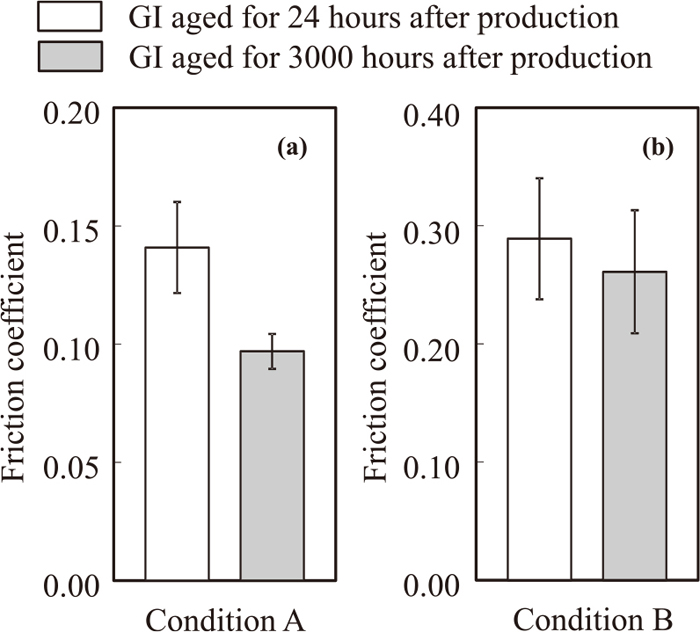
In order to investigate the effect of the Al-based oxide layer on the friction coefficient, the friction coefficients of test specimens with different aging time were measured. GI after 24 hr and GI after 3000 hr were selected as the test specimens because a large difference is observed in their Al segregation behaviors, as shown in Fig. 3, and their friction coefficients were compared. Figure 5 shows the results of the friction coefficients of the specimens. The averaged fiction coefficient of the continuously measured friction coefficients of three test specimens was defined as the friction coefficient. In addition to the value of the friction coefficient, its standard deviation are also shown in the figure. The friction coefficient of the GI after 3000 hr is much smaller than that of the GI after 24 hr when measured under condition A, as shown in Fig. 5(a). When measured under condition B, as shown in Fig. 5(b), the friction coefficient of the GI after 3000 hr is slightly smaller than that of the GI after 24 hr, however the difference between the two is much smaller than that under condition A.
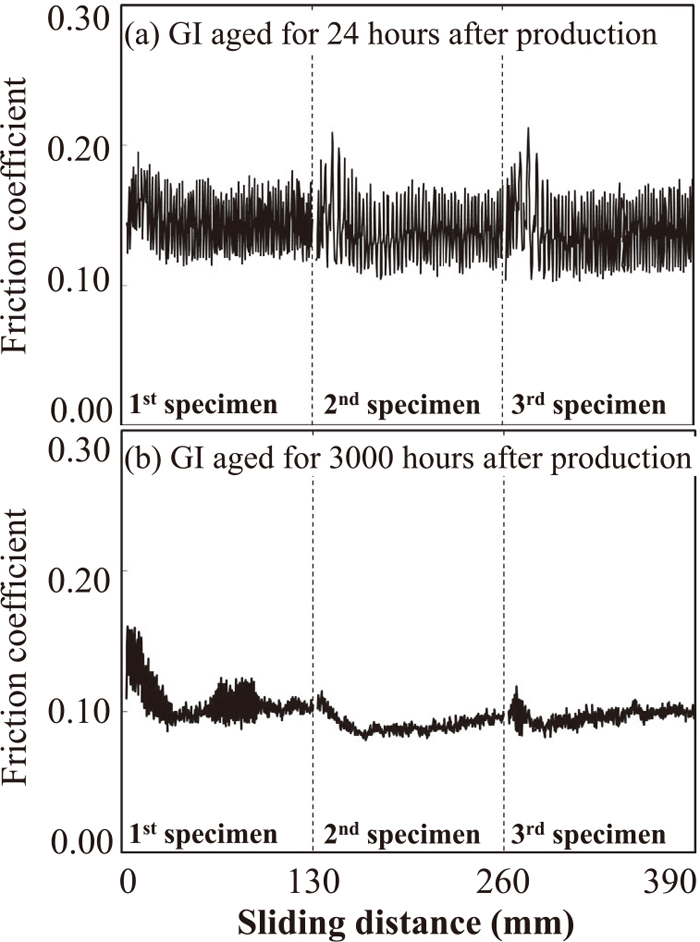
In order to clarify the behavior of the friction coefficient, the relationships between the friction coefficient and sliding distance under conditions A and B are shown in Figs. 6 and 7, respectively. Here, the total sliding distance of the three test specimens during continuous measurement is used as the sliding distance because the measurement was carried out without polishing the tool in the interval between specimens.
Under condition A, as shown in Fig. 6, no obvious change of the friction coefficient of GI after 24 hr is observed from the start of the 1st specimen to the end of the 3rd specimen. When the GI after 3000 hr was used as the test specimen, the friction coefficient at the start of the 1st specimen shows a similar value to that of the GI after 24 hr, however the friction coefficient decreases with increasing sliding distance and tends to show stable behavior without large fluctuations.
Behavior similar to that under condition A is also observed under condition B, as shown in Fig. 7. Again, no obvious change of the friction coefficient of GI after 24 hr is observed from the start of the 1st specimen to the end of 3rd specimen. The friction coefficient of the GI after 3000 hr shows a similar value to that of the GI after 24 hr at the start of the 1st test specimen and decreases with increasing sliding distance, as under condition A. The difference from condition A, however, is the fact that the friction coefficient is still unstable with large fluctuations until the end of the 3rd test specimen. Thus, although the effect of the Al-based oxide layer on the friction coefficient depends on the sliding conditions, the behavior that the friction coefficient decreases as the sliding distance increases is common to both sliding conditions.
4. Discussion
4.1. Change of Friction Coefficient of GI with Increasing Sliding Distance
Because lubricant oil was applied to the test specimens before the test, the interface between the GI and the tool surface is thought to be a mixed lubrication condition, in which both boundary lubrication and fluid lubrication exist. It is thought that the fluid lubrication condition did not change because the morphology and the deformability of the GI coating layer did not change regardless of aging time. Therefore, focusing on the change of the boundary lubrication condition, the surfaces of both the test specimens and the tools were observed and analyzed in detail in order to clarify the reason why the friction coefficient changed as the sliding distance increased.
Firstly, the surfaces of the GI after both 24 hr and 3000 hr before and after sliding under condition A were observed and analyzed by SEM and EDX. The results are shown in Fig. 8. The center area of the 3rd test specimen (approximately 65 mm of sliding distance from start on 3rd test specimen) was observed and analyzed. The areas indicated by the arrows are flattened by actual contact with the sliding tool (hereinafter, contact areas), and the others are the non-contact areas with the sliding tool (hereinafter, non-contact areas), in which the original GI surface remains after sliding. The intensities of Al on both the contact and non-contact areas of GI after 24 hr are relatively low, as shown in Figs. 8(a) and 8(b). In the GI after 3000 hr, as shown in Figs. 8(c) and 8(d), although segregation of Al is observed in the non-contact areas, as in the GI before sliding shown in Fig. 3, the intensities of Al in the contact areas are lower than those in the non-contact areas and are similar to those on the GI after 24 hr shown in Fig. 8(b). In addition, the area where Al segregated on the surface after sliding shown in Fig. 8(d) decreases in comparison with that before sliding, as shown in Fig. 3(e). This tendency is also observed in other observations and analyses.
From these results, it suggests that some parts of the Al-based oxide layer which existed on the GI surface before sliding were mechanically plowed by the sliding. This is supported by the fact that exposed metallic Zn is observed on the GI surface which was in contact with the sliding tool.
Secondly, the tool surfaces before and after sliding under condition A were analyzed by EPMA. Figure 9 shows the analytical results of Al and O on all the tool surfaces which were in contact with test specimens. An area with high intensities of Al and O is observed on the tool surface after sliding, when the intensities of Al and O on the tool before sliding shown in Figs. 9(a) and 9(d) are taken into account as background. The Al-based oxides which existed on the GI surface is thought to have been removed by the sliding tool and then adhered to the tool surface, considering both the results of analysis of the tool surface by EPMA and the GI surface by SEM-EDX, as mentioned above. Distributions of Al and O are observed only at the head end part of the tool surface after sliding on the GI after 24 hr, as shown in Figs. 9(b) and 9(e), whereas Al and O are distributed from the head end to the tail end of the tool surface after sliding on the GI after 3000 hr, as shown in Figs. 9(c) and 9(f), which corresponds to the entire area in contact with the GI surface. This difference is considered to derive from the difference in the amount of Al-based oxides which originally existed on the GI surface.
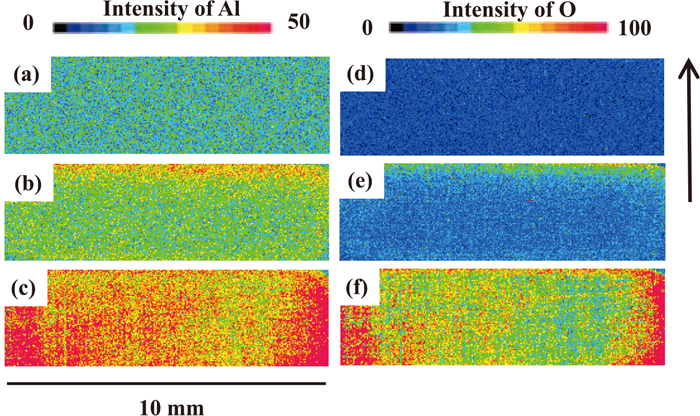
In other words, because the GI after 24 hr had a smaller amount of Al-based oxides on its surface, when the GI after 24 hr was used as the test specimens, all the Al-based oxides on the specimen was removed by the head end of the tool (inlet side of test specimens) and adhered to the tool, after which the exposed metallic Zn came into contact with the tool steel surface without adhered Al-based oxides except at the head end. Although the amount of adhered Al-based oxides increased as the sliding distance increased, there was little change in the contact condition between the GI and the tool surface because the original amount of Al-based oxides on the GI after 24 hrs was small. This can explain the result shown in the Fig. 6(a), where the friction coefficient is constant regardless of sliding distance.
The GI after 3000 hr had a larger amount of Al-based oxides on the surface. Therefore, when this material was used as the test specimens, the Al-based oxides on the GI was removed and adhered to the tool in the same manner, but due to the larger amount of Al-based oxides which originally existed on the GI surface, the Al-based oxides adhered to not only the head end of the tool, but also up to the tail end, essentially covering the entire tool surface. As a result, the friction coefficient of GI after 3000 hr changes as the sliding distance increases, as shown in Fig. 6(b), because the contact condition between the GI and the tool changed as the sliding distance increased, as explained above.
4.2. Mechanism of Reduction of Friction Coefficient by Formation of Adhered Materials on Tool
As the next step, the tool surface before and after sliding was observed in detail by SEM in order to clarify how the Al-based oxides adhered on the tool surface and caused the friction coefficient to decrease. The results are shown in Fig. 10. An in-lens secondary electron detector was used in this observation, as the observed contrast depends on the difference of the substances observed.13) The center of the tool surface was observed.

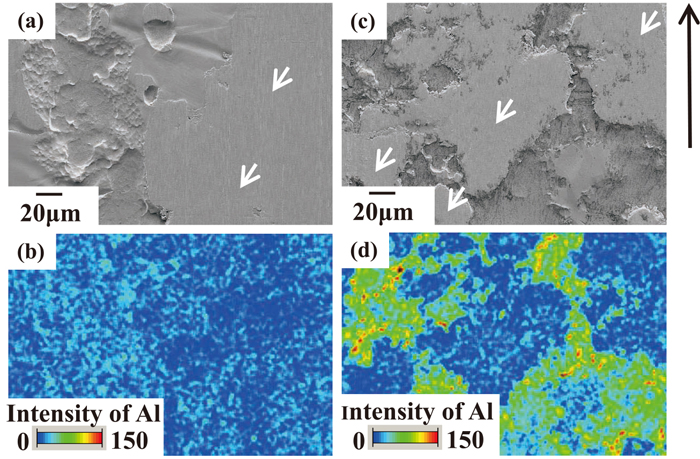
Before sliding, the micro-ridges and micro-grooves of grinding marks which had been introduced by polishing with #2000 polishing paper orthogonally to the sliding direction are observed on the tool surface, as shown in Fig. 10(a). After sliding of the GI after 24 hr, areas of dark contrast corresponding to these micro-ridges and micro-grooves can be observed over the tool surface, as shown in Fig. 10(b). Areas of dark contrast corresponding to the micro-ridges and micro-grooves can also be observed after sliding of the GI after 3000 hr, as shown in Fig. 10(c), but as a characteristic of this material, the areas of dark contrast are much larger than those of the GI after 24 hr. In order to investigate these areas of dark contrast in detail, the area in the white box in Fig. 10(c) was observed at high magnification.
The results are shown in the Fig. 11. As in Fig. 10, the in-lens secondary electron detector was used in this observation. EDX analysis of the areas numbered 1 to 3 in Fig. 11(a) was performed, and the results are shown in Figs. 11(b), 11(c) and 11(d). Observation at high magnification reveals that the areas of dark contrast corresponding to the micro-ridges and micro-grooves on the tool are composed of two compounds. One is an area of bright contrast, such as area 2, and the other is an area of dark contrast, such as area 1.
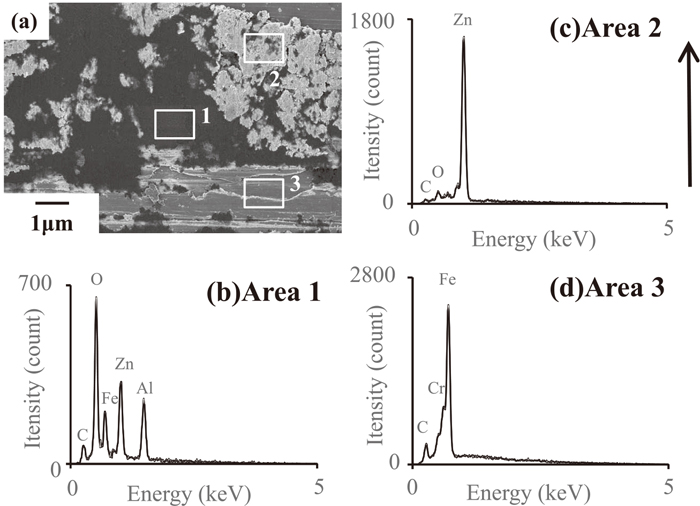
The areas of dark contrast, area 1, is thought to be mainly composed of Al-based oxides which was removed from the GI surface and adhered to the tool surface because Al, Zn, Fe and O are detected in the EDX analysis, as shown in the Fig. 11(b). Although Zn and Fe are also detected, it is thought that the peak of Fe originates from the tool underlying the adhered materials, and Zn is possibly due to metallic Zn underlying the adhered materials, or is detected because the Al-based oxide layer which existed on the GI surface was composed of Zn oxides as well as Al oxides. The areas of bright contrast, area 2, is thought to be mainly composed of metallic Zn which was plowed from the GI coating layer and adhered to the tool surface, as only Zn is detected in the EDX analysis, as shown in the Fig. 11(c). The analytical results of area 3 are shown in Fig. 11(d). Area 3 is the tool steel surface, which consists mainly of metallic Fe.
It is well known that softer metals are plowed by harder metals during metal-to-metal sliding of different metals.14) In this study, the Zn coating layer is cut (plowed) by salient parts of the tool because the hardness of the SKD 11 tool material is 700–800 HV15) while that of the η phase, which is the main component of the Zn coating layer, is 52 HV.16) From the results of observation of the tool after sliding, it has been reported that the GA coating layer, which is harder than the GI coating layer and softer than SKD 11 tool, adhered to the tool surface, and adhered materials were observed corresponding to the micro-ridges and micro-grooves of grinding marks introduced by polishing the tool before the test.15,17) In the sliding test, the SKD 11 tool that was polished with #2000 polishing paper was used, which is the same as that used in this study.15,17) In addition, a sliding model was proposed in which the GA coating layer was cut (plowed) by the micro-ridges and accumulated to the micro-grooves on the tool.17)
In the case of GI, the Al-based oxides and metallic Zn of the GI coating were cut (plowed) by the micro-ridges and accumulated to the micro-grooves on the tool, in the same manner as with GA, because the adhered materials observed corresponding to the micro-ridges and micro-grooves on the tool surface are similar to that of the GA. Al-based oxides containing metallic Zn accumulated to the micro-grooves, after which the surface of those adhered materials was covered with Al-based oxides as the sliding distance increased. The fact that the top surface of the adhered materials is covered with Al-based oxides is a phenomenon unique to GI, and occurs because GI forms more oxides on the surface with aging than GA.
When GI after 3000 hr was used as the test specimens, the contact condition between the tool surface and the GI changed in the following steps as the sliding distance increased. In the 1st step, contact occurs between the tool steel and the Al-based oxide layer on the GI surface. In the 2nd step, the metallic Zn of Zn coating layer is exposed, and contact occurs between the tool steel and the exposed metallic Zn. Then, in the 3rd step, contact occurs between the Al-based oxides of the top surface of the adhered materials on the tool surface and the exposed metallic Zn of the Zn coating layer.
Based on the results of sliding tests in a vacuum atmosphere, Bawden and Tabor teach that the existence of an oxide layer on a metal reduces the friction coefficient because the adhesion force between metals and oxides is much smaller than that between two metals, and reported that the frictional resistance of metal-to-oxide contact is much smaller than that of metal-to-metal contact.14,18) At the same time, the adhered Al-based oxides and metallic Zn on the micro-grooves on the tool surface is also thought to have the effect of smoothing the tool surface by filling the micro-grooves, and this resulted in a decrease in the plowing force.
Summarizing the mechanism of reduction of the friction coefficient, in the initial stage of sliding, the friction coefficient of GI after 3000 hr shows a large value because of the combined effects of the adhesion force between the tool steel and the exposed Zn of the Zn coating layer (metal-to-metal contact) and the plowing force due to the initial roughness of the tool. However, with increasing sliding distance, the friction coefficient decreases for the following two reasons: First, the adhesion force decreases as the tool surface is covered with Al-based oxides, and second, the plowing force also decreases because accumulation of Al-based oxides and metallic Zn to the micro-grooves on the tool surface acts to smooth the tool surface. As a result, the friction coefficient of GI after 3000 hr decreases as the sliding distance increases, as shown in Fig. 6(b).
4.3. Effect of Sliding Conditions
In order to clarify the reason why the effect of the Al-based oxide layer on the friction coefficient depends on the sliding conditions, as shown in the Fig. 5, the surfaces of both the test specimens and the tools before and after sliding under condition B were observed and analyzed in detail.
The surfaces of the test specimens after sliding under condition B were observed and analyzed by SEM and EDX, and the results are shown in Fig. 12. The metallic Zn of the Zn coating layer is exposed in the areas of actual contact with the tool, as indicated by the arrows in the SEM images, because that area shows a lower X-ray intensities of Al. This is the same as under condition A for both the GI after 24 hr, as shown in Figs. 12(a) and 12(b), and the GI after 3000 hr, as shown in Figs. 12(c) and 12(d). On this point, the effects of the sliding condition and aging time are small.

The tool surfaces before and after sliding under condition B were analyzed by EPMA. Figure 13 shows the analytical results of Al and O on all the tool surfaces which were in contact with the test specimens. On the tool after sliding on the GI after 24 hr, as shown in Figs. 13(b) and 13(e), a small area with slightly larger intensities of Al and O is observed around the head end, but overall, the change from before sliding is small. On the tool after sliding on GI after 3000 hr, as shown in Figs. 13(c) and 13(f), the increasing tendency of the Al and O intensity is more remarkable than that with the GI after 24 hr, but the intensities of Al and O decreases toward the tail end of the tool, and become close to that before sliding. This results are clearly different from that under condition A, as shown in Figs. 9(c) and 9(f), where the Al and O intensities increases over the entire area of the tool, which was in contact with the test specimens.
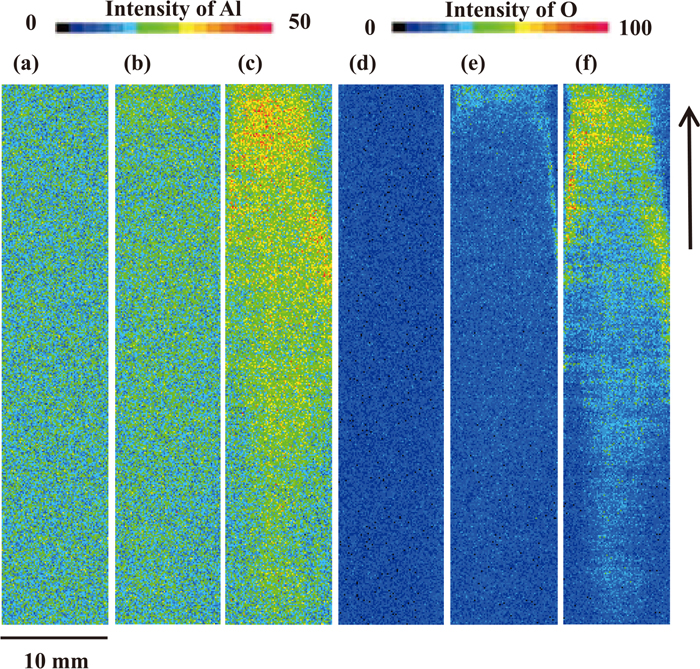
These results suggest that, under condition B, the friction coefficient decreases as a result of adhered Al-based oxides and metallic Zn from the Zn coating layer, as under condition A. However, because the tool length is longer under condition B than under condition A, uniform coverage of the entire tool surface in contact with the test specimen is not possible. Therefore, although the frictional resistance decreases around the head end of the tool due to the metal-to-oxide contact and smoothed tool surface, it increases around the tail end due to metal-to-metal contact and the unsmoothed initial tool surface.
As a result, because the coverage area by adhered materials increases under condition B, the friction coefficient decreases as the sliding distance increases (Fig. 7(b)); however, this trend is slower than under condition A (Fig. 6(b)), which has a shorter tool length.
As under condition A, the tool surface after sliding under condition B was also observed by SEM. The results are shown in Fig. 14. The observation conditions were the same as under condition A. Three areas were observed, these being the area 1.5 mm from the head end of the tool, the center of the tool and the area 1.5 mm from the tail end. As under condition A, both Al-based oxides, which displays a dark contrast, and metallic Zn, which appears as an area of bright contrast, are observed, corresponding to the micro-ridges and micro-grooves introduced by polishing before the test. This suggests that, the Al-based oxides and metallic Zn adhered to the tool under the condition B by the same mechanism as under condition A. A larger area covered with adhered materials is observed around the head end of the tool, the adhered materials tends to decrease from the head end to the tail end of the tool and a larger amount of adhered materials are observed on the tool after sliding on GI after 3000 hr, as shown in Figs. 14(d), 14(e) and 14(f), than that on GI after 24 hr, as shown in Figs. 14(a), 14(b) and 14(c). This is the same as in the EPMA results shown in Fig. 13. However, the amount of adhered materials around the head end of the tool after sliding on GI after 3000 hr in Fig. 14(d) appeares to be smaller than that of the tool after sliding under condition A, as shown in Fig. 10(c), even though it has a relatively larger amount of adhered materials. Because the contact pressure was smaller under condition B than under condition A, the difference of the contact pressure might affect the amount of adhered materials, even though Al-based oxides and metallic Zn adhered to the tool by same mechanism. This difference could be one reason why the effect of the Al-based oxide layer on the friction coefficient depends on the sliding conditions.
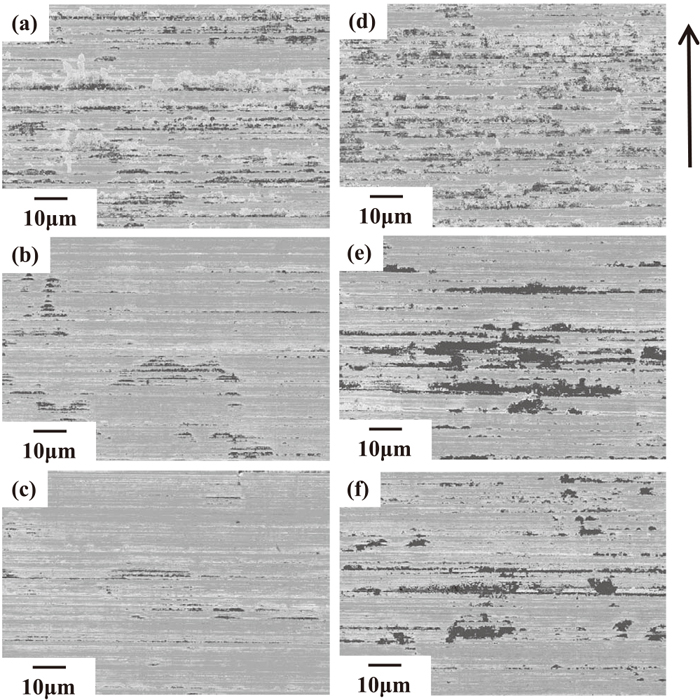
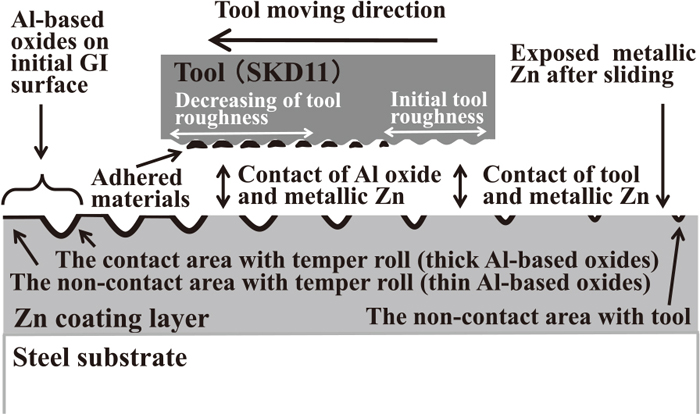
A schematic sliding model which describes the effect of the Al-based oxide layer on the frictional properties of GI is shown in Fig. 15 based on the results of the study under condition A, which has a shorter tool length, and condition B, which has a longer tool length. An Al-based oxide layer, which segregates as aging time increases, exists on the GI surface before sliding. A thicker Al-based oxide layer exists in the tempered area and a thinner oxide layer exists in the non-tempered area around the grain boundary. During sliding, this Al-based oxides are plowed by the micro-ridges of the tool surface from the Zn coating layer and they adhere to the micro-grooves of tool surface together with metallic Zn due to the initial roughness of the tool. Because the top surface of the adhered materials comprises mainly Al-based oxides, the surface of the tool is covered with Al-based oxides. At the same time, the formation of adhered materials also smooth the tool surface because the adhered materials fill the micro-grooves on the tool. Therefore, the friction coefficient decreases because the adhesion force decreases due to metal-to-oxide contact, and the plowing force decreases due to the smoothed tool surface. However, when the tool length is larger, adhered materials cannot cover the entire tool surface. In the uncovered area, the tool steel comes into direct contact with the exposed metallic Zn without an intervening layer of Al-based oxides, i.e. metal-to-metal contact occurs, and the roughness of the tool surface is close to that of initial condition. As a result, the effect of the Al-based oxide layer on the friction coefficient depends on the sliding conditions.
5. Conclusions
The effect of the Al-based oxide layer, which segregates with aging of hot-dip galvanized steel sheets (GI), on the frictional properties of GI was investigated, and the following conclusions were obtained.
(1) The Al-based oxides on the GI tends to increase as the aging time increase. The Al-based oxides tends to segregate on areas where contact with the temper roll occurred and at the grain boundaries of Zn.
(2) The friction coefficient of the GI tends to decrease with aging. This tendency was observed more clearly in the sliding test under condition A, which has a shorter tool length and higher contact pressure, than in the test under condition B, which has a longer tool length and lower contact pressure.
(3) The Al-based oxides of the GI surface was plowed by the micro-ridges of the tool and accumulated to the micro-grooves on the tool together with metallic Zn from the Zn coating layer. The surfaces of these adhered materials were covered with Al-based oxides by subsequent sliding. The friction coefficient of the GI decreases because the interface changed from metal-to-metal contact, which is characterized by higher adhesiveness, to metal-to-oxide contact, which has lower adhesiveness, and at the same time, the formation of the adhered materials also has the effect of smoothing the tool surface, resulting in a smaller plowing force.
(4) The friction coefficient of the GI decreases as the sliding distance increases because these adhered materials are considered to form with increasing sliding distance.
(5) In the sliding test under condition A, the tendency of a decreasing friction coefficient is observed more clearly than under condition B. This difference is attributed to the fact that the entire tool surface can be covered with adhered materials due to the short tool length under condition A, whereas under condition B, the tool surface remains partially exposed due to the longer tool length. In this exposed region, the tool surface came into direct contact with the metallic Zn of the Zn coating layer, resulting in metal-to-metal contact, and at the same time, the tool surface is not smoothed by the formation of adhered materials. Thus, in comparison with condition A, the decreasing tendency of the friction coefficient is not observed clearly under the condition B.
References
- 1) H. Kawaguchi, A. Tanaka, S. Sudo and H. Nakano: Proc. 3rd Int. Conf. on Zinc and Zinc Alloy Coated Steel Sheet (GALVATECH ’95), ISS, Warrendale, PA, (1995), 605.
- 2) J. Iwatanai and M. Miyahara: Kobe Steel Eng. Rep., 41 (1991), 83.
- 3) M. Ejima: J. Jpn. Soc. Tribol., 36 (1991), 755.
- 4) H. Noro, Y. Kimura and K. Yanagai: JFE Tech. Rep., 13 (2006), 9.
- 5) G. R. Payen, E. Felder, M. Repoux and J. M. Mataigne: Wear, 276–277 (2012), 48.
- 6) H. Yamaguchi and Y. Hisamatsu: Tetsu-to-Hagané, 59 (1973), 131.
- 7) H. Nitto, T. Yamazaki, N. Morita, K. Yabe and S. Bandoo: Tetsu-to-Hagané, 70 (1984), 1719.
- 8) M. Dubois: Proc. 5th Int. Conf. on Zinc and Zinc Alloy Coated Steel Sheet (GALVATECH 2001), Verlag Stahleisen GmbH, Düsseldorf, (2001), 409.
- 9) K. Higai, Y. Yamasaki and T. Inazumi: Proc. 61st Japan Joint Conf. for the Technology of Plasticity, Vol. 61, The Japan Society for Technology of Plasticity (JSTP), Tokyo, (2011), 191.
- 10) K. Hoshino, K. Higai and S. Taira: JFE Tech. Rep., 18 (2013), 89.
- 11) Y. Yamasaki, A. Azushima and Y. Tokita: J. Jpn. Soc. Technol. Plast., 46 (2005), 957.
- 12) E. P. Bertin: Principles and Practice of X-ray Spectrometric Analysis, Plenum Press, New York - London, (1975), 113.
- 13) M. Nagoshi, T. Kawano and K. Sato: J. Surf. Finish. Soc. Jpn., 54 (2003), 31.
- 14) F. P. Bawden and D. Tabor: The Friction and Lubrication of Solids, Oxford University Press, London, (1950), 90, 145.
- 15) K. Hoshino, Y. Yamasaki, M. Nagoshi, W. Tanimoto, S. Taira and N. Yoshimi: J. Jpn. Soc. Technol. Plast., 56 (2015), 986.
- 16) K. Yamato: 138th and 139th Nishiyama Memorial Seminar, ISIJ, Tokyo, (1985), 15.
- 17) M. Nagoshi, W. Tanimoto, K. Higai, K. Hoshino, Y. Yamasaki and H. Kijima: ISIJ Int., 54 (2014), 2854.
- 18) D. Tabor: Proc. Roy. Soc. Lond., A251 (1959), No. 1266, 378.
;%0A%09%09%09newWindow.document.open();%0A%09%09%09newWindow.document.write('<img src=%22./Graphics/57_895_tbl_1.jpg%22>');%0A%09%09%09newWindow.document.close();%0A%09%09)