Abstract
Creep strain in SUS347HTB austenitic heat-resistant steel and Ni-based heat-resistant alloys was evaluated by electron backscattered diffraction (EBSD). Localized crystallographic misorientations in the crept samples were quantified by using misorientation indicators such as kernel average misorientation and grain reference orientation deviation. In most crept samples, the misorientation indicators increased with creep deformation. However, this trend was not observed for alloys with dense dispersions. We proposed a method to extract and evaluate data only near the grain boundary from the total EBSD data. For Ni-based alloys, the misorientation indicators tended to increase preferentially near grain boundaries. Conversely, there was no substantial difference between the misorientation indicators near grain boundaries and the intergranular region for SUS347HTB. Consequently, although it is necessary to limit the region for evaluating the misorientation indicators according to the dispersion density of the reinforcing phase in the materials, the misorientation indicators, such as kernel average misorientation or grain reference orientation deviation, are useful for evaluating the creep strain in face-centred cubic heat-resistant alloys.
1. Introduction
Face-centred cubic (fcc) heat-resistant steels and alloys are used as materials for thermal power plants. Because creep deformation occurs under practical conditions, it is necessary to evaluate the creep damage in such materials to ensure safe plant operation. To save time and money when performing creep damage evaluation, inspections using slightly destructive or non-destructive methods are required.1) Damage evaluation using microstructural observations can be performed by taking a small sample from actual components of the plant. When performing creep damage evaluation of equipment, quantitative evaluation of the progress of creep damage should be performed from as early a stage as possible. To detect creep damage, some methods have been proposed that use the correlation between creep damage and the volume fraction of voids2) or the width of martensitic lath grains in ferritic heat-resistant steels.3) For austenitic heat-resistant steels, damage evaluation based on precipitate changes4) has been proposed. However, these methods have not yet been implemented practically. Scanning electron microscopy with electron backscattered diffraction (SEM-EBSD) can perform measurements of the local crystallographic orientation in an area of several hundreds to thousands of square micrometres within a relatively short time. Therefore, SEM-EBSD can be used to evaluate the crystallographic orientation variation behaviour during creep statistically. Several studies have shown that there is a positive correlation between the crystallographic orientation change measured by SEM-EBSD and plastic strain in austenitic steels deformed by tensile tests.5,6,7) Yoda et al.8) and Kubushiro et al.9) estimated the crystallographic orientation change in a crept austenitic steel. They revealed that there are positive correlations between creep strain and crystallographic orientation change. A similar result was also reported for crept Hastelloy X by Takaku et al.10) In this study, we evaluated the creep strain in SUS347 austenitic heat-resistant steel and Ni-based heat-resistant alloys based on crystallographic orientation measurements using SEM-EBSD. We focused on the location of the orientation change behaviour near the grain boundaries and the effect of the dispersion state of the second phase particles on the crystallographic orientation change behaviour.
2. Experimental
The sample materials were SUS347HTB austenitic heat-resistant steel (referred to as SUS347) under Japanese industrial standards and under-development Ni-based heat-resistant alloys with three different chemical compositions Alloy-A (base alloy), Alloy-B (1.0 Ti alloy), and Alloy-C (2.0 Ti alloy). The chemical compositions of these materials are shown in Table 1. The solution treatment for SUS347 was carried out at 1200°C. The solution treatments for the Ni-based alloys were performed for 60 min, and the temperatures for Alloy-A (base alloy), Alloy-B (1.0 Ti alloy), and Alloy-C (2.0 Ti alloy) were 1000, 1050, and 1100°C, respectively. After solution treatment, the Ni-based alloys were aged at 750°C for 32 h. Creep tests of the materials continued until the specimen ruptured in air. The elongation of the gauge length for each creep specimen was measured, and the results were described using strain-time curves. We also prepared crept samples by interrupting the creep tests at predetermined times. Because the interrupted creep tests were conducted without measuring the strain, the creep strains for the interrupted specimens were assumed to be equal to their values at the corresponding times in the creep rupture tests. The creep test conditions were 700°C-90 MPa, 700°C-120 MPa, 750°C-90 MPa, and 750°C-115 MPa for SUS347 and 850°C-50 MPa for Ni-based alloys.
Table 1. Chemical composition of sample materials (mass%).
| Fe | C | Si | Mn | P | S | Cr | Ni | Nb |
|---|
| SUS347 | Bal. | 0.09 | 0.39 | 1.49 | 0.026 | 0.0005 | 18.25 | 11.44 | 0.87 |
| Ni | C | N | Cr | Mo | Ti | Al | Nb | B |
|---|
| Alloy-A | Bal. | 0.003 | 0.0014 | 20 | 3.0 | ― | 2.0 | 1.0 | 0.003 |
| Alloy-B | Bal. | 0.002 | 0.0060 | 20 | 3.0 | 1.0 | 2.0 | 1.0 | 0.003 |
| Alloy-C | Bal. | 0.003 | 0.0015 | 20 | 3.0 | 2.0 | 2.0 | 1.0 | 0.003 |
EBSD measurements of the crystallographic orientations were performed on the interrupted and ruptured samples with scanning electron microscopes (S3000H, Hitachi High-Tech; Ultra55, Carl Zeiss). Samples for microstructural observation were cut out from the deformed portion of the crept specimen, ground with emery paper, and polished with diamond slurry. The samples were etched using Vilella’s reagent, and then they were finished by polishing again using a 50 nm diameter colloidal silica suspension for more than 1 h.
The SEM-EBSD measurements were performed in 700 × 700 μm regions. The measurement interval of the EBSD measurement was 3 μm for SUS347 and 2 μm for the Ni-based alloys. The measurements were performed on three fields of view for SUS347 and on four fields of view for the Ni-based alloys. The data obtained from the EBSD measurements were analysed by using TSL OIM Analysis ver. 6. The orientation information at each measurement point was mapped in a grid pattern of a regular hexagon. In the orientation analysis, we used measurement points with confidence index (CI) values of 0.1 or more. The CI value represents the reliability of the orientation evaluation.
To evaluate the variation of the local orientation quantitatively, the misorientation indicators kernel average misorientation (KAM) and grain reference orientation deviation (GROD) provided in the analysis software were used. KAM is an average misorientation between the centre measurement point and the equidistant neighbouring measurement points; therefore, it represents local misorientation at each point of the grain. However, GROD is the misorientation between each measurement point and a reference point in the grain; therefore, it represents the localized deviation of the crystal orientation within each individual grain. These misorientation indicators, especially KAM, are sensitive to the measurement step size.11) Therefore, because the measurement step sizes are different for SUS347 and for Ni-based alloys, comparison of the absolute values of KAM or GROD between these two materials is inappropriate. To define individual crystal grains in TSL OIM Analysis, the grain tolerance was set as 5° and the minimum grain size was 2 points. KAM for each point was calculated from the misorientation within the first nearest kernel. GROD values for each point in the grain were calculated as the misorientation from the average orientation of the grain. The average values of KAM and GROD in each field of view were calculated and the standard deviations between each field of view were represented as error bars.
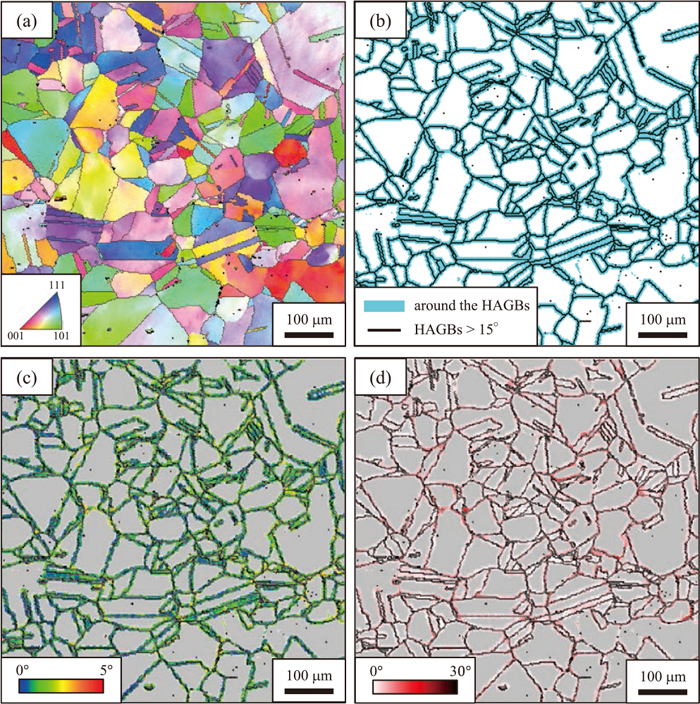
In this study, we focused on the KAM and GROD variations near the grain boundary by using our data extraction technique. The region near the grain boundaries was defined by using another KAM evaluation. For defining the region near the grain boundaries, the tolerance of the maximum misorientation of another KAM evaluation was set as 65°. Because the measurement points located a few steps from the grain boundary include some points located on an adjacent grain in their kernel, this leads to an extremely large KAM value being assigned to the measurement points near the grain boundaries. As a consequence, the measurement points with KAM values of 5° or more were distinguished as points around the high-angle grain boundaries (HAGBs) >15°. To unify the area around the HAGBs for materials with different EBSD measurement step size, when defining the area around the HAGBs, the KAM values for the second-nearest points were evaluated for SUS347 (step size: 3 μm), whereas the KAM values for the third-nearest points were evaluated for the Ni-based alloys (step size: 2 μm). The region within about 6 μm from the HAGBs was defined as the area around the HAGBs in the EBSD maps for all the materials.
The dispersion state of the precipitate particles was measured by using SEM secondary electron images. The grayscale SEM images were converted to black and white. Then, a number density and an average diameter of the precipitation phases were measured by image analysis software. From the number density and the average diameter, the average interparticle surface distance, λ, was calculated by12)
|
λ
¯
=1.25
N
-
1
2
-
d
¯
| (1) |
where
N is the number density and
d is the average diameter of the particle.
3. Results and Discussion
3.1. Creep Curves
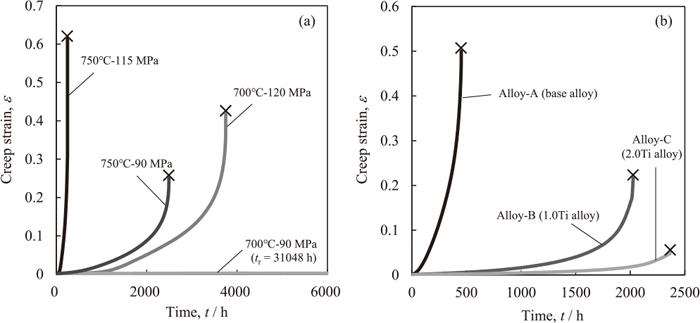
The creep test results of SUS347 and Ni-based alloys are shown in Fig. 1. Although the strain-time curve at 700°C-90 MPa was obtained for up to about 6000 h, the creep test continued until the specimen ruptured. The rupture time at 700°C-90 MPa was 31048 h and the rupture strain was 0.20. All of the creep curves show the acceleration creep stage followed by the transient creep stage.
3.2. Relationship between Creep Strain and KAM or GROD Value
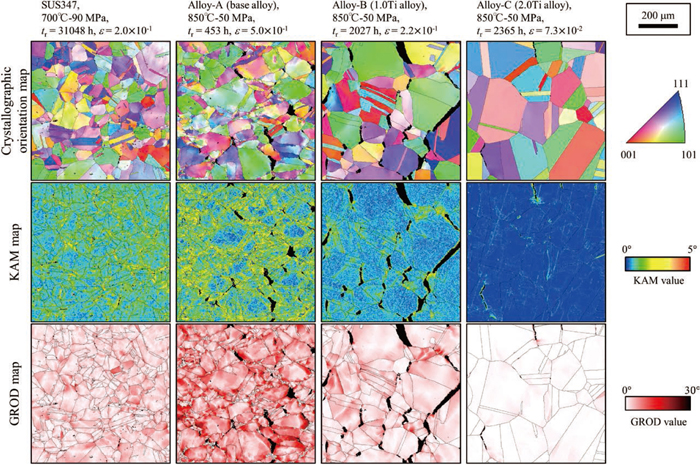
Crystallographic orientation maps, KAM maps, and GROD maps of the ruptured samples for SUS347 and the Ni-based alloys are shown in Fig. 2. The colours in the crystallographic orientation maps correspond to the crystal orientation of the standard stereo triangle shown in the figure. The colour displays of the KAM and GROD maps represent the magnitude of the value of each misorientation indicator, and the magnitude corresponds to the colour bar shown in the figure. The black regions in the EBSD maps indicate the cracks. During high temperature deformation, because the increase of the KAM and the GROD values corresponded to the density of geometrically necessary dislocations,9) the increase in these values in the crept samples indicated the formation of dislocation walls and sub-boundaries. The variations in the average KAM and GROD values obtained from fields of view with increasing creep strain are shown in Fig. 3. For SUS347 and Alloy-A (base alloy), KAM increased with increasing creep strain and the increase in KAM was similar for different creep conditions. However, the KAM value of Alloy-B (1.0 Ti alloy) and Alloy-C (2.0 Ti alloy) did not increase, even for the ruptured samples. The increase in GROD was similar to that of KAM. However, GROD of Alloy-B (1.0 Ti alloy) increased with increasing creep strain unlike KAM. However, for Alloy-C (2.0 Ti alloy), GROD did not increase, even in the ruptured sample.
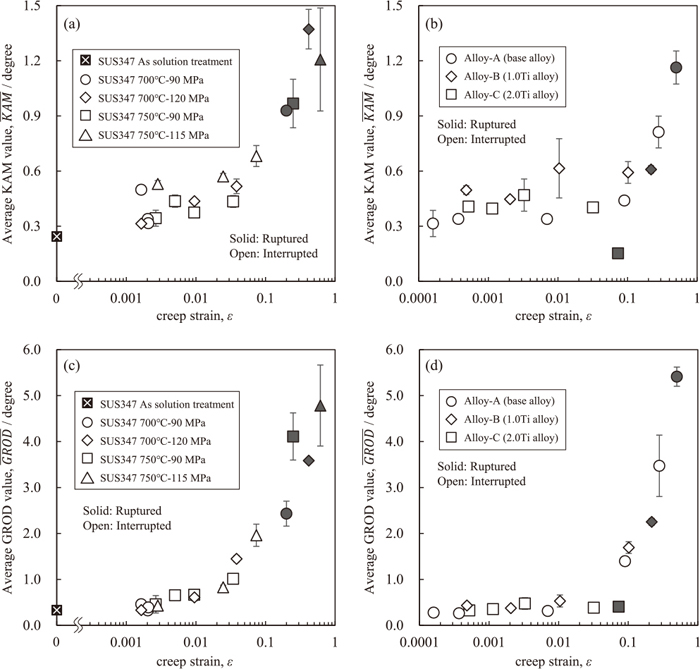
Comparing the sensitivities of these misorientation indicators with increasing creep strain, the rate of change of GROD was larger than that of KAM. KAM is an average value of the misorientation between an evaluation point and adjacent measurement points, whereas GROD indicates the misorientation between an evaluation point and the average orientation of each grain as a reference orientation. Therefore, if sub-boundaries are present in a grain, only the KAM values of measurement points close to the sub-boundaries will increase. However, for GROD, the average orientation of a grain is calculated as a reference, and the GROD values of each measurement point in the grain is given as an integrated value of the orientation change from the reference orientation. Therefore, GROD becomes a more sensitive misorientation indicator than KAM. Githinji et al.5) also reached a similar conclusion about the sensitivity of KAM and GROD as a function of the plastic strain. Because GROD evaluates misorientation across a long distance that corresponds to the grain size, the GROD value depends on the grain size. That is, the GROD value should be larger in larger grains. According to Fig. 2, the grain size of Alloy-C (2.0 Ti alloy) is larger than that of Alloy-A (base alloy), although it is comparable to that of Alloy-B (1.0 Ti alloy). However, the change of the GROD values in Alloy-C (2.0 Ti alloy) was the smallest among the test materials. Consequently, this result indicates that microstructures other than the grain size affect the GROD variation in Alloy-C (2.0 Ti alloy).
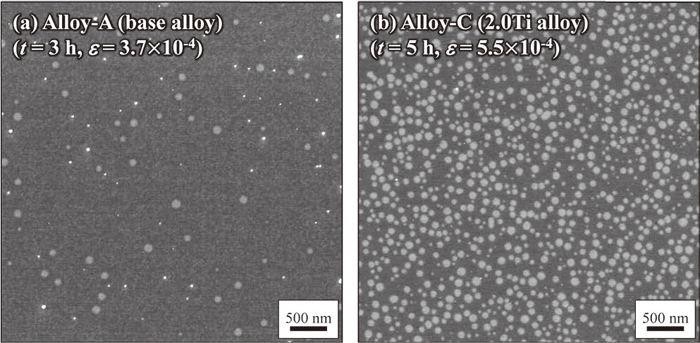
The misorientation indicators did not increase for Alloy-C (2.0 Ti alloy) because of its low rupture ductility. The present Ni-based alloys contain γ’ (Ni3(Al, Ti, Nb)) particles in the grain. According to a thermal equilibrium calculation, the γ’ phase includes Ni, Al, Ti, and Nb and the amount of γ’ phase precipitation depends on the amount of Ti in the present Ni-based alloys. SEM secondary electron images of the γ’ particles in (a) Alloy-A (base alloy) and (b) Alloy-C (2.0 Ti alloy) are shown in Fig. 4. The number densities and the area fraction of the γ’ particles, which are observed as light grey contrast, are obviously different for each alloy and they are higher in Alloy-C (2.0 Ti alloy) than Alloy-A (base alloy). From analysis of the images, the average interparticle surface distances were determined as 429 and 95 nm for Alloy-A (base alloy) and Alloy-C (2.0 Ti alloy), respectively. Therefore, Alloy-C (2.0 Ti alloy) ruptured with low ductility without forming dislocation walls and subgrains because the dislocation motion in the grain was prevented by the densely dispersed γ’ particles. This also explains why the KAM and the GROD values did not increase in Alloy-C (2.0 Ti alloy).
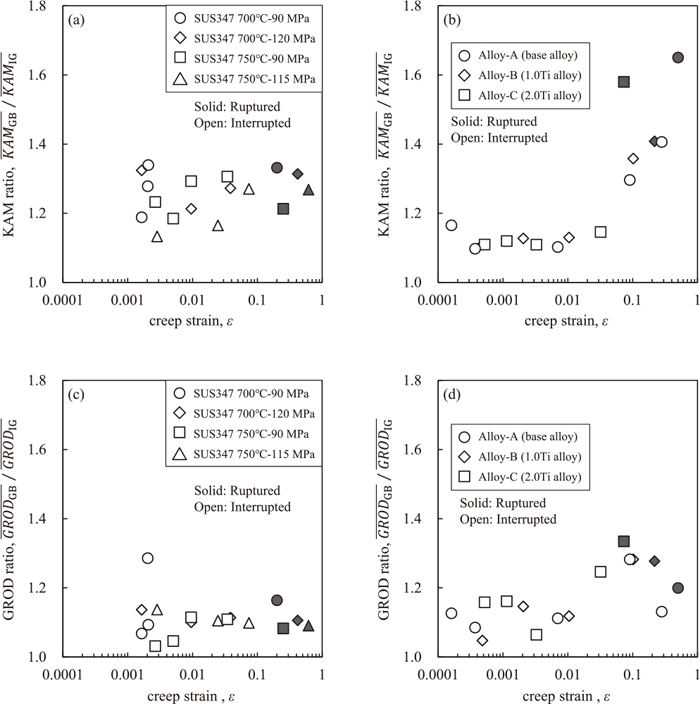
The KAM and GROD maps in Fig. 2 show that the increase of these misorientation indicators occurred heterogeneously in the crystal grains. Therefore, we focused on the area around the grain boundary as a special region in the microstructure. The grain boundary area was defined as the region within about 6 μm from HAGBs of >15°. The KAM and GROD values in the corresponding region were evaluated as shown in Fig. 5. The HAGBs are represented by black lines, and the evaluated region near grain boundaries is represented by the light blue region in Fig. 5(b). The region near the HAGBs was evaluated by using our technique, as described in the Experimental section. The ratios of the misorientation indicators evaluated from the vicinity of grain boundaries (
KA
M
GB
¯
and
GRO
D
GB
¯
) and from other intra-granular regions (
KA
M
IG
¯
and
GRO
D
IG
¯
) are shown in Fig. 6. For both misorientation indicators, the ratios become 1 or more. For the Ni-based alloys, although the KAM ratio in the low-strain region was about 1.1, it increased greatly in the high-strain region of ε > 0.03. Therefore, KAM increased preferentially near the grain boundaries in the Ni-based alloys during the acceleration creep stage. Furthermore, the KAM ratio in the ruptured sample (solid symbols in Fig. 6) of Alloy-C (2.0 Ti alloy), which showed no large change in KAM evaluated from fields of view in Fig. 3, clearly increased. However, the preferential increase of KAM near the grain boundaries was not observed for SUS347, because the KAM ratio remained unchanged at about 1.2 to 1.3 even in the ruptured samples. The GROD ratios in every material increased slightly. Therefore, the KAM ratio is more sensitive than the GROD ratio to the misorientation variation near the grain boundaries, especially for the Ni-based alloys. The overall KAM and GROD maps (Figs. 7(a) and 7(d)), the KAM and GROD maps around the HAGBs (Figs. 7(b) and 7(e)), and the KAM and GROD maps of the intra-granular region (Figs. 7(c) and 7(f)) were evaluated by the above method in the ruptured Alloy-C (2.0 Ti alloy) sample. For Alloy-C (2.0 Ti alloy), the increase in these misorientation indicators in the intra-granular region (Figs. 7(c) and 7(f)), were small even in the ruptured sample. However, a substantial increase in these indicators was observed only around the cracks generated on the HAGBs (Figs. 7(b) and 7(e)). As mentioned in Section 2, GROD represents the misorientation from the average orientation of each individual grain. This averaging process tends to reduce the magnitude of the increase in GROD near the cracks. However, KAM reflects the actual increase of the localized misorientation. Therefore, by limiting the evaluation target to near the HAGBs, large changes in the misorientation indicators can be detected and this method is more effective for evaluating KAM. Moreover, this limited evaluation of KAM is useful for materials like Alloy-C (2.0 Ti alloy), which ruptures with low ductility without forming dislocation walls and subgrains.

To maintain the continuity of the displacement between adjacent grains with different deformabilities, many slip systems other than those inside the grains are activated near grain boundaries. In addition, the formation of sub-boundaries or the recovery of dislocations occur faster than inside the grains13) because of the fast diffusion rate of atoms near grain boundaries. Furthermore, in the case of the grain boundary sliding that occurs during creep deformation, the creep strain is concentrated near the grain boundaries by a stress concentration.14) Therefore, the magnitude of preferential misorientation variation near the grain boundary is affected by the microstructure, such as the Schmid factor difference between adjacent grains, the grain boundary structure, the grain boundary segregation element, and the dispersion state of precipitates on grain boundaries. Because detailed observation of these microstructures was not conducted in this study, future research should identify the microstructural factor that dominates the preferential misorientation variation near the grain boundary. In addition, the size of the near the grain boundary where this the preferential misorientation variation occurs is expected to change depending on the microstructure of the materials and the creep test conditions. Therefore, the optimization of size of the near the grain boundary is also a necessary work in the future.
The observed difference in the microstructure corresponding to the magnitude of preferential misorientation variation near the grain boundary is the frequency of cracks on the grain boundaries after creep rupture. Many cracks, shown as black areas in the crystallographic orientation maps in Fig. 2, were observed on the grain boundaries in the Ni-based alloys, in which preferential misorientation variation near the grain boundary occurred. In contrast, for SUS347, there were very few cracks, even in the ruptured sample at 700°C-90 MPa. Therefore, the preferential misorientation variation near the grain boundary and the occurrence of cracks on the grain boundaries are related.
4. Conclusions
Creep strain evaluation methods for fcc heat-resistant alloys based on crystallographic orientation measurements using SEM-EBSD and the effect of the microstructure on the crystallographic orientation variation behaviour were investigated. Based on the results, the following conclusions were obtained.
(1) Misorientation indicators, such as KAM or GROD, are useful for evaluating the creep strain in fcc heat-resistant alloys. However, depending on the dispersion density of the reinforcing phase in the materials, it is necessary to limit the region for evaluating the misorientation indicators.
(2) KAM increased with increasing creep strain for all materials other than Alloy-B (1.0 Ti alloy) and Alloy-C (2.0 Ti alloy). Similarly, GROD increased with increasing creep strain for all materials other than Alloy-C (2.0 Ti alloy).
(3) GROD is more sensitive than KAM for determining the increase in the creep strain.
(4) Alloy-C (2.0 Ti alloy) ruptured without forming dislocation walls and subgrains because dislocation motion in the grain was prevented by the densely dispersed γ’ particles in the alloy.
(5) The crystallographic orientation data near grain boundaries was extracted by using our technique, which defines the region near HAGBs as the points with extremely large KAM values in the EBSD maps, and was used to detect the preferential variation of misorientation indicators in these region. The KAM ratio increased for the Ni-based alloys, whereas it did not for SUS347.
Acknowledgements
The main part of this study was carried out as part of the research activities of the “Fundamental Studies on Technologies for Steel Materials with Enhanced Strength and Functions” by the Consortium of JRCM (The Japan Research and Development Center of Metals), which is financially supported by the New Energy and Industrial Technology Development Organization (NEDO). Part of this work was carried out as research activities of the Advanced Low Carbon Technology Research and Development Program (ALCA). Financial support received from the Japan Science and Technology Agency (JST) is gratefully acknowledged.
References
- 1) R. Viswanathan: Damage Mecahisms and Life Assessment of High-temperature Components, ASM International, Metals Park, OH, (1995), 1.
- 2) S. Komazaki, T. Honda, T. Sakamura, K. Sawada, K. Kimura and Y. Kohno: Tetsu-to-Hagané, 96 (2010), 614.
- 3) K. Maruyama, K. Sawada and J. Koike: ISIJ Int., 41 (2001), 641.
- 4) H. Tanaka, F. Abe, K. Yagi and T. Sugita: Tetsu-to-Hagané, 84 (18), 303.
- 5) D. N. Githinji, S. M. Northover, P. J. Bouchard and M. A. Rist: Metall. Mater. Trans. A, 44A (2013), 4150.
- 6) M. Kamaya: Ultramicroscopy, 11 (2011), 1189.
- 7) M. Kamaya: Mater. Charact., 66 (2012), 56.
- 8) R. Yoda, T. Yokomaku and N. Tsuji: Mater. Charact., 61 (2010), 913.
- 9) K. Kubushiro, Y. Sakakibara and T. Ohtani: J. Soc. Mater. Sci. Jpn., 64 (2015), 106.
- 10) R. Takaku, D. Saito and Y. Yoshioka: J. Soc. Mater. Sci. Jpn., 58 (2009), 229.
- 11) S. I. Wright, M. M. Nowell and D. P. Field: Microsc. Microanal., 17 (2011), 316.
- 12) H. Nakashima and H. Yoshinaga: Tetsu-to-Hagané, 77 (1991), 1399.
- 13) R. Raj and M. Ashby: Metall. Trans., 2 (1971), 1113.
- 14) R. Gifkins: Metall. Trans. A, 7 (1976), 1225.