Abstract
The role of {112} slip activity on the deformation of bcc ferritic single crystals with different crystallographic orientations was studied numerically using a crystal plasticity finite-element method. Peeters model [Peeters et al., Acta Mater., 49 (2001), 1607] was utilized to predict development of dislocation structures as well as work-hardening behavior. To examine the effect of the {112} slip activity in detail, the simulation was carried out using original Peeters model in which development of cell-block boundaries (CBBs) along the {112} planes was not taken into account, Peeters model in which development of CBBs along the {112} planes was taken into account (extended-1 model), and Peeters model in which {112} slip activity was not taken into consideration (extended-2 model). The predicted stress-strain curves were in qualitatively good agreement with the experimental results for all cases when the original and extended-1 models were used, whereas two-stage work hardening observed for the crystal with {100} <011> was not predicted when the extended-2 model was used. Concerning development of CBBs, the extended-1 and extended-2 models gave better prediction as compared to the original model. The abovementioned results suggested that the extended-1 model gave the most appropriate predictions among the models in terms of work-hardening behavior and development of CBBs, showing that it was more reasonable to take into account both {110} and {112} slip systems and development of CBBs along not only the {110} planes but also the {112} planes.
1. Introduction
Crystal-plasticity models are a powerful tool to evaluate the relationship between mesoscopic crystalline and macroscopic deformations in metals, and are now being utilized widely for prediction of deformation behavior in various metals. The basic idea of crystal-plasticity analysis was established in the early 1980s.1,2,3) Since then crystal-plasticity models were often used for qualitative estimations such as prediction of texture evolutions2,4,5) and resultant developments of plastic anisotropy2,6) and plastic instability.1,3) On the other hand, owing to recent advances in numerical technique and computational power, crystal-plasticity models are recently employed also to quantitative prediction of work-hardening behavior such as stress-strain curves and contour of plastic work. So far, the deformation behavior in face-centered cubic (fcc)7,8) and hexagonal close-packed (hcp)9,10,11,12) materials is able to be predicted fairly well using crystal-plasticity models. In contrast, the prediction accuracy of deformation in body-centered cubic (bcc) metals is still poor as compared to fcc and hcp metals.13,14)
The reason of this poor prediction accuracy in bcc metals is that the deformation characteristics in a crystalline scale are not understood well; thus, crystal-plasticity models themselves should be improved significantly. Some of the important issues to be solved are described below. The {110} and {112} slip systems are generally taken into account in crystal-plasticity analyses of bcc metals. Sometimes only the {110} slip systems are taken into consideration15,16) or the {123} slip systems are also considered in addition to the above two systems.17) In general the critical resolved shear stresses (CRSS) for these slip systems are assumed to be the same.13,17,18) However, this assumption has not been validated,18,19) and there would rather be several reports against this assumption. For instance, Franciosi et al.20) conducted in-situ tensile and compression tests of iron single crystals and reported that CRSS for the {110} slip systems was approximately equal to that of the {112} slip systems loaded in the twinning direction and was smaller than that of the {112} slip systems loaded in the anti-twinning direction. In most cases the so-called Schmid law is utilized to model the slip activity in crystal-plasticity analyses, but it was reported that in some cases Schmid law did not hold in bcc metals, which is sometimes called non-Schmid law.21,22) Additionally, the latent hardening is still open to discussion although it has been investigated theoretically using discrete dislocation dynamics.23,24,25) Moreover, it is established that double cross slip is easy to occur in bcc metals, but it is hardly modeled in the framework of crystal-plasticity analyses. Among the abovementioned issues, the role of {110} and {112} slip systems on work-hardening behavior is focused on in the present study.
It is well known that non-uniform distributions of dislocations in crystals developed during plastic deformation are strongly related to macroscopic work-hardening. Keh26) investigated stress-strain curves and development of dislocation structure in iron single crystals under tension. It was found that, for crystals which favor single slip, the work-hardening behavior could be characterized by three stages, and that dislocation structure started to be developed in the early stage of deformation and was completed in the third stage. Yamashita and Taneda27) further studied the correlation between work-hardening and dislocation structure in iron single crystals. Hasegawa et al.28) observed a change in dislocation structure in polycrystalline aluminum upon reverse loading from tension to compression and found that cell walls generated during tension tended to collapse and new cell walls developed after the stress reversal. Moreover, they concluded that these changes in dislocation structure would be one of the origins of the Bauschinger effect observed after the stress reversal. Nesterova et al.29) examined microstructure evolution under different strain paths in an interstitial free steel sheet and reported that developed dislocation structures could be classified into six categories depending on strain path and crystallographic orientation. On the basis of the observed correlation between dislocation structure and work-hardening, Peeters et al.30,31) proposed a dislocation-based crystal plasticity model (Peeters model) in which the development of cell-block boundaries (CBBs) and its effect on work-hardening were formulated directly. This model enabled the accurate predictions of stress-strain curves and development of CBBs in a polycrystalline interstitial free steel sheet during various monotonic and two-stage strain paths.
Peeters and his co-workers assumed on the basis of their experimental observations that CBBs should develop parallel only to the {110} planes in their model. Because it is understood that CBBs in bcc crystals develop parallel to planes of highest slip activity,31,32) this observation indicates that the activity of the {112} slip systems would be intrinsically smaller than that of the {110} slip systems, and moreover, the effect of the {112} slip activity on the work-hardening is small. On the other hand, there are in fact some literatures that reported the development of CBBs parallel to the {112} planes.27,33,34,35) This result presents that the {112} slip activity would also affect the work-hardening as well as the {110} slip activity, inconsistent with the assumption introduced by Peeters and his co-workers. Apparently, the role of {112} slip activity is still open to discussion as mentioned earlier.
In the present study, the role of {112} slip activity on the deformation of bcc crystals was discussed in detail. Toward this end, two variations of Peeters model in which the treatment of slip activity and CBBs were altered were used to simulate deformation behavior of ferritic single crystals, and simulation results were compared with experimental results as well as those of the original Peeters model. The advantage of the present study is that slip activities, which are in general difficult to identify, are evaluated directly through a perspective of CBBs in both experiment and simulation; thus, the difference in the activities between the {110} and {112} slip systems can be discussed in detail.
2. Crystal Plasticity Finite-element Method
First the basic idea of Peeters model is described briefly. The reader is referred to the literature30) for details. In Peeters model, the dislocation substructure is assumed to consist of CBBs and cell boundaries (CBs). CBBs are formed along the most active slip systems and are associated with latent hardening mechanisms, whereas CBs develop randomly and are responsible for isotropic hardening in the material. The current strength of the α-slip system
τ
Y
α
is assumed to be given in the form
|
τ
Y
α
=
τ
0
+(1-f)
τ
CB
+f
τ
α
CBB
,
| (1) |
where
τ0 is the initial strength,
τCB is the slip resistance due to CBs,
τ
α
CBB
is the slip resistance raised by CBBs on the
α-slip system, and
f is the volume fraction of CBBs. As described earlier, CBBs are assumed to develop along only the {110} slip planes in original Peeters model.
τ
α
CBB
is given as a function of dislocation densities in the form36)
|
τ
α
CBB
=qμb
∑
β=1
Np
{
1-
(
m
α
⋅
u
β
)
2
ρ
β
wd
+⟨
s
α
⋅
u
β
sgn(
ρ
β
wp
)
|
ρ
β
wp
|
⟩
},
| (2) |
where
q is the dislocation interaction parameter,
b is the magnitude of the Burgers vector,
μ is the shear modulus,
Np is the number of slip planes,
sα denotes the unit vector of slip direction of
α-slip system,
mα and
uβ are the unit vectors normal respectively to the
α-slip plane and to CBBs of the
β-slip plane,
ρ
β
wd
is the density of immobile dislocations stored in CBBs of the
β-slip plane, and
ρ
β
wp
is the density of directionally movable dislocations stored at a side of CBBs of the
β-slip plane.
ρ
β
wd
and
ρ
β
wp
are responsible for latent hardening and an asymmetry of slip resistance, respectively. When the highest or second highest slip activity takes place on the
β-slip plane,
ρ
β
wd
and
ρ
β
wp
are assumed to evolve respectively in the form
|
ρ
˙
β
wd
=
1
b
(
ρ
β
wd
K
wd
-2y
c
wd
ρ
β
wd
)
Γ
˙
β
,
| (3) |
and
|
ρ
˙
β
wp
=
1
b
(
sgn(
ϕ
β
)
ρ
β
wd
+|
ρ
β
wp
|
K
wp
-2y
c
wp
ρ
β
wp
)
|
ϕ
β
|,
| (4) |
where
Kwd and
Kwp are the material parameters,
ycwd and
ycwp are the characteristic lengths associated with the annihilation process, and
Γ
˙
β
is the total slip rate on the
β-slip plane.
ϕβ is the net flux of dislocations from slip systems non-coplanar to the CBB of the
α-slip plane and is calculated as
|
ϕ
β
=
∑
κ=1
N
γ
˙
κ
s
κ
⋅
u
β
.
| (5) |
Due to a change in deformation path or a rotation of a crystal, new CBBs may develop and previously-developed CBBs may disintegrate. Therefore, when the highest or second highest slip activity does not take place and there are non-currently generated CBBs on the
β-slip plane, the disintegration of
ρ
β
wd
and
ρ
β
wp
are assumed to be respectively given in the form
|
ρ
˙
β
wd
=-
1
b
2y
c
ncg
ρ
β
wd
Γ
˙
new
,
| (6) |
and
|
ρ
˙
β
wp
=-
1
b
2y
c
ncg
ρ
β
wp
Γ
˙
new
,
| (7) |
where
ycncg is the recovery coefficient of non-currently generated CBBs and
Γ
˙
new
is the total slip rate on the two slip planes containing the highest slip activity.
τCB is given in the form
where
ρ is the statistically stored dislocation density in the cell interiors and CBs. Its evolution is given as
|
ρ
˙
=
1
b
⟨
(
ρ
K
-2ycρ-ψy
c
rev2
ρ
ρ
ba
2
ρ
sat
wp
)
∑
β
|
γ
˙
β
|
⟩,
| (9) |
where
K is the material parameter and
yc is the characteristic length associated with the annihilation of CBs.
ψ and
ρba are given as follows: When the net flux
ϕβ of the highest or second highest slip activity is reversed,
ψ = 1 and
ρba =
|
ρ
β
wp
|
. When the net fluxes
ϕβ and
ϕκ of both highest and second highest slip activities are reversed,
ψ = 1 and
ρ
ba
=|
ρ
β
wp
|+|
ρ
κ
wp
|
. If no flux is reversed,
ψ = 0.
ρ
sat
wp
is the saturation value of the directionally movable dislocations density, and
ycrev2 is the coefficient for the annihilation of CBs owing to the directionally movable dislocations.
The original Peeters model takes into account the activities of both {110} and {112} slip systems, but the model also assumes that CBBs develop only along the {110} slip planes. In the present study, the following two extended models were used as well as the original model to study the role of {112} slip activity on the deformation. In the first extended model, development of CBBs along the {112} slip planes was taken into consideration as well as that of the {110} slip planes. The evolution of CBBs along the {112} slip planes followed that of the {110} slip planes. In the following, this model is referred to as the extended-1 model. In the second extended model, the activity of the {112} slip systems was not taken into account, i.e., an extremely large critical resolved shear stress (CRSS) was assigned to the {112} slip systems. This model is referred to as the extended-2 model.
The original and extended models were implemented in our in-house crystal plasticity finite-element method program.9,10,12) Because the program is on the basis of the rate form of the principle of virtual work,37) Eqs. (1), (2), and (8) were utilized in their rate forms. Moreover, the program utilizes the rate-dependent crystal plasticity model, and the slip rate
γ
˙
α
is assumed to be given in the following form13)
|
γ
˙
α
γ
˙
0
={
0 if|
τ
α
|≤
τ
Y
α
(
|
τ
α
|-
τ
Y
α
τ
0
)
1
m
sign(
τ
α
)
if|
τ
α
|>
τ
Y
α
,
| (10) |
with
γ
˙
0
being the reference-strain rate and
m being the rate-sensitivity exponent.
τα=
mα·
σ·
sα is the resolved shear stress, where
σ is the Cauchy stress tensor.
3. Problem Formulation
Following the experiment conducted by Uenishi et al.,34,35) the deformation behaviors in bcc ferritic single crystals (mass%: 0.0017 C, 16.45 Cr, and 0.10 Ni) with different crystallographic orientations under simple shear were simulated using the original and extended Peeters models. We focus especially on the development of CBBs during simple shear.
Figure 1 shows the finite-element model utilized in the present study. An eight-node solid element with selective reduced integration was used. The x, y, and z directions were respectively defined to be the shear direction (SD), transverse direction (TD), and normal direction (ND). The following boundary conditions were given to the model to simulate the deformation behavior under simple shear: the displacements in the y and z directions were fixed on all eight nodes, the displacements in the x direction were fixed on the plane y = 0, and small displacement increments were given in the x direction on the plane y = 10.

Table 1 presents the crystallographic orientations34,35) tested in the present study. Isotropic elasticity was assumed: Young’s modulus and Poisson’s ratio were respectively set to be E = 206 GPa and ν = 0.3. The reference-strain rate and the rate-sensitivity parameter were respectively taken to be
γ
˙
0
= 0.002 s−1 and m = 0.02. Following the previous study,35) the material parameters used for the original model were determined so as to obtain a good fit in the shear stress-shear strain curve for the condition F (Table 1) between the experiment and the simulation. The determined parameters are displayed in Table 2. To simplify the problem, the material parameters shown in Table 2 were used for all the models. Moreover, the same parameters were assigned to the {110} and {112} slip systems when the original and extended-1 model were utilized. It should be noted that we cannot guarantee that this set of parameters is most appropriate because it is quite difficult to determine appropriately the large number of parameters simultaneously. Because the experimental results of microstructure observation using transmission electron microscope were provided for the conditions A, B, D, and E,34,35) the results of these four conditions are focused on in the following discussion.
Table 1. Crystallographic orientations tested in the present study.
| Test conditions | Normal direction | Shear direction |
|---|
| A {100}<011> | (001) | [110] |
| B {100}<001> | (001) | [010] |
| C {110}<557> | (110) | [557] |
| D {110}<112> | (110) | [112] |
| E {111}<112> | (111) | [1 12] |
| F {110}<001> | (110) | [001] |
Table 2. Hardening parameters used in the simulation.
| τ0/MPa | f | α | Kwd | ycwd/mm | Kwp | ycwp/mm | ycncg/mm | ycrev/mm | K | yc/mm | ycrev2/mm |
|---|
| 20.0 | 0.10 | 0.15 | 1.00 | 1.70×10⁻⁵ | 8.00 | 3.50×10⁻⁶ | 3.50×10⁻⁶ | 1.00×10⁻⁵ | 4.0 | 2.00×10⁻⁶ | 1.00×10⁻⁶ |
4. Results and Discussion
4.1. Shear Stress-shear Strain Curve
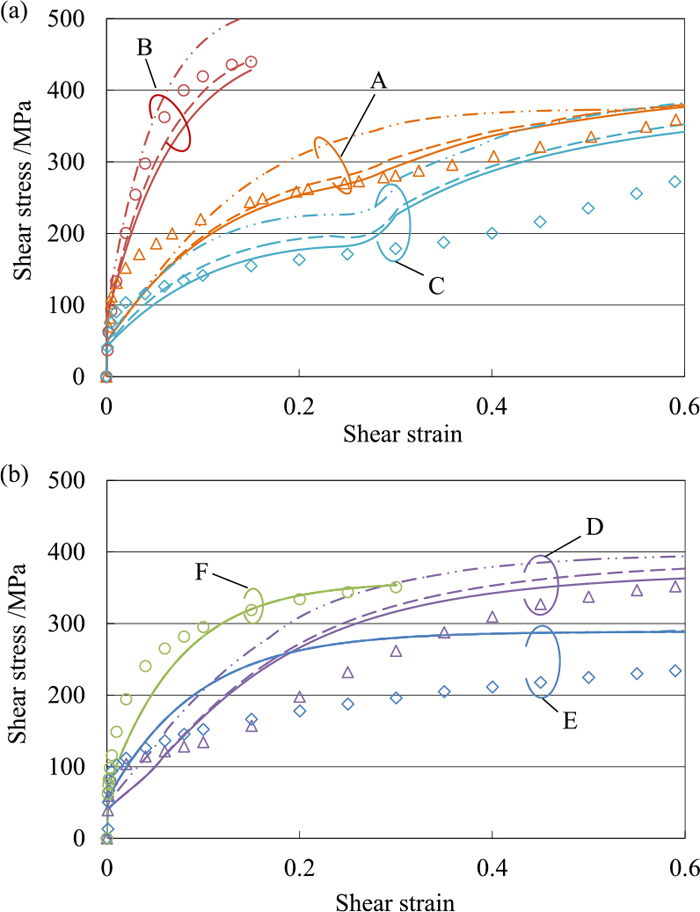
Figure 2 presents the shear stress-shear strain curves for the six conditions. The stress-strain curves are significantly different depending on the crystallographic orientations as explained in detail in the literature:34,35) The conditions B, E and F present parabolic work hardening, whereas the conditions A, C, and D show two-stage work hardening. The condition B exhibits the largest work hardening. The results of the original and extended-1 models predict the abovementioned work-hardening behaviors qualitatively well, and moreover, are quite similar to those of the crystal plasticity analysis using a phenomenological hardening model.35) In the case of the extended-2 model, on the other hand, the work-hardening behavior for the conditions B, C, D, E, and F are qualitatively in good agreement with those of the other models, whereas the two-stage work hardening hardly occurs for the condition A. Note that the onset of second stage of work hardening in the condition D occurs much earlier in all the simulation results than in the experimental result. Comparing the flow stresses among the models, the extended-2 model gives the largest flow stresses and the extended-1 model yields larger flow stress than the original model. This difference suggests that the effect of the CRSS for the {112} slip systems on the flow stress would be more pronounced than that of development of CBBs along the {112} slip systems. Note that the three models give almost the same curves for the conditions E and F; thus, only a single curve is visible respectively for the conditions E and F in Fig. 2.
Figures 3 and 4 display the transitions of the slip increments for the conditions A, B, D, and E obtained using respectively the extended-1 and extended-2 models. The results of the extended-1 model are as follows. In the condition A, (110)[111] and (110)[111] slip systems are active in the initial stage. These activities start decreasing at a strain of approximately 0.035, and simultaneously, (121)[111], (121)[111], and (211)[111] slip systems start to be active. After the activities of (110)[111] and (110)[111] slip systems vanish, (21 1)[111], (011)[111], (011)[111], and a little later (101)[111] slip systems start to be active. It is interesting that the onset of second stage of work hardening coincides with the sudden vanishing of (121)[111] and (121)[111] slip activities and the rapid increases in (011)[111] and (011)[111] slip activities. In the condition B, the activities of (112)[1 11], (1 12)[111], (112)[111], and (112)[111] slip systems are pronounced throughout the deformation. (011)[111] and (011)[111] slip systems are also active to a small extent. In the condition D, (1 12)[111] slip system is dominant in the initial stage, and then (110)[111] and (110)[111] slip systems start to be active at a strain of approximately 0.06. As in the case of the condition A, the onset of second stage of work hardening coincides with the rapid increases in (110)[111] and (110)[111] slip activities. In the condition E, the activities of (110)[111] and (110)[111] slip systems are dominant throughout the deformation. It should be noted that the slip activities obtained using the original model are qualitatively the same as those of the extended-1 model. It is also worth mentioning that the occurrence of two-stage work hardening in the conditions A and D would result from the sudden change in active slip systems. These results suggest that the deformation mechanism remains basically unchanged even when the development of CBBs along the {112} planes is taken into account.
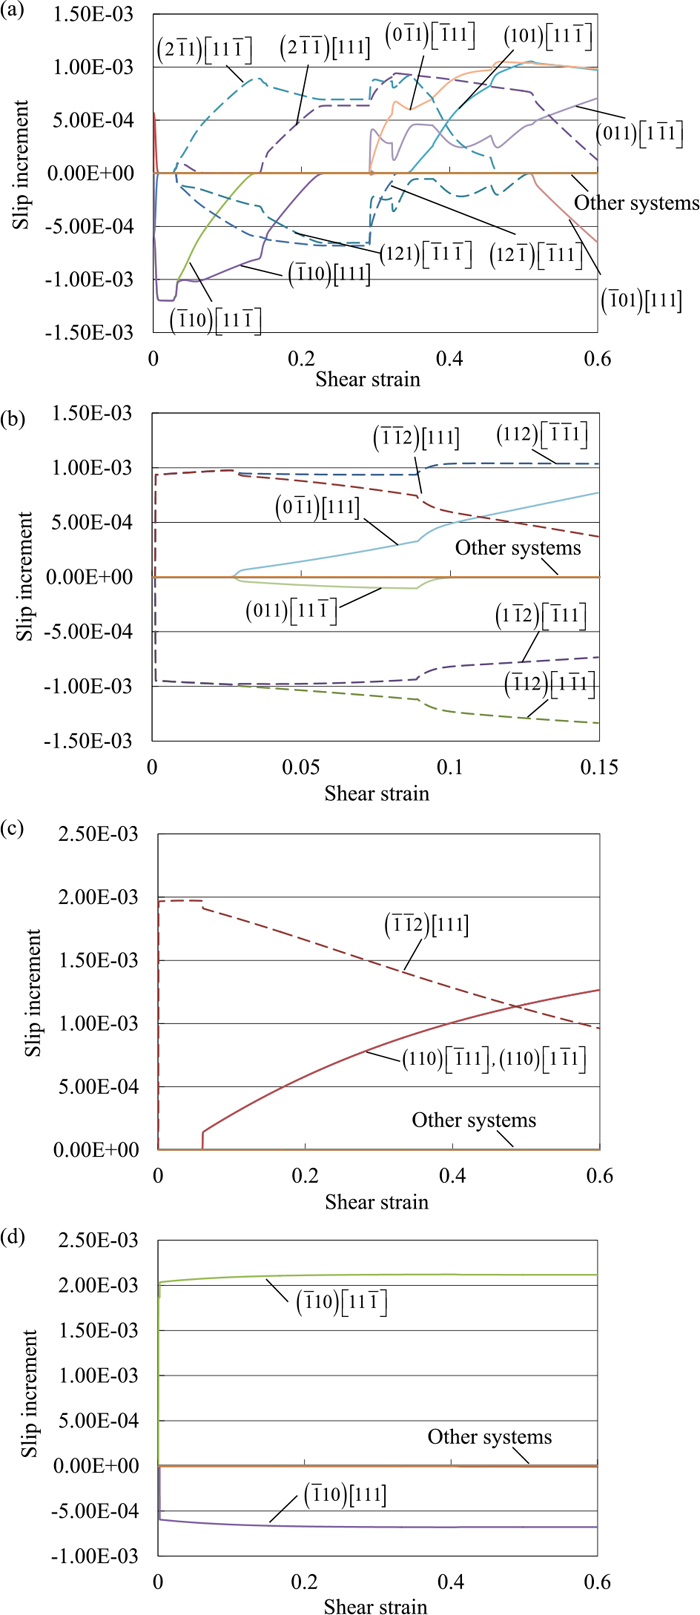
In the case of extended-2 model, the slip activities are largely different for the conditions A, B, and D from those of the extended-1 model. In the condition A, the active {110} slip systems are the same as those of the extended-1 model, but most of them start activating from the early stage of the deformation. It is interesting that the sudden change in active slip systems do not occur unlike the results of the extended-1 model; thus, the two-stage work hardening also does not arise. In the conditions B and D, the activities of the {112} slip systems observed for the extended-1 model are replaced by those of the {110} slip systems. The slip activities in the condition E are almost the same as those of the extended-1 model.
4.2. Microstructure Observation
Figure 5 shows the photographs of microstructure for the conditions of A, B, D, and E.34,35) The microstructures were observed on the ND plane. Figures 6, 7, and 8 present the evolution of dislocation density of immobile dislocations stored in CBBs, ρwd, during the deformation respectively for the original, extended-1, and extended-2 models.
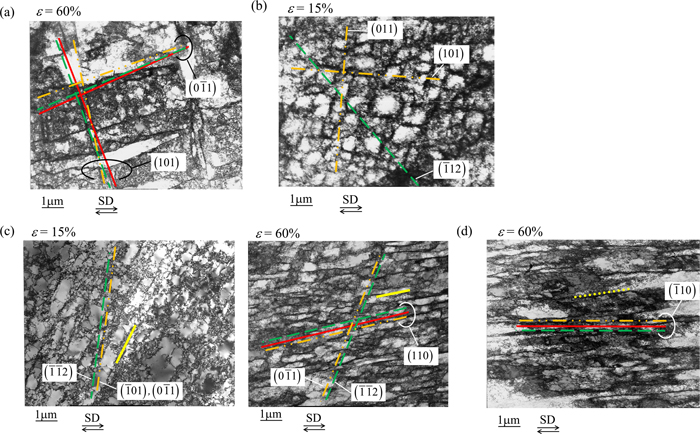

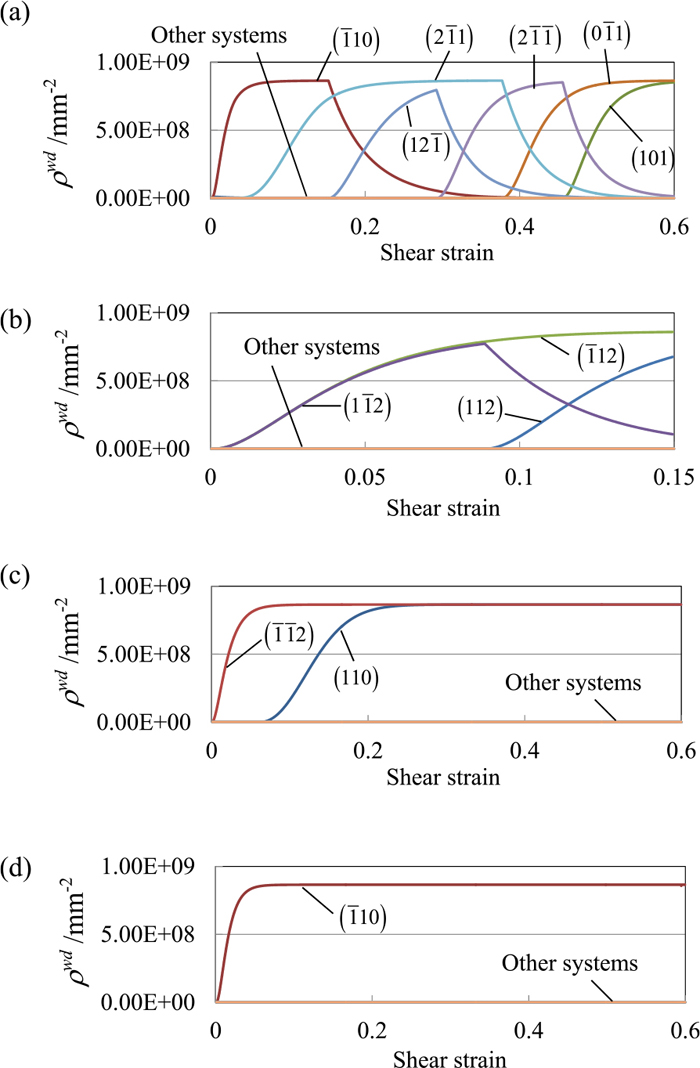
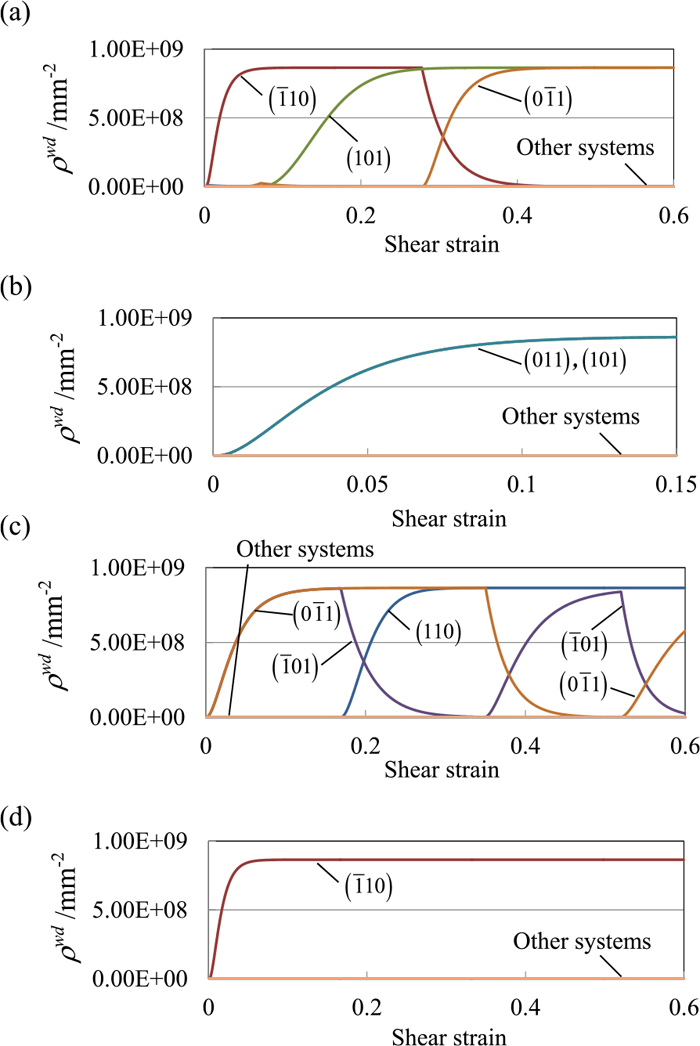
In the condition E (Fig. 5(d)), a set of CBBs is observed nearly along the shear direction (SD) at a strain of 60% in the experimental result. In the simulation, ρwd develops on the (110) plane (Figs. 6(d), 7(d), and 8(d)), on which the slip activity is the largest (Figs. 3(d) and 4(d)), from the beginning of deformation, and it is maintained until a strain of 60%. This tendency is independent of the model. Following Peeters et al.,30) this result suggests that CBBs develop parallel to the (110) plane at a strain of 60% in the simulation. To compare CBBs between the experiment and the simulation, the lines shown in Fig. 5(d) represent the (110) planes projected onto the ND plane obtained from the simulations. The three simulation results are almost identical, and moreover, are nearly parallel to CBBs in the experimental result, showing that the simulation results are in good agreement with the experimental result and thus CBBs in the experimental result would be along the (110) plane.
In the condition A (Fig. 5(a)), two sets of CBBs, one of which is nearly parallel to the SD and the other is almost perpendicular to the first set of CBBs, occur at a strain of 60% in the experimental result. In the simulation result of the original model (Fig. 6(a)), ρwd on the (110) plane develops initially, but it starts to decrease at a strain of approximately 30%. Alternatively, ρwd s on the (011) and (101) planes develop and this trend is kept until a strain of 60%. The (011) and (101) planes at a strain of 60% projected onto the ND plane are exhibited in Fig. 5(a). The two sets of CBBs predicted using the original model agree fairly well with those of the experiment. In the case of the extended-1 model, CBBs develop and disintegrate very often not only on the {110} planes but also on the {112} planes (Fig. 7(a)). However, the two sets of CBBs eventually remain on the (011) and (101) planes at a strain of 60%. As shown in Fig. 5(a), the projected lines of these two planes are almost identical to those of the original model. The results of the extended-2 model are similar to those of the original model in terms of both the evolution of ρwd s (Fig. 8(a)) and the projected lines (Fig. 5(a)). The abovementioned results suggest that the two sets of CBBs observed in the experiment would be along the (011) and (101) planes. It should be noted that the two CBBs develop after the second stage of work hardening arises in the original and extended-1 models.
In the condition D (Fig. 5(c)), the microstructure was observed in the experiment at strains of 15% and 60%, i.e., at the onset of second stage of work hardening and the end of the process, respectively. A set of CBBs develops nearly perpendicular to the SD at a strain of 15%, while another set of CBBs is also observed nearly along the SD at a strain of 60%. These results show that the first and second sets of CBBs developed during the first and second stages of work hardening, respectively.
In the case of the original model, ρwd on the (110) plane starts increasing at a strain of approximately 7% and it is maintained until the end of deformation. Because the onset of second stage of work hardening occurs at a strain of 5% in the simulation, it is reasonable to consider that CBBs do not develop at the onset of second stage of work hardening in this case. On the other hand, at a strain of 60%, the projected line of the (110) plane is in fairly good agreement with one of CBBs observed in the experimental result (Fig. 5(c)). The aforementioned result suggests that only one set of CBBs can be predicted in the original model.
In the case of the extended-1 model (Fig. 7(c)), ρwd on the (1 12) plane starts developing from the beginning of the process and fully develops at a strain of 5%. Moreover, ρwd on the (110) plane also starts developing at a strain of approximately 7%. ρwd s are maintained until the end of deformation. As shown in Fig. 5(c), the projected line of the (1 12) plane agrees fairly well with CBBs developed at a strain of 15% although the difference between the experimental CBBs and the predicted line seems to be larger than that of the other conditions. This difference would result from the difference in the amount of crystal rotation during the deformation between the experiment and the simulation and, moreover, would result in the difference in the onset of second stage of work hardening. On the other hand, the projected planes of (110) and (1 12) planes are in good agreement with the experimental result at a strain of 60%.
In the case of the extended-2 model (Fig. 8(c)), ρwd s increase on the (011) and (101) planes from the beginning of the process and then repeat decreasing and increasing. ρwd on the (110) plane also starts increasing at a strain of approximately 17% and is maintained until the end of deformation. Eventually ρwd s develop on the (011) and (110) planes at a strain of 60%. The projected lines of these planes shown in Fig. 5(c) are in fairly good agreement with the experimental results at strains of both 15% and 60%. These results show that the two extended models yield better prediction of CBBs as compared to the original model for the condition D, but the predicted plane is different between the extended-1 and extended-2 models.
Lastly, the results of the condition B are explained. Uenishi and his co-workers34,35) described that in the experimental result CBBs did not develop and only CBs could be observed at a strain of 15% as shown in Fig. 5(b). In the simulation result of the original model (Fig. 6(b)), the development of ρwd is quite small throughout the process, exhibiting that CBBs do not develop and this result is consistent with the experimental result. It should be noted that the slip activities are almost the same for the original and extended-1 models as described before, i.e., the slip systems on the {112} planes are active also for the original model, exhibiting that CBBs do not develop for the original model because development of CBBs along the {112} planes is not taken into account.
In contrast, ρwd s develop on two {112} and {110} planes respectively for the extended-1 (Fig. 7(b)) and extended-2 (Fig. 8(b)) models. As shown in Fig. 5(b), the projected lines apparently do not match any of the lines observed experimentally. Clearly, unlike the other conditions, inappropriate CBBs are predicted when the extended models are utilized for the condition B.
4.3. Discussion
As described in the previous sections, the overall results of stress-strain curves and development of CBBs are predicted fairly well by using the original and extended models. To the best of our knowledge, it was for the first time to predict development of CBBs in single crystals. Comparing the results among the models, the prediction accuracy of CBBs improves or remains unchanged for the conditions A, D, and E when the extended models are used, as compared to that of the original model. In contrast, the prediction accuracy for the condition B deteriorates when the extended models are used. In the following, the deformation mechanism and the role of the {112} slip systems are discussed on the basis of the difference in the simulation results among the models.
First the difference in the results between the extended-1 and extended-2 models is examined. As explained earlier, CBBs develop on the different planes for the condition D between the extended-1 and extended-2 models although both projected lines are in good agreement with the experimental result (Fig. 5(c)). Currently it is difficult to judge from these results which model is more reasonable because it is quite difficult to identify exactly on which plane CBBs develop experimentally. On the other hand, the two-stage work hardening in the stress–strain curve for the condition A is predicted well for the extended-1 model, whereas it hardly occurs for the extended-2 model (Fig. 2). This result indicates that the {112} slip activity (Fig. 3(a)) would play an important role in the two-stage work hardening in the condition A, suggesting that the {112} slip systems should be taken into consideration; thus, the extended-1 model may be more physically acceptable than the extended-2 model. From this point of view, it would rather be acceptable to consider that CBBs are along the (1 12) planes for the condition D.
Next, the reason that the prediction accuracy for the condition B deteriorates when the extended models are used is discussed. As explained earlier, Peeters model assumes that CBBs develop along the slip planes on which first or second highest slip activity takes place. This assumption is utilized in Peeters model probably because in most cases only one or two sets of CBBs develop at the same time experimentally.26,27,28,29,30,31,32,33,34,35) Rauch and Schmitt38) also reported that during simple shear of a polycrystalline mild steel sheet one set of CBBs developed in most of the grains. In fact, to the best of our knowledge, a case where three or larger sets of CBBs develop at the same time has not been reported. In contrast, this assumption might not be applicable for the condition B because four or more slip systems were active to the same degree from the beginning of the process (Figs. 3(b) and 4(b)) for this condition; thus, there are four planes on which the highest slip activity takes place. This result was independent of the model. These results suggest that it is physically not acceptable to select only two planes for CBBs candidates out of the four active planes.
Hence, to meet the experimental observation and to solve the inconsistency of the assumption for the condition B simultaneously, we put a new assumption: CBBs cannot develop if the highest slip activity takes place on three or larger planes at the same time. In other words, this assumption indicates that development of CBs is much more pronounced than that of CBBs in this case. This assumption was newly incorporated in the extended models, and the simulation was conducted again. As a result, ρwd does not increase, i.e., CBBs do not develop throughout the process, for the condition B, irrespective of the model, as we expected. Note that the development of CBBs for the other conditions remains unchanged even when the new assumption is taken into account, showing that the new assumption can be a leading hypothesis.
The determination of CRSS could also affect the prediction accuracy. As described in the introduction, it was reported that it would be rather reasonable to consider that CRSS was different between the {110} and {112} slip systems, although its detail is still open to discussion.18,19,20) Specifically, it was reported that CRSS might be larger for the {112} slip systems in the anti-twinning direction than for the {112} slip systems in the twinning direction and for the {110} slip systems.20) In contrast, as shown in Fig. 3(b), the {112} slip systems are active in both positive and negative directions for the condition B in the original and extended-1 models. This result suggests that CBBs can develop on planes with the slip activity in the positive direction even though the difference in CRSS is taken into account; thus, this would not be a factor in the present case.
The aforementioned discussion suggests that the effect of the number of planes with the highest slip activity might be the most realistic hypothesis. If the hypothesis really holds, the aforementioned results depict that only the extended-1 model can predict the development of CBBs and the stress-strain curves for all the conditions. This result exhibits that the extended-1 model gives the best prediction accuracy among the models utilized in the present study, i.e., it is more reasonable to take into account both {110} and {112} slip systems and development of CBBs along not only the {110} planes but also the {112} planes. The validity of this hypothesis will be further discussed in our future work.
It should be noted that the materials utilized were different depending on the literature: an interstitial free steel sheet was used in the studies by Peeters and his co-workers,30,31) whereas ferritic single crystals are assumed34,35) in the present study. This difference in materials could also affect development of CBBs along the {112} planes. In fact, iron or ferritic single crystals were utilized, i.e., interstitial free steel was not employed, in the previous studies which reported the development of CBBs along the {112} planes.27,33,34,35) These facts indicate that further study is necessary to examine the applicability of the abovementioned conclusions to other bcc materials including interstitial free steels.
5. Conclusion
The role of {112} slip activity on simple shear deformation of bcc ferritic single crystals with six different crystallographic orientations was studied using a crystal plasticity finite-element method. Peeters model was utilized to predict development of cell-block boundaries (CBBs) as well as work-hardening behavior. To examine difference in roles between the {110} and {112} slip activities, the results were compared between original Peeters model, Peeters model in which development of CBBs along the {112} planes was taken into account (extended-1 model), and Peeters model in which {112} slip activity was not taken into consideration (extended-2 model). The results obtained from this work are summarized as follows.
(1) The stress–strain curves obtained using the original and extended-1 models were in qualitatively good agreement with the experimental results. In contrast, the two-stage work hardening observed for the crystal with {100} <011> did not occur when the extended-2 model was used.
(2) When the original model was used, the development of CBBs was predicted well in the simulation for the crystals with {100}<011>, {100}<001>, and {111}<112>, whereas CBBs developed in the experiment could not properly be predicted for the crystal with {110}<112>. In contrast, when the extended-1 and extended-2 models were used, the simulation results agreed well with the experimental results for the crystals with {100}<011>, {110}<112>, and {111}<112>. On the other hand, for the crystal with {100}<001> in which CBBs did not develop in the experimental result, the extended models predicted development of non-existent CBBs.
(3) It was hypothesized that the following assumption in Peeters model was not applicable for the crystal with {100}<001>: CBBs develop on the slip planes on which first or second highest slip activity takes place. Therefore, the following assumption was newly put on the basis of the experimental observation: CBBs cannot develop if the highest slip activity takes place on three or larger planes at the same time. When the new assumption was utilized in the extended models, any CBBs did not develop for the crystal with {100}<001>, consistent with the experimental results.
(4) If the abovementioned hypothesis really holds, it was acceptable to consider that the extended-1 model gave the most appropriate predictions among the models in terms of work-hardening behavior and development of CBBs. This conclusion suggested that it was more reasonable to take into account not only {112} slip activity but also development of CBBs on the {112} planes. The validity of this hypothesis should be further discussed in our future work.
It should be noted that we cannot validate at the moment an applicability of the abovementioned results to other bcc materials including interstitial free steels because the difference in materials could affect development of CBBs. This will also be our future work.
Acknowledgements
This work was partially supported by JSPS KAKENHI Grant number 26289271, Quantum Basic Research Coordinated Development Program from the Ministry of Education, Culture, Sports, Science and Technology, Japan, and ISIJ research grant.
References
- 1) D. Pierce, R. J. Asaro and A. Needleman: Acta Metall., 31 (1983), 1951.
- 2) R. J. Asaro and A. Needleman: Acta Metall., 33 (1985), 923.
- 3) R. J. Asaro: Adv. Appl. Mech., 23 (1983), 1.
- 4) P. Van Houtte: Acta Metall., 26 (1978), No. 4, 591.
- 5) S. R. Kalidindi, C. A. Bronkhorst and L. Anand: J. Mech. Phys. Solids, 40 (1992), No. 3, 537.
- 6) H. Takahashi, H. Motohashi and S. Tsuchida: Int. J. Plast., 12 (1996), No. 7, 935.
- 7) K. Hashimoto, A. Yamanaka, J. Kawaguchi, T. Sakurai and T. Kuwabara: J. Jpn. Inst. Light Met., 65 (2015), No. 5, 196.
- 8) K. Yoshida, A. Ishii and Y. Tadano: Int. J. Plast., 53 (2014), 17.
- 9) T. Hama and H. Takuda: Int. J. Plast., 27 (2011), 1072.
- 10) T. Hama and H. Takuda: Comput. Mater. Sci., 51 (2012), 156.
- 11) D. Steglich, X. Tian, J. Bohlen and T. Kuwabara: Exp. Mech., 54 (2014), 1247.
- 12) T. Hama, Y. Tanaka, M. Uratani and H. Takuda: Int. J. Plast., 82 (2016), 283.
- 13) T. Hoc and S. Forest: Int. J. Plast., 17 (2001), 65.
- 14) K. Kitayama, T. Kobayashi, T. Uemori and F. Yoshida: Tetsu-to-Hagané, 97 (2011), 221.
- 15) C. R. Weinberger, C. C. Battaile, T. E. Buchheit and E. A. Holm: Int. J. Plast., 37 (2012), 16.
- 16) A. Patra, T. Zhu and D. L. McDowell: Int. J. Plast., 59 (2014), 1.
- 17) M. J. Serenelli, M. A. Bertinetti and J. W. Signorelli: Int. J. Mech. Sci., 52 (2010), 1723.
- 18) K. Kitayama, C. N. Tome, E. F. Rauch, J. J. Gracio and F. Barlat: Int. J. Plast., 46 (2013), 54.
- 19) T. Hama, R. Matsudai, Y. Kuchinomachi, H. Fujimoto and H. Takuda: ISIJ Int., 55 (2015), No. 5, 1067.
- 20) P. Franciosi, L. T. Le, G. Monnet, C. Kahloun and M.-H. Chavanne: Int. J. Plast., 65 (2015), 226.
- 21) W. A. Spitzig, R. J. Sober and O. Richmond: Acta Metall., 23 (1975), 885.
- 22) J. W. Christian: Metall. Mater. Trans. A, 14 (1983), No. 7, 1237.
- 23) R. Madec and L. P. Kubin: Proc. IUTAM Symp. on Mesoscopic Dynamics of Fracture Process and Materials Strength, Kluwer Academic Publishers, Netherlands, (2004), 69.
- 24) R. Madec and L. P. Kubin: Proc. 3rd Int. Conf. Computational Modeling and Simulation of Materials, Techna Group, Faenza, (2004), 671.
- 25) S. Queyreau, G. Monnet and B. Devincre: Int. J. Plast., 25 (2009), 361.
- 26) A. S. Keh: Philos. Mag., 12 (1965), 9.
- 27) T. Yamashita and Y. Taneda: Trans. Iron Steel Inst. Jpn., 10 (1970), 197.
- 28) T. Hasegawa, T. Yakou and S. Karashima: Mater. Sci. Eng., 20 (1975), 267.
- 29) E. V. Nesterova, B. Bacroix and C. Teodosiu: Mater. Sci. Eng. A, 309–310 (2001), 495.
- 30) B. Peeters, M. Seefeldt, C. Teodosiu, S. R. Kalidindi, P. van Houtte and E. Aernoudt: Acta Mater., 49 (2001), 1607.
- 31) B. Peeters, B. Bacroix, C. Teodosiu, P. van Houtte and E. Aernoudt: Acta Mater., 49 (2001), 1621.
- 32) E. F. Rauch: J. Mech. Behavior Mater., 4 (1992), No. 1, 81.
- 33) S. Ikeda: J. Phys. Soc. Jpn., 27 (1969), No. 6, 1564.
- 34) A. Uenishi, N. Sugiura, Y. Ikematsu, M. Sugiyama, E. Isogai and S. Hiwatashi: Proc. 2nd Int. Symp. on Steel Science, ISIJ, Tokyo, (2009), 57.
- 35) A. Uenishi, N. Sugiura, Y. Ikematsu, M. Sugiyama, E. Isogai and S. Hiwatashi: CAMP-ISIJ, 22 (2009), 1263.
- 36) P. Eyckens, A. V. Bael, J. Moerman, H. Vegter and P. V. Houtte: Procedia Eng., 81 (2014), 1318.
- 37) T. Hama, T. Nagata, C. Teodosiu, A. Makinouchi and H. Takuda: Int. J. Mech. Sci., 50 (2008), 175.
- 38) E. F. Rauch and J.-H. Schmitt: Mater. Sci. Eng. A, 113 (1989), 441.
