Abstract
The effects of nitride layer and microstructure on the Erichsen value of commercially pure titanium JIS-class1 sheets were evaluated after cold rolling followed by annealing at 700–860°C both in nitrogen gas and in vacuum in order to clarify the controlling factors independently.
Irrespective of the annealing methods, grain size increased with the increase in the annealing temperature; however, after the maximum grain size by annealing at 820°C, grain size decreased with the increase in the temperature, due to the retardation effect of grain growth by the presence of the β phase. The Erichsen value was confirmed to increase with the increase in grain size; however, even if grain size is the same, the titanium sheets annealed in the two phase (α+β) region exhibit inferior forming properties such as the Erichsen value, elongation and n-value than those annealed in the single α phase. The hard Fe rich region formed along α grain boundaries, which is originated from β to α phase transformation during cooling, is considered to impair the forming properties.
Furthermore, the Erichsen value was evidently improved by annealing in nitrogen gas due to the formation of the nitride layer, which contributes to lowering the friction coefficient. However, the thick nitride layer formed at temperatures higher than 840°C no longer has the beneficial effect, because the thick nitride layer tends to easily fracture leading to fine cracks in the sheet surface. Annealing the sheets in the temperature range of 810–830°C for 30 s in nitrogen gas was the optimum condition for the best press formability.
1. Introduction
As commercially pure titanium sheets (hereinafter simply referred to as titanium sheets) are light weight and have excellent corrosion resistance, they are widely used in plate-type heat exchangers, mugs and other cups, and the bodies of cameras and notebook computers.1,2) These products are made by cold press forming of annealed sheets of JIS Class 1 titanium with the best ductility among commercially pure titaniums. When titanium sheets are press formed, the active metal titanium readily adheres to press tools, resulting in the formation of surface defects on press-formed titanium sheet parts.3,4) Metal titanium has a higher coefficient of friction than other meatls.3,5,6,7,8) This is probably because its low rigidity (elastic modulus) increases the contact area with the mating surface,6) because the hexagonal close-packed (hcp) lattice constant c/a ratio is low and there are relatively many slip systems,7,8) because the thermal conductivity is low and accelerates the temperature rise of the contact interface (friction surface), and because the 3d orbital is filled with only two electrons and is essentially active. Methods of solving these problems have been developed such as forming titanium oxide films2,3,4,5,9,10) and titanium nitride films11,12,13,14,15) on the metal titanium surface to prevent contact between the metal titanium and the press tooling. Ion plating and high-temperature and long-time heat treatment in nitrogen gas are methods of forming titanium nitride on the titanium surface to improve wear resistance.16,17,18,19,20,21,22,23)
We developed titanium sheets that are softened and at the same time coated with a very lubricious nitride film by annealing cold-rolled titanium sheets in nitrogen gas. This nitride film reduces the friction coefficient of the new titanium sheets to about one-third of that of titanium sheets vacuum annealed and pickled.12,13,14,15) Press formability is strongly influenced by the surface properties of sheets to be press formed as well as by their mechanical properties such as strength, ductility and work hardening behavior. For this reason, changing the temperature of annealing in nitrogen gas not only changes the thickness and nitrogen concentration of the nitride layer formed on the titanium sheet surface, but also changes the microstructure (grain size and phase structure) governing the mechanical properties and affects the press formability of the titanium sheets. To improve the press formability of titanium sheets, it is necessary to control both the surface nitride layer and the internal microstructure within appropriate ranges.
This study aimed at independently clarifying the effects of the surface nitride layer and the microstructure of the press formability of titanium sheets and accordingly optimizing the surface nitride layer and microstructure. Cold-rolled JIS Class 1 commercially titanium sheets annealed in nitrogen gas by changing the annealing temperature and JIS Class 1 commercially titanium sheets annealed in vacuum were compared to separately evaluate the effects of the surface nitride layer and the microstructure (such as grain size) on press formability.
2. Experimental Methods
2.1. Material
JIS Class 1 commercially pure titanium was hot rolled, descaled, cold rolled on a Sendzimir mill to a thicknesses of 3.5 to 0.5 mm, and alkaline cleaned. The resultant cold-rolled sheets were used as starting materials. The chemical composition of the experimental material is shown in Table 1. Specimens measuring 100 mm × 200 mm were cut from the sheets, ultrasonically cleaned in acetone, and heat treated under the annealing conditions given below.
Table 1. Chemical compositions of commercially pure titanium used (mass%).
| Fe | O | C | N | H | Ti |
|---|
| 0.030 | 0.04 | 0.004 | 0.005 | 0.0030 | Bal. |
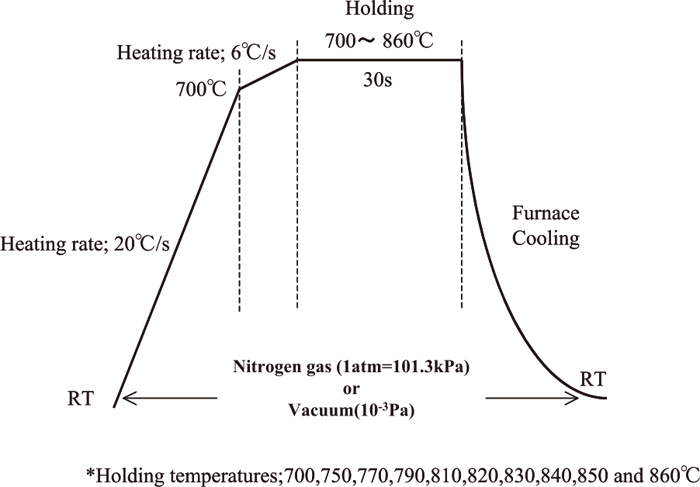
Figure 1 shows the annealing conditions (atmosphere, holding temperature and time, heat pattern). The specimens were annealed in an infrared heating furnace by holding them in 1 atm nitrogen gas or 1.3 × 10⁻³ Pa vacuum at 700 to 860°C for 30 sec. To investigate the effects of the surface nitride layer and microstructure in detail and optimize both, the annealing temperature was changed in 10°C increments as required. In the Ti–Fe binary phase diagram of Murray,24) 820 to 860°C at the high end of the annealing temperature range represent a two-phase temperature region where the β phase exists besides the α phase.
To prepare titanium sheets with an equivalent microstructure and without nitrided surfaces, the conditions of vacuum annealing with the same heat pattern as that of nitrogen gas annealing were added.
2.2. Microstructure Evaluation Methods
Specimens were cut longitudinally (parallel to the rolling direction) from the annealed titanium sheets, embedded in a resin, and etched in a mixed aqueous solution of nitric acid and fluoric acid. Their recrystallized microstructure was observed with an optical microscope. Also, their grain size was measured by the intercept method.
Specimens annealed in the α single-phase region and specimens annealed in the α–β two-phase region were selected. Their distribution of Fe, a β stabilizing element, was measured with a JOEL JXA-8800 electron probe microanalyzer (EPMA) at an electron beam accelerating voltage of 15 kV. The EPMA results indicated the enrichment of Fe at the grain boundaries in the 850°C annealed specimens. The concentration of Fe in the narrow grain boundary regions was measured with the JED-2300 energy dispersive X-ray analyzer (EDS) of a JOEL JSM-7001F Schottky field emission scanning electron microscope (FE-SEM). The EDS accelerating voltage was set at a low 7 kV to limit the electron beam intrusion region to a minute grain boundary region to the extent possible. The diffusion region of the incident electron beam in the metal titanium depends on the accelerating voltage and is about 1.1 μm and 0.4 μm, respectively, at 15 and 7 kV.
To compare the hardness of the Fe-enriched regions at the grain boundaries with that of the micro regions within the grains, the hardness of the respective regions was measured with an Omicron Nano Technology Japan Tribo Indenter. The indentation load of the indenter was divided by the area of the indenter contact region projected onto a horizontal surface to determine the hardness in GPa.
2.3. Surface Analysis Methods
The nitride layer formed on the surface by annealing in nitrogen gas was identified by thin-film X-ray diffractometry. Also, the nitrogen intrusion depth was evaluated by glow discharge optical emission spectrometry (GDS). Thin-film X-ray diffractometry was performed on a Rigaku RAD-3C X-ray diffractometer under the conditions of CuK α radiation, 40 kV tube voltage, 40 mA tube current, 0.2° driving slit, and 1° incident angle. The X-ray penetration depth is calculated to be about 0.42 μm from the X-ray intensity.
The GDS measurements were performed with a Jobin Yvon (France) JY5000RF-PSS spectrometer and under the conditions of 4 mm discharge range diameter, 300 sec analysis time and 0.25 sec sampling time. The specimens were sputtered in argon gas and analyzed for the concentration distribution in the depth direction. The sputtering rate was determined by measuring the depth of JIS Class 1 commercially pure titanium after 200 sec of sputtering.
2.4. Press Formability Evaluation Method
Nitrided titanium sheet surfaces are likely to harden and decrease in ductility. The press formability of titanium sheets with nitrided surface layers was evaluated by the Erichsen test that does not simulate deep drawing mainly influenced by sheet metal flow, but simulates stretch forming influenced by sheet surface lubricity as well as by sheet metal flow. The Erichsen test was performed under the conditions shown in Table 2 and the Erichsen value (cup fracture height) was measured. As shown in Table 2, a die and a punch, both made of the tool steel SKD11, and a water-soluble lubricant for press forming were used in the Erichsen test. Graphite grease is often used as a lubricant in the Erichsen test. Since graphite grease is high in viscosity and is rarely used for the industrial press forming of titanium sheets, a water-soluble lubricant of relatively low viscosity was used in the present study.
Table 2. Conditions of the Erichsen test.
| Dimension of test sheet | 0.5 mmt × 90 mm × 90 mm |
|---|
| Tools | Die : SKD11, 27 mm in internal diameter, R0.75 |
| Punch : SKD11, Spherical end with 20 mm in diameter |
B.H.F.
(Blank Holding Force) | 1 ton |
| Lubricant | Water soluble oil for press forming |
| (Concentration of water is 40% in this oil) |
| Kinematics viscosity : 57.4 mm2/s at 40°C |
| Density : 1.083 g/cm3 |
The surfaces of titanium sheet specimens after the Erichsen test were observed with a scanning electron microscope (SEM). The condition of lubrication with the tool (die) and the degree of surface microcracks near the fracture sites were evaluated.
2.5. Tensile Test Method
ASTM E8 subsize tensile test specimens were prepared with a 6.25 mm wide and 32 mm long parallel portion whose longitudinal direction (rolling direction) is the tension direction. They were tested with a gauge length of 25 mm and strain rate of 5.2 × 10⁻³ (1/s). This tension direction was selected because the fracture direction of all Erichsen test specimens was the longitudinal direction.
3. Experimental Results
3.1. Comparison of Microstructure and Surface Layer Structure after Annealing
Figure 2 shows the relationship between the annealing temperature and grain size.14) The grain size increases as the annealing temperature rises, reaches maximum at the annealing temperature of 810°C, and clearly decreases as the annealing temperature exceeds 830°C. The optical microstructures are equiaxed recrystallized structures as shown in Fig. 3. The annealing temperature being equal, the as-annealed grain sizes are almost the same between the nitrogen gas annealed specimens and the vacuum annealed specimens.
Next, the surface layers are described. When the specimens are annealed in vacuum, their surfaces are not colored but appear in the original silver. Vacuum annealing imparts a slightly dark gold color to their surfaces.
The thin-film X-ray diffraction patterns of the surface layers of the specimens annealed at 750, 810 and 850°C in nitrogen gas are shown in Figs. 4(a), 4(b) and 4(c). The thin-film X-ray diffraction pattern of the surface layer of the specimen annealed at 810°C in vacuum is shown in Fig. 4(d). As compared with the results of Fig. 4(d) of the specimen annealed in vacuum, the titanium nitrides Ti2N and TiN are formed on the surfaces of the specimens annealed in nitrogen gas as shown in Figs. 4(a), 4(b) and 4(c). As the annealing temperature increases, the diffraction peak of the metal Ti (α phase) weakens, and the diffraction peaks of the titanium nitrides Ti2N and TiN become predominant. That is, the titanium nitride layers thicken with increasing annealing temperature. The titanium nitrides are formed in this way on the surfaces of the specimens annealed in nitrogen gas and appear gold.20,21) It is thus conceivable that the above-mentioned surface color tone results from the titanium nitrides. With the vacuum annealed specimen (Fig. 4(d)), TiC peaks are detected in addition to the strong peaks of the metal Ti (α phase). This TiC results from the combination of the metal titanium with a high-carbon cold rolling oil during cold rolling before annealing and from the subsequent crystallization of carbon and titanium.25)

Figure 5 shows the GDS-measured nitrogen concentration distributions in the depth direction from the surface. When the specimens are annealed in nitrogen gas, the nitrogen concentration of the surface layer increases with increasing annealing temperature and reaches about 10 mass% after annealing at 810°C. This nitrogen concentration is 3.8 to 5 times higher than that of the specimen annealed in vacuum at 810°C and indicates the formation of a nitrogen-enriched layer about 1 μm deep. The nitrogen enriched in the outermost surface of the specimen annealed in vacuum at 810°C is considered to have come from the nitrogen containing components of the cold rolling oil deposited on the surface during annealing and from the air.
As discussed above, the annealing of the specimens in nitrogen gas was found to form a Ti2N and TiN titanium nitride layer on the outermost surface and a nitrogen-enriched α phase below that.
3.2. Press Formability (Erichsen Test Results)
Figure 6(a) shows the effect of the annealing temperature on the Erichsen value of the specimens annealed in nitrogen gas or vacuum and the relationship between the grain size and annealing temperature. The temperature regions where the microstructure consists of a single α phase or of two phases α and β as calculated by the Thermo-Calc software are shown along the horizontal axis. Figure 6(b) shows the relationship between the Erichsen value and the grain size of the specimens annealed in nitrogen gas or vacuum. When the specimens are annealed in nitrogen gas as marked by closed rhombuses (◆) in Fig. 6, the Erichsen value increases with increasing the annealing temperature, becomes maximum at 820°C, and rapidly decreases above 830°C. When the specimens are annealed in vacuum as marked by open circles (○), similar trends are indicated, or the Erichsen value becomes maximum at about 810°C and decreases thereafter. Figure 6(b) shows that the Erichsen value increases as the grain size increases and decreases as the grain size decreases. Regardless of the annealing temperature, the Erichsen value tends to be higher when the specimens are annealed in nitrogen gas than when the specimens are annealed in vacuum. All specimens cracked where they were stretched in the rolling direction (longitudinal direction). This agrees with the tendency generally observed with titanium sheets. In titanium composed of the hexagonal close-packed (hcp) α phase, deformation twins inhibit slip deformations and increase work hardenability.26,27) This is discussed in relation to the anisotropy resulting from texture and to the difference in the active twin system affected by the plastic deformation mode.28,29)

Figure 7 shows SEM micrographs of the specimen surfaces in contact with the die shoulder in the Erichsen test. Figures 7(a), 7(b) and 7(c) show the SEM micrographs of the specimens annealed at 750, 810 and 850°C in nitrogen gas, respectively. Figure 7(d) shows the SEM micrograph of the specimen annealed at 810°C in vacuum. An SEM-observed site on an Erichsen test specimen is shown circled on the right side of Fig. 7 for reference. The shoulder of the die is the area that is most strongly rubbed against the specimen surface. The difference in its surface can thus serve as an index of lubricity evaluation. In Fig. 7, the left-to-right direction (→ direction) is the direction in which the sheet metal flow occurs in the Erichsen test. Rubbing marks with the die shoulder are observed in each micrograph. These rubbing marks are more pronounced in the specimen annealed at 750°C in nitrogen gas (Fig. 7(a)) and in the specimen annealed at 810°C in vacuum (Fig. 7(d)). Raised portions are observed at the ends of the marks as indicated by white arrows. The rubbing marks are shallower in the specimens annealed at 810 and 850°C in nitrogen gas (Figs. 7(b) and 7(c)). This suggests that the lubricity between the die and specimen was relatively good in these cases.

Figure 8 shows SEM micrographs of the specimen surfaces near the fracture sites in the Erichsen test. The slope of the cup of the Erichsen test specimens was observed with the SEM as shown circled on the right side of Fig. 8. Since the top of the cup is constrained by the punch, this slope of the cup is the area that is stretched most in the specimen. In the Erichsen test, the specimens are stretched in the left-right direction as shown in Fig. 8 when locally observed. Figure 8 shows that microcracks are produced on the surface near the fracture site and become conspicuous as the annealing temperature in nitrogen gas increases from 750°C (Fig. 8(a)) through 810°C (Fig. 8(b)) to 850°C (Fig. 8(c)).

The specimen annealed at 810°C in vacuum (Fig. 8(d)) exhibits microcracks equivalent to those found on the specimen annealed at 850°C in nitrogen gas (Fig. 8(c)), but its Erichsen values are high as shown in Fig. 6. This is because the specimen annealed at 810°C in vacuum had an α microstructure of greater grain size. Consequently, the ductility and work hardening index (n value) are good, and the deformability is excellent despite the formation of microcracks on the surface.
4. Discussion
4.1. Effect of Microstructure
Commercially pure titanium increases in the ductility and work hardening index (n value) with increasing grain size and accordingly increases in the Erichsen value.26,30) Fukuda et al.30) report that increasing the annealing temperature (600, 700 and 800°C) increases the grain size by about 20, 40 and 70 μm, respectively, and increases the stretch forming height. The relationship between the grain size and Erichsen value is discussed next. Figure 6(b) shows that the Erichsen value increases as the grain size increases and decreases as the grain size decreases. From Fig. 6(a), it is evident that the α–β phase transformation affects the annealing temperature that produces the largest grain size. This change in grain size is discussed later. When the grain size below the annealing temperature of 810°C where the grain size becomes maximum is compared with that above the annealing temperature of 810°C (for example, a comparison is made between 750 and 850°C at both of which temperatures the grain size is about 25 μm), a peculiar phenomenon is confirmed that the Erichsen value exhibits the tendency of being lower at 850°C than at 750°C.
The longitudinal direction nominal stress-strain curves of the specimens annealed at 750 and 850°C in vacuum are shown in Fig. 9(a). The changes in the n value with the strain at strain increments of 5% are shown in Fig. 9(b). The grain size of the annealed specimens is equivalent at about 25 μm. The specimen annealed at the lower temperature of 750°C shows larger uniform and total elongations. As shown in Fig. 9(b), its n value tends to be high in a high strain region of 10% or more. The Erichsen test mainly involves stretch forming. Assuming no differences in lubrication properties, the Erichsen value increases with increasing elongation and n value. The Erichsen value is thus expected to increase with the 750°C annealed specimen. This assumption agrees with the results of Fig. 9. Figure 10 shows the fracture surfaces after the tensile test. Dimples smaller than the grain size or about 5 μm are formed in the 750°C annealed specimen (Fig. 10(a)). In the 850°C annealed specimen (Fig. 10(b)), the formation of large dimples of about 15 μm is also observed in many sites. The tensile properties and fracture surface morphology also suggest that the deformation behavior changes between the low and high ends of the annealing temperature range with the annealing temperature of about 810°C as the boundary.


With the specimen annealed at 750°C, an α phase temperature region, the dimple size cannot be uniquely explained by the grain size. Since it is suggested that the deformation behavior changes between the 750°C annealed specimen and the 850°C annealed specimen, the relation with the microstructure is discussed for the specimen annealed at the higher 850°C (α–β two-phase region). In the 850°C annealed specimen, the macroscopic reduction of area (RA) and thickness change measured at the fracture sites of the tensile test specimens were 76% and 68%, respectively. The microscopic dimple size changed to 15 μm by reference to the initial grain size of 25 μm. This size change translates into a 64% reduction of area and 40% reduction of size. The macroscopic reduction of area and reduction of size are larger but are approximately equal to the microscopic ones. From this, it is inferred that the hard Fe-enriched regions distributed in units equivalent to the grain size and formed at the α phase grain boundaries are involved in the ductile fracture of the specimens.
Increasing the annealing temperature facilitates the diffusion of Ti and increases the grain size. It was confirmed that grain growth is inhibited in a high-temperature region above 810°C (Figs. 2 and 9(a)). According to the Ti–Fe binary phase diagram,22) the microstructure of this experimental material at the iron (Fe) concentration of 0.03 mass% (0.026 at%) is single-phase α (hcp) and two-phase α–β (bcc) below and above about 820°C, respectively. It is thus considered that since the α and β phases compete above 820°C, the grain growth of the main α phase is retarded.31) The Fe concentrations on the cross sections of the annealed specimens were analyzed by the electron probe microanalyzer (EPMA) at a 15 kV accelerating voltage. The results are shown in Fig. 11. Fe is uniformly distributed in the specimens annealed at 750°C (a) and 810°C (b), respectively. In the specimens annealed at 840°C (c) and 850°C (d), respectively, where the β phase appears and inhibits the grain growth of the α phase, Fe is clearly enriched along the α phase grain boundaries. The sites where Fe, a β stabilizing element, is enriched are the β phase during annealing and are considered to have been α phase grain boundary corners, edges or faces. The β phase was thus considered to have inhibited the grain growth of the main α phase at the annealing temperatures of 840°C and 850°C. As shown in the thermal history of Fig. 1, the specimen is furnace cooled from the two-phase region to room temperature. The α phase grain boundaries exhibit the Fe-enriched β phase traces. That is, the 850 and 750°C annealed specimens are equivalent in the α phase grain size but are different in the presence or absence of the Fe-enriched regions. Figure 12(a) shows the Fe concentration distribution of the region including the Fe-enriched grain boundary as measured by the EDS at a 7 kV accelerating voltage. The accelerating voltage was set to less than a half of that of the EPMA (Fig. 11) to restrict the electron beam spread and measure the Fe concentration. Fe is linearly distributed within the rectangle shown at the center of Fig. 12(a). The EDS characteristic X-ray intensity profiles of Ti and Fe are shown above and below the line. The Fe is enriched in the region measuring about 0.5 μm in width and appearing white at the center. Some of the sites where the Fe concentration was point analyzed by the EDS are indicated by arrows on the backscattered electron images of Figs. 12(b), 12(c) and 12(d). Comparison of the EDS quantitative analysis values (five-point average values) showed that the Fe concentration of the Fe-enriched grain boundaries is about 6.6 times higher than the Fe concentration within the grains. Since the intragranular Fe concentration is about 0.026 mass% according to the EPMA results, the Fe concentration of the Fe-enriched grain boundary regions is estimated to be 6.6 times higher or about 0.17 mass%. This concentration was about double the EPMA-measured Fe concentrations shown in Fig. 11. The differences in the concentration of O, a ligher and trace element, could not be confirmed with the EPMA and EDS.


Figure 13 shows the intergranular and intragranular hardness distributions of the longitudinal specimens annealed at 750°C (a) and 850°C (b). The appearance photographs of indentations after the hardness measurement are also shown. In the 750°C annealed specimen where Fe is uniformly distributed (a), the average intergranular and intragranular hardnesses are equivalent at about 1.2 GPa. In the 850°C annealed specimen (b), the average hardness of the grain boundaries where Fe is enriched is about 1.45 GPa and is about 20% higher than the average intragranular hardness. When considered together with the analysis results of the Fe concentration distributions, the specimen annealed at 850°C, a two-phase region temperature, is characteristic in that the hard, Fe-enriched regions are distributed along the α phase grain boundaries.

If we assume that solute strengthening by Fe in the 850°C annealed specimen is responsible for about 20% higher hardness of the intergranular Fe-enriched regions as compared with the intragranular hardness, we can estimate the Fe concentration in the Fe-enriched regions at about 0.13 to 0.23 mass% by using the relationship between the Fe concentration in titanium and the Brinell hardness increase32,33) and the relationship between the Fe concentration in titanium and the Vickers hardness increase.34) The Brinell hardness and Vickers hardness of JIS Class 1 commercially pure titanium are about 90 and 100, respectively. The above-mentioned Fe concentration agrees well with the EDS-measured Fe concentration in the Fe-enriched regions or about 0.17 mass%. The hardness increases in the intergranular Fe-enriched regions are thus considered to be quantitatively reasonable.
Analysis of the microstructures of the above-mentioned 750 and 850°C annealed specimens suggests that the Erichsen value and tensile properties change with whether or not the hard high-Fe regions are formed along the grain boundaries. Namely, the presence of the hard high-Fe regions distributed along the grain boundaries is considered to affect the decrease in ductility, increase in fracture surface units and decrease in the Erichsen value.
Fukuda et al.30) adjusted the grain size of titanium sheets by annealing them in an α single-phase temperature region below about 800°C. The absence of local Fe-enriched regions allowed the authors to simply arrange the Erichsen values by the grain size. We thought that if the annealing temperature range was expanded to a higher two-phase region, the Erichsen values would differ between titanium sheets of equivalent grain size but annealed at the low and high ends of the temperature range and that the Fe-enriched regions formed at the high end of the temperature range caused these differences in the Erichsen values.
Thermo-Calc analysis was conducted to study the volume fractions of the α and β phases and the distributions of O and Fe in the titanium sheets annealed in the two-phase region. The database used is the Thermodynamic database Ti-DATA (version 3). Calculations were performed on the initial composition of Ti-0.03 Fe-0.04O mass% shown in Table 1. Figure 14 shows the effects of temperature on the volume fraction of the β phase (a) and the concentrations of Fe and O in the α and β phases in thermal equilibrium. The microstructure consists only of the α phase at the low end of the temperature range. At and above 820°C, the microstructure is composed of both the α and β phases. That is, the volume fraction of the β phase starts to increase at 820°C and rapidly increases above 850°C. Consequently, Fe, a β stabilizing element, is enriched in the β phase and the concentration of O, an α stabilizing element, is reduced in the β phase as shown in Fig. 14(b).

The Erichsen value decreases with increasing O concentration.30,35) Figure 14 shows that the O concentration in the main α phase is practically the same at 0.040 mass% between the specimens annealed at 750 and 850°C. This agrees with the results of Fig. 13 that show that there is no difference in intragranular hardness between the specimens annealed at 750 and 850°C. The Fe concentration is 0.03 mass% in the specimen annealed at 750°C and composed only of the α phase. In the specimen annealed at 850°C in thermal equilibrium, the β phase is present with a volume fraction of 1.1%. The specimen is calculated to contain 1.59 mass% Fe. The 1.59 mass% Fe concentration in the β phase is nearly equivalent to the Fe concentration of about 2 mass%, which can be read from the T–Fe binary phase diagram.24) The Fe concentration in the β phase of the specimen annealed at 850°C is calculated to be 1.59 mass% from the phase diagram. This is different from the EDS-measured Fe concentration of 0.17 mass% in the Fe-enriched regions at the α phase grain boundaries. This difference may be ascribed to thermal equilibrium state deviations resulting from the diffusion of solute elements (Fe, O, etc.) on furnace cooling from the two-phase temperature region and from the short two-phase region annealing time of 30 sec.
The hard Fe-enriched regions formed at the α phase grain boundaries are clearly contrasted as evident from the backscattered electron images shown in Fig. 12. This points to the possibility of second phase formation. The Fe-enriched phase may be considered as the hcp transformed α phase, hcp martensite α’ phase, orthorhombic martensite α” phase, or β phase, going from low to high Fe concentrations. We tried to clarify the phase structure with electron backscattering diffraction (EBSD), but could not obtain any information other than hcp and could not reach clear conclusions. The Fe-enriched phase could not be clearly identified either with X-ray diffraction performed under a 0.02°step and a low 0.2°/min scan speed. The details are left for future research. The Fe-enriched α phase was assumed to be the Fe-enriched phase and its hardness was studied here.
Komatsu et al.36) confirmed that a Ti–Fe alloy with an Fe concentration of 2 mass% transforms to a hard α’ phase when water is quenched from the β single-phase region. There is a report37) that the α” phase is not formed in this case. Since the β phase has a much lower Fe concentration than that of the 2 mass% Fe α’ phase confirmed by Komatsu et al., Fe mostly diffuses in the β phase on cooling after annealing and the β phase transforms to the α phase. Some of the β phase might transform to α’ martensite.
The Fe-enriched phase is higher in the Fe concentration than the main α phase and is consequently hard. It is distributed like a net along the β phase grain boundaries. It is thus considered to act as a barrier of high dislocation mobility or sites for void formation during plastic deformation. Large dimples in units of about 15 μm and observed on the fracture surfaces of the tensile test specimens (Fig. 10(b)) suggest the occurrence of discontinuity of deformation in units close to the size of grains surrounded by Fe-enriched grain boundaries.
4.2. Effect of Surface Nitride Layer
The surface nitride layer is effective in increasing lubricity and facilitating metal flow However, it is hard, low in deformability and likely to induce cracking. The hardness of the titanium nitride layer is high at about HV700 to 2000.19,21)
The specimens annealed in nitrogen gas improved in the Erichsen value as compared with the specimens annealed in vacuum, regardless of the annealing temperature. This finding confirms the lubrication effect of the surface nitride layer.12,13,14,15) As the annealing temperature increases, the thickness of the surface titanium nitride layer increases (Figs. 4 and 5). The difference in the Erichsen value between the specimens annealed in nitrogen gas and the specimens annealed in vacuum increases in the annealing temperature range of 810 to 830°C. This difference rapidly decreases at higher annealing temperatures (Fig. 6). This result shows that the surface nitride layer formed by holding in nitrogen gas at 810 to 830°C for 30 sec provides the best balance of lubricity and formability when press forming the 0.5 mm thick titanium sheets.
When the annealing temperature is below the 810–830°C range of annealing in nitrogen gas, the surface nitride layer is low in the nitrogen concentration and the titanium nitride layer is thin. Plastic deformation easily exposes the metal titanium and brings it into direct contact with the press forming tool. The lubrication effect is consequently diminished. This agrees with the fact that strong rubbing marks are formed on the Erichsen test specimens.
When the annealing temperature exceeds the previously-mentioned temperature range, the titanium nitride layer is thickened. It is thus difficult to think that the lubrication effect decreased. The solubility limit of nitrogen in the α phase in the annealing temperature range studied is about 4 mass%.38) Nitrogen more than the solubility limit is assumed to form the titanium nitride layer. Based on this assumption and from in-depth distribution of the nitrogen concentration in Fig. 5, the thickness of the titanium nitride layer is found to be about 0.2, 0.25 and 0.3 μm at 750, 810 and 850°C, respectively. That is, the titanium nitride layer thickens with increasing annealing temperature. Furuya et al.17) heat treated titanium sheets in nitrogen gas at 700 to 1000°C and analyzed the surfaces of the titanium sheets. The titanium nitride formed at 700°C is Ti2N. As the heat treatment temperature increases, the TiN content increases and the surface and subsurface hardnesses correspondingly increase. In other words, the higher the TiN content, the higher the hardness. As shown in Figs. 4 and 5, the TiN content increases with increasing annealing temperature. At the high end of the annealing temperature range, the titanium nitride layer is estimated to consist of hard and brittle TiN. Figure 15 schematically illustrates the change in the specimen surface nitride layer with the annealing temperature when the specimens are annealed in nitrogen gas. TiN, Ti2N and α titanium with a high dissolved nitrogen concentration are formed from the high-nitrogen specimen surface downward. As the annealing temperature increases, nitrogen diffuses inward. The surface layer structure changes from the low end (the left of Fig. 15) to the high end (the right of Fig. 15) of the temperature range as shown in Fig. 15. The nitrogen concentration increases and the outermost surface TiN layer thickens. Annealing at higher temperatures increases the ratio of hard TiN in the subsurface nitride layer. We inferred that a hard and thick titanium nitride layer was formed at the high end of the annealing temperature range. As a result, surface microcracks deepened in the deformed regions, deformation was concentrated in the microcrack regions (Fig. 8), and the Erichsen value decreased.

The roles of the microstructure and surface nitride layer of titanium sheets in press formability are discussed here. In press forming, mainly comprising stretch forming like in the Erichsen test, the contact area between the punch and sheet increases in the initial stage while the sheet metal flows in from the flange below the blankholder. Lubricity is thus predominant. With the progress of forming, the contact between the blankholder (die) and tool (punch) increases the force of constraining the sheet and the sheet metal flow is mostly restrained. For this reason, the mechanical properties (mainly the n value and ductility) that govern plastic deformability become predominant. In this way, the proportions of the effects of lubricity and the mechanical properties change with the process and region of press forming.
The microstructure determines the mechanical properties of the titanium sheets if their chemical composition is the same and hence governs the deformability of the metal titanium. The specimens annealed in vacuum have a higher coefficient of friction (lower lubricity) than the specimens annealed in nitrogen gas. The sheet metal flow is restricted and is mainly affected by the mechanical properties. This result is considered to appear in the behavior of the Erichsen value (Figs. 6, etc.). A microstructure without hard Fe-enriched sites of large grain size is high in the n value and ductility and is advantageous for press forming.
The surface nitride layer formed by annealing in nitrogen gas is high in lubricity and serves to weaken the constraint of the metal flow from the sheet below the blankholder. This is reflected in the increase in the Erichsen value of the specimens annealed in vacuum as shown in Fig. 6. When the sheet metal flow is practically constrained, the deformation (elongation) of the non-constrained region governs formability. The nitrogen-enriched surface nitride layer is hard and low in deformability, and serves against formability.
Under the conditions of forming in which the sheet is mostly constrained and of high lubrication, the effects of the microstructure governing the mechanical properties favorably act. Under the conditions in which the sheet is relatively unconstrained, the surface nitride layer that increases lubricity is considered to work favorably.
5. Conclusions
To independently clarify the effects of the surface nitride layer and microstructure on the press formability of titanium sheets, we annealed cold-rolled JIS Class 1 commercially pure titanium sheets in nitrogen gas and vacuum. The effect of the Erichsen value when the annealing temperature was changed between 700 and 860°C was analyzed in two aspects of the microstructure and surface nitride layer. As a result, the following conclusions were obtained:
(1) The grain size increases as the annealing temperature rises, reaches maximum at an annealing temperature of 810°C, and decreases as the annealing temperature exceeds 830°C. This is because at the high end of the annealing temperature range, the β phase forms as the second phase and inhibits the grain growth of the main α phase.
(2) Annealing in nitrogen gas forms a Ti2N and TiN titanium nitride layer on the outermost surface and a nitrogen-enriched α phase below that. The higher the annealing temperature, the higher the nitrogen concentration of the surface nitride layer.
(3) The Erichsen value, an index of press formability, improves as the annealing temperature rises, becomes maximum at 810°C in the vacuum annealed sheets and at 820°C in the nitrogen gas annealed sheets, and drops at higher temperatures. In particular, the Erichsen value of the nitrogen gas annealed sheets decreases sharply. The above-mentioned change appears correlated with the change in grain size. The grain size being equivalent, the sheets annealed below about 810°C have lower Erichsen values than those annealed above about 810°C.
(4) Conclusion (3) above may be explained as follows. When the sheet is annealed above about 810°C, its microstructure is composed of the two α and β phases. The Fe-enriched β phase is formed at the α phase grain boundary. Cooling produces a microstructure in which hard Fe-enriched regions are distributed at the α phase grain boundaries. With such a microstructure, the tensile test elongation and high-strain n value are decreased. The Erichsen value consequently drops as well.
(5) Titanium sheets annealed in nitrogen gas exhibit higher Erichsen values than titanium sheets annealed in a vacuum, regardless of the annealing temperature. This finding confirms the lubrication effect of the surface nitride layer. This difference becomes maximum when the titanium sheets are annealed at between 810 and 830°C and held for 30 sec. The balance between the positive effect of improving lubricity with the formation of the surface nitride layer and the negative effect of the occurrence of microcracks with increasing hardness and thickness of the surface nitride layer was considered to provide the best press formability at the annealing temperature range of 810 to 830°C.
References
- 1) K. Kimura, M. Masaki, M. Murayama and Y. Kako: Nippon Steel Tech. Rep., 85 (2002), 1.
- 2) M. Tokita, M. Sasage and T. Takechi: Nippon Steel & Sumitomo Met. Tech. Rep., 106 (2014), 9.
- 3) H. Murata: Titanium Zirconium (Jpn.), 40 (1987), 81.
- 4) S. Kataoka, J. Kihara and T. Aizawa: J. Jpn. Soc. Technol. Plast., 34 (1993), 210.
- 5) Y. Tabe, M. Fukuda and Y. Moriguchi: Proc. 1982 Japanese Spring Conf. for the Technology of Plasticity, the Japan Society for Technology of Plasticity, Tokyo, (1982), 173.
- 6) K. Miyoshi: Wear, 141 (1990), 35.
- 7) D. H. Buckley: ASLE Tans., 10 (1967), 134.
- 8) D. H. Buckley: Met. Eng. Quart., 7 (1967), No. 2, 44.
- 9) T. Murao, K. Mori, Y. Harada, K. Kato and F. Okubo: J. Jpn. Soc. Technol. Plast., 43 (2002), 336.
- 10) T. Murao, K. Mori, Y. Harada, K. Kato and F. Okubo: J. Jpn. Soc. Technol. Plast., 43 (2002), 427.
- 11) T. Murao, K. Mori, Y. Harada and F. Okubo: J. Jpn. Soc. Technol. Plast., 44 (2003), 55.
- 12) K. Takahashi, T. Hayashi, I. Takayama, J. Tamenari, M. Hiro and S. Kunioka: CAMP-ISIJ, 5 (2003), 1198.
- 13) T. Hayashi, K. Takahashi, K. Tokuno and T. Ohwue: CAMP-ISIJ, 5 (2003), 1199.
- 14) K. Takahashi, T. Hayashi, J. Tamenari and K. Tokuno: CAMP-ISIJ, 6 (2004), 1321.
- 15) K. Takahashi, T. Hayashi, I. Takayama, J. Tamenari and K. Tokuno: Proc. Ti 2007, Science and Technology, 11th World Conference on Titanium (JIMIC6), ed. by M. Niinomi et al., The Japan Institute of Metals (JIM), N. K. G, Sendai, (2007), 1079.
- 16) K. S. Zhou and H. Herman: Wear, 80 (1982), 101.
- 17) T. Matsunaga, C. Asahara, H. Shibata and Y. Tozaki: Reports of the Gifu Prefectural Metal Res. Inst., 62 (1988), 5.
- 18) F. Mitsumatsu, Y. Niwa and H. Shibata: Met. Technol. (Jpn.), 5 (1989), 27.
- 19) K. Fruya and K. Kitta: Rep. Yamanashi Ind Technol. Cent., 4 (1990), 56.
- 20) K. Tokaji, T. Ogawa and H. Shibata: Trans. Jpn. Soc. Mech. Eng. A, 57 (1991), 268.
- 21) T. Morita, M. Shimizu and K. Kawasaki: Trans. Jpn. Soc. Mech. Eng. A, 58 (1992), 172.
- 22) Q. Zhang, M. Kato and K. Nakasa: J. Jpn. Inst. Met., 64 (2000), 616.
- 23) M. Kato, K. Nakasa, X. Yan and K. Unoki: Trans. Jpn. Soc. Mech. Eng. A, 658 (2001), 1009.
- 24) J. L. Murray, Ed.,: Phase Diagrams of Binary Titanium Alloys, ASM, Metals Park, OH, (1987), 104.
- 25) K. Takahashi, M. Kaneko, T. Hayashi, I. Muto, J. Tamenari and K. Tokuno: Tetsu-to-Hagané, 90 (2004), 278.
- 26) M. Ogaya, M. Kisaichi and S. Ishiyama: Tetsu-to-Hagané, 72 (1986), 649.
- 27) H. Sasano and K. Kimura: J. Jpn. Inst. Met., 41 (1977), 933.
- 28) S. Ishiyama, S. Hanada and O. Izumi: J. Jpn. Inst. Met., 54 (1990), 976.
- 29) S. Ishiyama and S. Hanada: J. Jpn. Inst. Met., 55 (1991), 1315.
- 30) M. Fukuda, A. Okamoto and H. Itoh: Therm. Nucl. Power, (Jpn), 43 (1992), 231.
- 31) T. Nishizawa: Tetsu-to-Hagané, 70 (1984), 1984.
- 32) T. M. Mckinley: J. Electrochem. Soc., 103 (1956), 564.
- 33) K. Shimasaki, K. Ono and T. Tsuruno: Titanium ’80, Science and Technology, Proc. 4th Int. Conf. on Titanium, ed. by H. Kimura and O. Izumi, The Metallurgical Society of AIME, Warrendale, PA, (1980), 1131.
- 34) M. Nagai, K. Kashida, K. Murase, Y. Moriguchi, N. Tsuruoka, T. Kimura, S. Kashu, K. Ono, M. Koizumi and K. Mori: Titanium ’80, Science and Technology, Proc. 4th Int. Conf. on Titanium, ed. by H. Kimura and O. Izumi, The Metallurgical Society of AIME, Warrendale, PA, (1980), 1109.
- 35) Y. Moriguchi, A. Hasegawa, T. Nishimura and M. Taniguchi: Kobe Steel Eng. Rep., 32 (1982), 24.
- 36) S. Komatsu, M. Ikeda, T. Sugimoto, K. Kamei and K. Inoue: J. Jpn. Inst. Met., 55 (1991), 491.
- 37) Iu. A. Bagariatskill, G. I. Nosava and T. V. Tagunova: Sov. Phys. Dokl., 3 (1959), 1014.
- 38) J. L. Murray, Ed.,: Phase Diagrams of Binary Titanium Alloys, ASM, Metals Park, OH, (1987), 178.