Abstract
The burden distribution process is an important and efficient measure to maintain the stable operation of the blast furnace. An accurate burden distribution model will reveal the impact on the internal furnace state and help to optimize the blast furnace production index. This article reviews the recent development of the modeling and control techniques in the burden distribution process. The current modeling methods of the blast furnace burden distribution can mainly be divided into the following types: the mechanism-based method, the physical scale model-based experiments and the data-driven method. However, most of the existing modeling methods are not applicable to general blast furnaces because it depends on the specific furnace structure and parameters. Furthermore, with the advancement in measurement technology, sensors now provide rich amount of online measurement of the blast furnace iron-making process. This makes the data analysis more challenging. It is imperative to establish new modeling methods for the burden distribution process. Therefore, this paper points out the new trends in modeling and control of the blast furnace burden distribution process. First, a dynamic clustering method based on dynamic time warping and adaptive resonance theory is introduced. Second, the inverse dynamic model-based burden distribution control is developed. Furthermore, a multi-model-based switch for modeling the fluctuating blast furnace process is formulated. Finally, the reinforcement learning method for the dynamic optimization of the production index is recommended.
1. Introduction
To obtain a stable operation and a smooth blow-in, four kinds of operational schemes are utilized: burden distribution scheme, thermal scheme, slag forming scheme and blast scheme. The slag is required to have the appropriate physical characteristics, such as melting point, viscosity and liquidity so it can be separable from the hot iron. The slag’s physical characteristics are affected by the ratio and distribution of the raw material. The thermal state inside the furnace influences the chemical reactions and determines the productions. The thermal state is mainly adjusted based on blast control since the high-temperature blast is the only heat source. The burden distribution scheme, which determines the distribution of raw material, the particle segregation degree and the ore-to-coke ratio, has a direct impact on the gas and temperature distribution, the structure of the cohesive zone, the thermal state and the chemical reactions. Therefore, the purpose of the operation of the blast furnace is to obtain a reasonable burden distribution to a large extent.
The blast furnace has been viewed as a black box for a long time because of the complex operation mechanism and the difficulties in detecting the key states and optimization of the production index. A lot of efforts have been made to explore the methods of modeling the burden distribution process for the purpose of obtaining stable, safe and sustainable operations. The existing modeling methods for the burden distribution process can mainly be classified into three categories: the scale physical experiment method, the mechanism-based method and the data-driven method.
In previous years reduced-scale experiments or full-scale experiments were conducted to better understand the rules that characterize the burden distribution. The mixed layer formation was detected by the simulation model, and its effect on the burden distribution was discussed by a 1/2 scale model of Kashima #2 blast furnace.1) The influence of the burden distribution on the gas flow was investigated by a 1/15 scale model of Chiba #5 blast furnace.3) The 1/10 scale model of Keihin #1 blast furnace was designed to analyze the multiple factors that govern the burden distribution.5) The 1/10 scale half section model of Aceralia #B blast furnace was used to research the interaction between the gas flow and the burden distribution.6) Since the scale model experiments were conducted under a specific furnace structure and charging condition, the applicability of the physical experiment model was restricted.
For the mechanism-based method, multiple factors are taken into account, such as the particle flow type in the bunker,4) the opening of the Flow Valve,8) the rotating chute,10) the gas flow7,9) and so on. However, it is impossible to consider all the factors that affect the burden and gas flow. Therefore, it is difficult to get an accurate mechanism model.
A data-driven modeling technique can build the connection between the system state variables without explicit knowledge of the system mechanics. Many data-driven approaches, such as neural network,7,13) fuzzy logic12) and clustering,11) have been utilized in the burden distribution process. With the development of sensor technology, the traditional method is challenging to use with the huge on-line and off-line measurement of the blast furnace. In summary, it is necessary to develop an efficient and reliable burden distribution model to better reveal the black box of blast furnaces.
Due to the flexibility of the bell-less type blast furnace, the type of blast furnace has been replaced with the bell top. According to the movement process of the burden particles, the blast furnace burden distribution process model can be divided into the following sub-models: particle flow model inside the top bunker, flow control valve characteristic model, particle motion model from valve to chute, particle motion model on the chute, particle motion model in the free board after leaving the chute, burden profile model, burden layer descendent model, distribution of the burden layer thickness and the ore-to-coke ratio, coke collapse model and the mixed layer model, as illustrated in Fig. 1. The approaches used to obtain these sub-models can be classified as physical scale experiment methods, mechanism analysis methods and data-driven methods. This section reviews the existing methods in the above sub-models. Note that even though some methods are developed for the bell type blast furnace, the burden distribution phenomenon, such as coke layer collapse and particle size segregation, and the dependence on factors such as gas flow, furnace structure and burden particle physical properties is still useful for the bell-less type blast furnace.

This paper reviews the existing results on modeling and control of blast furnace burden distribution process and proposes future trends for the development in this field. Existing results based on scale-model, mechanism analysis and data-driven approaches are discussed in details in Section 2, 3 and 4, respectively. Then, dynamic clustering, inverse dynamic model, multi-model switching control and reinforcement learning are proposed as novel frameworks of future trends in modeling the blast furnace burden distribution process in Section 5. The conclusions are made in the end.
2. Scale-model Based Physical Experiment Method
In earlier times, the burden distribution law was investigated by physical experiments on full-scale or reduced-scale models of blast furnaces. Experiments were conducted on the scale model to simulate the charging and discharging processes. A summary of the existing physical experiments on scale blast furnace models are listed in Table 1. The phenomenon, such as mixed layer formation and coke layer collapse, were discovered and are a helpful guide through the real world blast furnace production process. Several important factors that influence the burden distribution, such as gas flow, particle size segregation and burden descent, were investigated and applied to the burden distribution control in the actual production process. The conclusions from the scale model based physical experiments play a critical role in the early development of blast furnace burden distribution modeling.
Table 1. Physical experiments on scale blast furnace model.
| Scale model | Topic | Result |
|---|
| 1/2, 1/10 scale model and full scale model of Kashima #2 BF1,4,24) | The discharge behavior of burden from the bunker; The burden trajectory in the chute and outside the chute; The mixed layer formation; Effect of gas flow and Burden descent on burden deposit angle; Effect of Burden descent on | The mixed layer formation has significant effect on the burden distribution; Gas flow will decrease burden deposit angle; The installation of a stone box will reduce the size segregation during discharge from bunker |
| 1/15 scale model of Chiba #5 blast furnace3) | Effect of discharging rate on particle size segregation; Operations that will strengthen the peripheral gas flow and the central gas flow simultaneously in order to stabilize furnace condition | Low discharging rate from the bell or chute help to reduce the Particle Size Segregation |
| 1/10 scale model of Keihin #12 blast furnace5) | Effects of factors on burden distribution | Burden profile is seriously affected by the throat diameter. |
| 1/3 scale model of Muroran No. 1 blast furnace30) | Effects of factors on burden distribution | gas flow has impact on the particle size distribution; coke layer collapse affects the burden profile |
| 1/10 scale half section model of Aceralia #B blast furnace6) | Effects of gas flow on burden distribution | A narrow window in the center connects the successive coke layers |
| 1/30 scale 2-dimensional slot type model31) | Pressure drop in blast furnace across layered burden | Interface resistance in layered burden structure has significant influence on overall pressure drop. |
Remark: The application of the physical experiment method based on scale models is restricted because of the following facts. It should be noted that most of the scale models of blast furnaces are cold models, i.e. the physical experiments are conducted under room temperature, which is completely different from the real production process. The cohesive zone and the tuyere raceway, which are the most significant factors of the gas flow, are not considered. This may lead to a misinterpretation of the burden distribution. Second, these experiments are conducted under specific conditions, such as the blast furnace structure and physical property of the burden materials. The conclusions drawn from these experiments may only be valid for the classes of blast furnaces with similar furnace structures and raw material properties. Furthermore, since manufacturing blast furnace scale models is expensive, it is necessary to develop an efficient and economic modeling method for the blast furnace burden distribution process.
3. Mechanism-based Method
In the mechanism analysis of the burden distribution, the burden is treated as either discrete moving element or continuous flowing medium. For a discrete moving element, a classical mechanism analysis, such as Newton’s law, is applied to a single particle. For a continuous flowing medium, the fluid dynamics of flowing materials is considered.
3.1. Particles before the Chute
3.1.1. Particle Flow in the Bunker
The particles are first charged into the bunker when they are conveyed to the blast furnace. Two kinds of bunkers are utilized: the parallel type bunker and the center-feed type bunker. A study has shown that the distribution of the particle size in the bunker and the size of the discharging burden varies with time, as shown in Fig. 2.4,24) Therefore, the discharging behavior of the burden from the bunker has an impact on the burden distribution, the gas flow and the furnace condition.

Currently, the parallel type bunker is used most frequently because it is more efficient in that the charging or discharging of ore and coke can be executed simultaneously. However, the parallel type bunker also suffers from the effect of uneven burden distribution. Figure 3 describes the diagram of the discharging process of a parallel bunker. The burden flow discharges from the bunker into the center tube, and finally drops on the rotating chute. Due to the falling velocity, the particles discharge from one hopper and fall along the opposite side along the center tube. Also, since the chute is rotating during this process, the falling point of the burden flow on the chute is not a circle, but an ellipse instead, as shown in Fig. 3(b). That is, the effective mass flow on the chute varies with time.25,26,29) This periodically varying mass flow relative to the chute under the bunker finally results in an uneven burden distribution. In order to overcome the uneven burden distribution by parallel bunker and rotating chute, a spiral four-batch burden distribution scheme with parallel hoppers is proposed.26)

The particle size during the bunker discharging process may lead to size segregation in the burden distribution. Recently, both numeric simulation models have been used to investigate the factors that affect the size segregation in the bunker.27,28) It has been shown that reducing the static and rolling friction between the wall and the particle, and the fraction of the fine particles helps to inhibit size segregation.
3.1.2. Flow Valve Opening Model
The flow valve is the start of the burden movement. The opening of the flow valve governs the burden flow behavior and further affects the burden distribution. There are two steps in the flow valve opening model. First, the dependence of the flow volume rate on the valve opening, based on experiments, is built. Polynomial regression, or dimensional analysis techniques, are applied to map the input and output variables. A summary of recent experiments on the relation between the flow volume rate Q and the valve opening γ is listed in Table 2. The next step is to utilize the hydraulics analysis theory to model the relation between the burden velocity va and the flow volume rate Q:
|
v
a
=
Q
π
(
2A
L
s
-
d
0
2
)
2
| (1) |
where
A is the opening area of the valve,
Ls is the circumference of the opening valve and
d0 is the average size of the burden particles.
Table 2. Experiments on the relation between the flow volume rate and the valve opening.
| Blast furnace | result |
|---|
| Magang Blast furnace33) |
γ
ore
=8.88+92.82
Q
ore
-75.03
Q
ore
2
+22.24
Q
ore
3
γ
coke
=13.36+104.43
Q
coke
-103.12
Q
coke
2
+36.07
Q
coke
3
|
| Angang Blast Furnac34) |
Q
ore
=6×
10
-7
γ
3
+5×
10
-4
γ
2
-2.8×
10
-3
γ+0.3988
Q
coke
=-2×
10
-6
γ
3
+
10
-3
γ
2
-0.0449γ+0.676
|
| Magang #11 blast furnace35) |
Q
ore
=13.978
e
0.1365γ
Q
coke
=8.0065
e
0.088γ
|
The burden falls on the chute when it comes out of the center pipe. By applying classical mechanism analysis (see Fig. 4), the force on a burden particle to be considered is listed in Table 3. Finally, the burden velocity at the end of the chute can be formulated as:9)
|
V
2
=
2g(cosα-μsinα)
l
0
+4
π
2
ω
2
l
0
2
sinα(sinα+μcosα)+
V
1
2
| (2) |
Table 3. Forces on the particles (on the chute).
| force | formula |
|---|
| Gravity | G=mg |
| Inertial centrifugal force | FT=4π2ω2lm sinα |
| Supporting force | FN=mgsinα−4π2ω2lsinαcosαm |
| Friction force | Ff=μ(mgsinα−4π2ω2lsinαcosαm) |
| Inertia Coriolis Force | Fk=4πωVlsin2αm |
It should be noted that the falling point of the burden on the chute varies with the change of the chute tile angle α. Taking this phenomenon into consideration, the burden velocity at the end of the chute can be modified as:36)
|
V
2
=(
2g
(
l
0
-bcotα
)
2
(
cosα-μsinα
)
+
V
1
2
+4
π
2
w
2
(
l
0
-bcotα
)
2
(
sinα+μcosα
)
sinα
)
1
2
| (3) |
Most of the existing models regard the particle motion on the chute to be straight. However, based on the nature of particle flow, the burden particles inside the chute follow a curve, as shown in Figs. 3(b) and 3(c).10) The z coordinate is the direction along the chute, and the x and y coordinates are shown in the cross section of the chute. Then, the three-dimensional movement of the burden particles inside the chute is modeled as:
|
{
d
2
z
d
t
2
=gcosα+
w
2
[
zsinα-(
R-y
)
cosα
]sinα
-2wsinα
dx
dt
-η
dz
dt
mv
N
d
2
x
d
t
2
=
w
2
x+2wsinα
dz
dt
-η
dx
dt
mv
N
d
2
z
d
t
2
=-gsinαcosθ+
w
2
[
zsinα-(
R-y
)
cosα
]η
dy
dt
mv
N
N=m[
gsinαcosθ+
w
2
R-
w
2
cosθsinα(
zcosα+Rcosθsinα
)
2wRcosαsinθ
dz
dt
+R
d
2
θ
d
t
2
]
tanθ=
x
R-y
V
2
=
(
dx
dt
)
2
+
(
dy
dt
)
2
+
(
dz
dt
)
2
| (4) |
where
m is the particle mass, kg;
g is the gravitational acceleration;
α is the chute inclination angle;
η is the friction coefficient;
ω is the angular velocity;
L is the chute length;
v is the particle velocity in the chute;
R is the chute radius,
m; and
θ is the moved angle in the tangential direction.
Remark: The three-dimensional model can better interpret the burden particle movement on the chute than the one-dimensional model. Note that with more factors taken into account, the model accuracy will be improved. However, with more parameters in the model, the model is now more complicated and the analytical solution is not available.
3.3. Particles in the Freeboard
The burden flows out from the end of the chute and enters the freeboard. For the simplicity of analysis, the burden flow in the free board was considered as a moving particle.9) However, in actuality, it is a mass flow with a certain width. Recently, the 3-D movement of the burden mass flow in the free board has been analyzed.10) The particles move in rotation in both a longitudinal direction and a tangential direction because of the influence of the Coriolis force, as illustrated in Fig. 4. Without the consideration of the Coriolis force, the height is hdb; whereas the profile corresponds to the solid line, and the height is hrb in the actual process:
|
h
rb
=R-Rcos(
φ
2
+θ
)
| (5) |
In a bell-less blast furnace burden charging process, the transversal section of blast furnace throat is divided into 11 concentric rings, as shown in Fig. 5(a).38) Then the incline angle of the rotating chute is usually divided into 11 corresponding levels. Whereas in the actual burden falling process, the burden flow falls on the burden surface within a region of a certain width, as shown in Fig. 5(b). The width between the burden mass flow and the multi-ring are not coordinated, shown in Fig. 5(c). The burden to be charged in the peripheral region will distribute in the region area across multiple rings. In order to deal with this problem, a novel scheme with 6 rings is proposed that utilizes the chute incline angle for burden charging to match the width of the burden mass flow, as shown in Fig. 5(d). In Figs. 5(c) and 5(d), the multiple rings are indexed with 1, …, 11 and 1, …, 6 for both cases, where 1 denotes the outer circle and the index increases inward.39)

Particle size segregation in the burden mass flow on the free board is analyzed. Experiments on an actual blast furnace were conducted at Tata Company to study the property of the burden flow in the free board. The results shows that for ore, sinter and coke, the burden materials in the falling stream segregate according to their size.40,41) The mass distribution in the falling stream is represented as a normal distribution:41)
|
y=
1
2π
σ
e
-
(
r-μ
)
2
2
σ
2
| (6) |
where
ydr is the mass fraction collected in the interval [
r,
r+
dr] during the experiment,
μ is the location of the mass flow center and
σ is the width of the material stream.
Remark: The burden flow in the free board should be treated as a mass flow with a specific width, because the width of the burden mass flow has an impact on the burden profile. The influence on the burden mass flow width and the particle size segregation in the burden flow should be taken into account in order to improve the mechanism model’s accuracy. Correspondingly, the control strategy of the burden distribution parameters, such as the chute rotation speed, chute incline angle and the opening of the flow control valve, should be designed to achieve the precise desired burden profile.
3.4. Particles on the Packed Bed
3.4.1. Burden Profile Model
Previously, the measurement of the burden profile was limited, hence the burden profile was mainly estimated by a calculation model.1,7,9,10) In the calculation model of the burden profile, the burden deposit angle is a key element in determining the burden surface.1) It has been pointed out that the gas flow has a significant impact on the burden profile since the burden deposit angle varies greatly with the existence of the gas flow. Besides the gas flow, other factors that affect the burden deposit angle are listed in Table 4.
Table 4. Factors of burden deposit angle.
| Factors | Burden deposit angle formula |
|---|
| Gas flow9) |
tanφ=tan
φ
0
-K
h
R
|
| Chute incline angle α48) |
{
ϕ
outer
coke
=73.12-1.97α(
α≻18
)
ϕ
outer
ore
=79.77-2.04α(
α≻22
)
|
| Previous Burden heap height h; |
{
β
in
=
a
i
+
b
i
h+
c
i
r
R
β
out
=
a
o
+
b
o
h+
c
o
r
R
|
| Furnace Throat Diameter R; |
| And distance of falling point to furnace center r49) |
The burden profile model is the centerpiece of the burden distribution process model. Note that it is impossible to measure the burden profile since it is a continuous surface. Hence, it is necessary to develop a simple and efficient expression for the burden profile.
The burden profile is a 3-D surface. For the simplicity of analysis, the three-dimensional burden surface is approximated in the 2-D axial cross-section. Based on the measurement of the burden surface, many mature data fitting techniques, such as polynomial regression and piecewise function in the radial direction, are applied to describe the burden profile.1,9,42,43)
Recently, multiple radars were installed in the top of the blast furnace to collect more information about the burden profile, as shown in Fig. 6. Based on the multi-radar data, the 3-D image reconstruction technique is developed for the burden surface estimation problem. In the researchers behind this paper’s previous study, the burden surface was parameterized as:14)
|
f(
x,y
)
=
∑
i=1
N
a
i
h
i
(
x,y
)
| (7) |
where (
x,
y,
z) are the coordinates of the measured surface point with
z being the surface height measured at (
x,
y) in the x-y plane,
hi(
x,
y) is the basis function of the estimation
f(
x,
y) and
ai is the weight to be determined. After collecting n points in the XOY plane, one can obtain the matrix equation in
(8).
|
[
h
1
(
x
1
,
y
1
)
⋯
h
1
(
x
n
,
y
n
)
⋮
⋱
⋮
h
n
(
x
1
,
y
1
)
⋯
h
n
(
x
n
,
y
n
)
][
a
1
⋮
a
n
]=[
z
1
⋮
z
n
].
| (8) |
Then least square method is applied to minimize the objective function in (9).
|
min
{
a
i
}
i=1
N
J=
∑
k=1
n
[
f(
x
k
,
y
k
)
-
z
k
]
2
.
| (9) |
Furthermore, note that the direct least square solution to the minimization problem in (9) is essentially an unconstrained optimization problem. However, during the calculation of the burden profile, physical condition constraints should be taken into account, such as the burden volume and the burden deposit angle. Therefore, the constrained optimization problem for the burden profile calculation was developed in the researchers behind this paper’s previous study:50)
|
min
{
a
i
}
i=1
N
J=
∑
k=1
n
[
g(
x
k
,
y
k
)
-
z
k
]
2
s.t. {
Xς=Z
Nς=Φ
| (10) |
where the parameterized burden surface is
g(
r) and the constraints are:
|
g(
r
)
=
∑
j=0
3
a
i
j
r
j
=[
r
3
r
2
r
1
]
[
a
3
a
2
a
1
a
0
]
T
[
r
1
3
r
1
2
r
1
1
r
2
3
r
2
2
r
2
1
⋮
⋮
⋮
⋮
r
n
3
r
n
2
r
n
1
]=X,[
3
n
max
2
2
n
max
1
0
3
n
min
2
2
n
max
1
0
]=N
[
a
3
a
2
a
1
a
0
]
T
=ς,
[
z
1
z
2
⋯
z
n
]
T
=Z
[
tan
φ
max
-tan
θ
min
]=Φ
| (11) |
where
r is the distance from the measured point (
x,
y) to the furnace center.
Remark: The burden profile model is the core part of the burden distribution model. The mechanism analysis should be based on the measurement of the burden surface in order to ensure its reliability. The three-dimensional model is closer to the actual burden surface than the one-dimensional model. When calculating the burden profile, physical constraints, such as burden charging volume and burden deposit angle, should be taken into account to improve the model’s accuracy. Furthermore, most of the previous burden profile models are based on the assumption that the burden surface is central symmetric, which is incorrect for some special furnace conditions. Therefore, the burden profile analysis should be analyzed together with the furnace condition to truly describe the burden surface.
3.4.2. Correction of Burden Profile: Burden Descent Model, Mixed Layer Model and Coke Collapse Model
In the actual burden distribution process, the measured burden profile is different from the calculated results. According to previous experiments, three factors should be taken into consideration to modify the calculated burden profile: burden descent, mixed layer formation and coke collapse.1,2,7) Hence, it is necessary to analyze these three sub-models to improve the accuracy of the burden distribution estimation.
The burden descent model describes the velocity distribution of the burden descent in a radial distribution, which is one of the main factors of the change in the burden profile after the burden falls on the burden surface. Zhou et al. investigated the existing burden descent models.55) The accuracy of four kinds of burden descent models were evaluated by a time line burden profiles quantitatively evaluate the error between experimental and modeled burden structures.
It was found that when the sinter or ore materials are dumped on the coke layer, the coke layer is pushed to the furnace’s center region to increase the coke layer’s thickness. Two kinds of approaches have been applied to analyze the re-distribution of the burden profile: the collision energy based method for mixed layer formations and the safety factor-based method for the coke collapse analysis.44) In the mixed layer formation analysis, the increase of the coke layer’s thickness ΔLc is proportional to the collision energy EM:
|
Δ
L
c
=3.49×
10
-4
×
E
M
-136
E
M
=
1
2
M
V
2
+MgH
| (12) |
where
M is the mass of the ore in one dump and
V is a component of the ore velocity in the direction of the coke surface. However, the region of the collapsed coke layer in the radial direction is not expressed in detail. On the other hand, based on the safety factor analysis of the slope, the specific coke collapse region is provided.
30,44,45) The coke collapse model is able to study the coke collapse phenomenon analytically and provide the exact collapsed region. It should be noted that the coke collapse model is based on the burden profile estimation. Therefore, the coke collapse model depends on the accuracy of the burden profile estimation.
4. Data-driven Method
Advanced measurement techniques, such as radar, laser, microwave and infrared, provide more information about burden distribution than before. With the rich information about burden distribution, some distributed variables and indices that are impossible to measure directly, such as gas flow distribution, burden layer thickness, and ore-to-coke ratio can be estimated by the data-driven method. The data-driven method can be combined with the mechanism method to enhance the interpretation of data. A physical experiment based on a scale model can be utilized to verify the model’s validity.
There are many works utilizing the data-driven techniques to developed the burden profile model. The burden profile after charging, Pnew, depends on both the previous burden profile, Pold, and the burden distribution matrix, M. Therefore, the dependence of Pnew on Pold and M can be expressed by the following equation:
|
P
new
=f(
P
old
,M
)
| (13) |
The burden profile can be estimated based on multi-radar data in Baosteel. Then, clustering techniques, such as k-means and fuzzy c-means, are applied to divide the history burden profiles into clusters. The burden distribution matrix is designed for each cluster of burden profiles according to (13). Therefore, given a desired burden profile, the first step is to classify the current one according to the clusters of previous burden profile data. Secondly, the corresponding burden distribution control strategy, i.e. the burden distribution matrix, should be applied to the current burden profile. If the current burden profile does not match the existing clusters very well, then it is designated as a new cluster, and the corresponding burden distribution matrix is recalculated. The burden distribution multi-model based control strategy is illustrated in Fig. 7.12)

The data-driven method is also applied to estimate the burden layer. Based on the heat transfer between the ascending gas flow and the charged burden materials, the temperature drop in the gas flow is regarded as an indicator of the burden layer thickness. It is assumed that the gas temperature in the packed bed is constant Tg and the burden has a uniform temperature Ts. The heat flow between the gas and the burden is expressed as:23)
|
ΔQ=
m
˙
g
c
g
[
T
¯
g
-
T
g
(
t
)
]=hS[
T
g
(
t
)
-
T
s
(
t
)
]
| (14) |
where
m
˙
g
denotes the gas flow mass,
S is the heat transfer area,
h is the heat transfer coefficient and
cg is the heat capacity gas flow. Note that
S, the heat transfer area, is proportional to the
cg thickness of the charged layer. Hence, the following index is utilized to estimate the burden layer:
23)
|
β=
T
g
(
t
d
)
-
T
g
(
t
d
+Δt
)
T
g
(
t
d
)
-
T
s
| (15) |
where
td is the burden charging start time and
td+Δ
t is the time when the maximum temperature drop occurs. Then, the recurrent neural network was applied to model an autonomous model of the index in (15). The neural network prediction of the burden layer formation process and the ore-to-coke ratio operates similarly.
The blast furnace remains to be a black box due to the limited measurement of the internal condition. For instance, in the gray image obtained by the infrared camera in Fig. 8, the region above 600°C is pure white and below 200°C is pure black. Thus, the burden surface temperature field is difficult to analyze only based on the infrared camera. However, with the development of the measurement techniques, more information is available from inside the blast furnace during the production process, and visualization of the black box is possible. Information fusion can be applied to improve the estimation of some key parameters. For example in Fig. 8, multi-source information, including the infrared image of the burden surface and the cross-thermometer measurement of the gas flow temperature, is first registered to the same spatial dimension and temporal dimension. Then, the burden surface temperature field can be obtained by information fusion of the infrared image and the cross-thermometer measurement. The calibrated estimation of the infrared image of the burden surface based on the multi-level information fusion is shown in Fig. 8(c), where the difference of color corresponds to the temperature field and more details about the burden surface temperature field can be provided.51) The installation of the infrared camera and the cross-thermometer is illustrated in Figs. 8(a) and 8(b).51)

Remark: The data-driven method is directly based on the data collected from the blast furnace production process. Since the mutual dependency relationship among the variables varies with the furnace condition, the data collected for modeling may be valid only under that specific circumstance. When the furnace condition is not trained by the data driven model, it will lead to unsatisfactory results. This fact mainly restricts the applicable scope of the data-driven models. Therefore, a data-driven model with self-learning capabilities is necessary for the complex blast furnace burden distribution process.
5. Future Trends of Burden Distribution Modeling
Based on the above analysis of a scale model that was based on the physical experiment method, the mechanism analysis method and the data driven method, the precise burden distribution control is restricted by the static nature and unsatisfactory real time performance. According to the development trends in the modeling and control theory, four advanced techniques are proposed in this section.
5.1. Dynamic Clustering of Data in the Burden Distribution Process
In the burden distribution control, the target should react to the current furnace condition to stabilize the operation. For different furnace conditions, the corresponding burden distribution control strategy is also different. Therefore, it is important to classify the furnace condition with its dynamic nature into groups and analyze the furnace condition under each group respectively.
5.1.1. Time Series Clustering for Blast Furnace
One way to study the dynamic nature of the burden distribution process is to collect the data as a time series because the historical time series is able to describe the tendency of the evolution of the variable. Then, clustering techniques can be applied to the time series data. In clustering, the similarity/dissimilarity measure between two time series determines the cluster results. For instance, the time series of the pressure drop in the blast furnace collected from a blast furnace during three different periods with the same length is shown in Fig. 9. It can be seen that both time series 1 and time series 3 have the tendency to decrease, and time series 2 has the tendency to increase. Therefore, the time series 1 and time series 3 should be clustered as a group. However, based on classical Euclidian distance criteria, the time series 1 is more close to time series 2. Therefore, the similarity/dissimilarity measure is significant to the clustering of the data in blast furnace.

Dynamic time warping is a method where two sequences are aligned by warping the time axis iteratively until an optimal match between the two sequences is found.56,57) The sequences are warped nonlinearly in the time dimension to determine a measure of the similarity independent of certain nonlinear variations in the time dimension. This method is often used in time series clustering problems.
Figure 10 is an illustration of the dynamic time warping algorithm. Suppose A={a1,a2,···,an} and B={b1,b2,···,bm} are two time series. An n×m matrix D with each entry denoting the distance d(ai,bj) between the element ai and bj. A warping path, W={wk|k=1,…,K} where max (m, n)≤K≤m+n−1, is a set of matrix elements in an index that satisfies the constraints listed in Table 5, and each element wk=(i, j) denotes the alignment of (ai, bj).
|
d(
A,B
)
=
min
{
w
k
}
k=1
K
[
∑
k=1
K
w
k
K
].
| (16) |

Table 5. Constrained condition of dynamic time warping.
| Constraints | Description |
|---|
| Monotonic condition | The path will not turn back on itself, both the i and j indexes either stay the same or increase, they never decrease. |
| Continuity condition | The path advances one step at a time. Both i and j can only increase by at most 1 on each step along the path. |
| Boundary condition | The path starts at the bottom left and ends at the top right, i.e. w1=(1,1), w2=(n,m). |
| Warping window condition | A good path is unlikely to wander very far from the diagonal. The distance that the path is allowed to wander is the window width. |
| Slope constraint condition | The path should not be too steep or too shallow. This prevents short sequences matching too long ones. The condition is expressed as a ratio p/q where p is the number of steps allowed in the same (horizontal or vertical) direction. After p steps in the same direction is not allowed to step further in the same direction before stepping at least q time in the diagonal direction. |
Dynamic programming can be used to effectively find this path by evaluating the following recurrence, which defines the cumulative distance ρ(i, j) as the sum of the distance of the current element d(ai, bj) and the minimum of the cumulative distances of the adjacent elements:
|
ρ(
i,j
)
=d(
a
i
,
b
j
)
+
min
W
{
ρ(
i-1,j-1
)
,ρ(
i-1,j
)
,ρ(
i,j-1
)
}
| (17) |
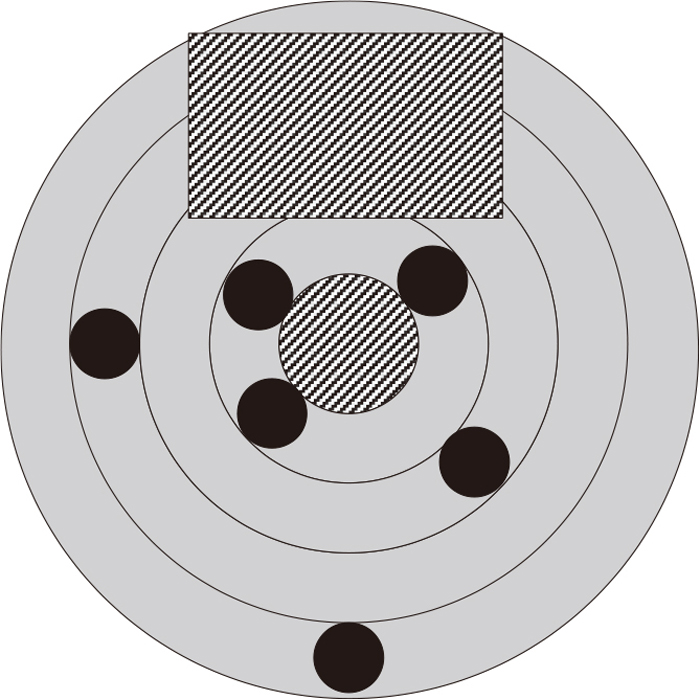
In psychology and cognitive science, long- and short-term memory is the ability of humans to learn from experience. Long-term memory corresponds to the fact that human recognized patterns a long time ago in their minds. Short-term memory represents the ability to recognize a novel pattern that is not stored in memory while affecting the stored patterns. In the clustering of the blast furnace production process, one problem is that the blast furnace may exhibit behavior that it has never shown before. Therefore, the clustering of the data collected from the production process needs to be retained, where the previous knowledge about the furnace might be cancelled. In this section, the dynamic clustering method, based on long- and short-term memory ability, is introduced for the blast furnace production process, as shown in Fig. 11, where the black quadrilateral stands for the input to the network. The method we recommend is known as adaptive resonance theory (ART).

The basic adaptive resonance theory architecture, ART1, consists of three parts:58,59,60) Layer 2 to Layer 1 expectations, the orienting subsystem and the gain control. The learning process is shown as a result of the interaction of top-down observer expectations with ‘bottom-up’ sensory information, as illustrated in Fig. 11. The ‘top-down’ feedback expectation occurs in a set of connections from Layer 2 to Layer 1. The activated node in Layer 2 replays its expectation back to Layer 1. Then, the comparison between the expectation and the input pattern is performed in Layer 1. When the expectation and the input pattern are not closely matched, the orienting subsystem causes a reset in Layer 2. This reset disables the current winning neuron, and the current expectation is removed. A new competition is then performed in Layer 2, implemented in a winner-take-all style. After the competition is complete, the previous winning neuron is disabled. The new winning neuron in Layer 2 projects a new expectation to Layer 1, through the L2-L1 connections. This process continues until the L2-L1 expectation provides a close enough match to the input pattern.
Through the above discussion, the long and short-term memory-based adaptive learning is able to solve the dynamic clustering of the blast furnace condition online. Note that the input to the ART1 network should be binary patterns. In Fuzzy ART,62) the architecture is endowed with a fuzzy logic operator while keeping the mathematical properties present in ART 1. The ART methods are able to handle the dynamic clustering problems for the blast furnace production process.
5.2. Inverse Dynamic Model Based Control of the Blast Furnace Burden Distribution Process
Many advanced data-driven approaches have been applied to model the overall blast furnace process, including the burden distribution process, such as a neural network,15,16,17) a support vector machine and a fuzzy logic model.18,19,20) Most of the existing methods are essentially static. However, in the complex blast furnace burden distribution process, the relationship between variables is essentially dynamic. For example, the current burden profile depends on the previous one and the gas flow, which greatly affects the burden distribution. Therefore, it is necessary to create a dynamic model for the burden distribution process to better understand its dynamic nature.
It can be seen from the above discussion that most of the existing models are mainly forward models, that is, each sub-model of the burden distribution is analyzed independently. However, time delay exists in the burden distribution process, which may result in a lag of the burden charging strategy behind the change of the burden profile. Therefore, the forward-type model can hardly contribute to the precise control. On the other hand, the burden distribution is a typical dynamic process, which responses gradually. Furthermore, some indexes, such as with the ore-to-coke ratio, the burden layer descendent velocity distribution and the burden profile, correlate and intercouple with each other on both a time scale and a spatial scale. All these facts restrict the performance of the burden distribution model. Therefore, this paper’s researchers suggest building an inverse dynamic model for the burden distribution process. That is, determine the burden distribution control strategy based on the desired burden surface and the current furnace state, as shown in Fig. 12.

There are multiple sub-models in the inverse dynamic model. Given the current furnace state, the previous burden profile and the desired burden surface, each sub-model calculates the corresponding burden distribution control strategy. Then, the multi-objective optimization technique can be applied to merge the strategies from multiple dynamic inverse sub-models by the burden distribution control strategy fusion unit. The burden distribution control strategy depends on both the current information and the historical data from the blast furnace, which is the implementation of the dynamic behavior of the burden distribution process. When the strategy is applied, the furnace state information collected from the blast furnace production process is used to assess the inverse dynamic model. If the burden surface and the blast furnace state is unsatisfactory, then the inverse dynamic model is adjusted by the assessment.
5.3. Multi-model Method Based on Furnace Condition and Production Index
In an actual blast furnace production process, the furnace state fluctuates due to the impurities in the burden material. The burden distribution depends on multiple factors, such as the gas flow distribution and the burden descent. This sharp fluctuation will result in an abnormal blast furnace condition. The characteristic parameters and the model structure under different furnace conditions vary greatly because of the significant changes that have taken place during the physical and chemical reaction. The burden distribution model may be valid under the specific furnace circumference and invalid otherwise. Therefore, a multi-model method of the burden distribution process is proposed. The diagram is shown in Fig. 13. The switching rules among multiple models should guarantee the stability of the overall system, which is well studied in the control community.63)

The burden distribution multi-model is divided into two parts: off-line learning and online implementation. In the off-line learning phase, the information from the blast furnace process, such as the temperature of the gas and burden and the burden surface measured by multi-radar, infrared image and laser, are first collected from the blast furnace production process and used to build the gas flow sub-model, the heat transfer sub-model and the burden distribution sub-model. Second, the production indexes and the furnace condition are clustered into groups. Finally, for each cluster of furnace condition, the corresponding burden distribution sub-model is created, which can give a full description of the whole blast furnace process. For the online implementation, the real time measurement of the blast furnace condition is classified according to the existing furnace condition clusters. Since the furnace condition and the production index are grouped into clusters, the blast furnace burden distribution process model should be endowed with the function of switching logically. Then, a switch rule can be designed to determine the right model to describe the real time burden distribution process. The switching rules can be determined from the relationship between the furnace condition and the burden distribution parameters. Then, the dynamic models should be combined with the switching rules and the control methods of the multi-model, such as adaptive control, fuzzy logic and switching control to establish the burden charging strategy. In this way, a satisfactory control strategy of the burden surface and the stable burden distribution associated with the smooth furnace condition can be guaranteed.
5.4. Reinforcement Learning for Blast Furnace Control
Reinforcement learning is an area of machine learning inspired by behavioral psychology, concerned with how the agents should interact with the environment in order to maximize the cumulative reward. Reinforcement learning differs from standard supervised learning in that correct input/output pairs are not explicitly presented. Instead, the output is assessed in a cumulative way. Reinforcement learning is particularly well-suited to problems which include a long-term versus short-term reward trade-off. It has been applied successfully to various problems, including robot control, backgammon64) and the game of Go.65) Recently, reinforcement learning is applied to the optimal control problem for both continuous and discrete time dynamical systems.66,67,68,69) Reinforcement learning is introduced to the blast furnace burden distribution control in this section.
The blast furnace process is modeled as the following general discrete-time nonlinear dynamic system:
|
x
k+1
=f(
x
k
,
u
k
)
| (18) |
where
xk is a vector with each component denoting the state of the blast furnace at time
k and
uk is the output of the burden distribution control strategy unit. Suppose the production index is expressed as
r(
xk,
uk), which is a function of both the furnace state and the burden distribution control strategy. The burden distribution control objective function or performance evaluation function
J(
xi) is formulated as the accumulation of the production index in the interval [
k,
k+
kD] with fixed a length of
kD:
|
J(
x
i
)
=
∑
i=k
k+
k
D
r(
x
k
,
u
k
)
| (19) |
According to the Bellman optimal principle, the necessary condition for the optimal control and the optimal objective function is:
|
J
*
(
x
k
)
=
min
u
{
r(
x
k
,u
)
+
J
*
(
x
k+1
)
}
u
k
*
=
argmin
u
{
r(
x
k
,u
)
+
J
*
(
x
k+1
)
}
| (20) |
Dynamic programming is a powerful tool to solve this optimal control problem. However, it suffers from “the curse of dimensionality” and is not computationally feasible to implement due to the backward numerical process required for its solutions. Reinforcement learning is an efficient way to solve the dynamic programming problems forward-in-time. The diagram of the reinforcement learning for optimal control of the burden distribution problem is shown in Fig. 14.

There are three units in the reinforcement learning framework of the blast furnace burden distribution control: the burden distribution strategy unit, the blast furnace dynamic system unit and the performance evaluation unit. Each unit can be implemented by a neural network. The blast furnace dynamic system, formulated in (18), describes the dynamic behavior of the blast furnace burden distribution process. It takes the burden distribution control strategy as the input, and outputs the key furnace state, such as the burden distribution index, the gas flow distribution index and the production index. The blast furnace state is used as the input of the burden distribution control strategy unit to produce the burden distribution control, such as the flow control valve, the chute rotate angle and the chute rotating speed. The burden control strategy and the furnace state are conveyed to the performance evaluation unit. The reward function in the reinforcement learning framework is chosen as the production index r(xk, uk). The performance evaluation unit’s target is to predict the accumulation of the production index in (19), which is an evaluation of the burden distribution control strategy. The output of the performance evaluation unit can be further utilized to optimize the burden distribution control strategy.
The described reinforcement learning framework is an approximated solution of the optimal Bellman equation in (20). Some theoretical problems need to be analyzed before they are applied to the real world blast furnace production process, such as the closed loop stability, the convergence proof of the approximation of the optimal control strategy and the optimal performance evaluation function.
6. Conclusions
This paper makes a survey in the field of modeling and control in blast furnace burden distribution process. Existing problems and corresponding challenges are discussed in detail. Based on the development in machine learning and advanced control theory, future trends for the development of data analysis, modeling and control of burden distribution process in blast furnace is proposed as four novel frameworks: dynamic clustering, inverse dynamic model based control, multi-model modeling and control, and reinforcement learning. Each framework is discussed in the context of blast furnace for the application in burden distribution process.
Acknowledgments
This work was supported in part by the Mary K. Finley Missouri Endowment, the Missouri S&T Intelligent Systems Center, the National Science Foundation, the National Natural Science Foundation of China (NSFC Grant No. 61333002, No. 61671054, No. 61473034, No. 61673053 and No. 61673056) and the China Scholarship Council (CSC No. 201406460057).
References
- 1) Y. Kajiwara, T. Jimbo and T. Sakai: Trans. Iron Steel Inst. Jpn., 23 (1983), 1045.
- 2) Y. Kajiwara, T. Jimbo, A. Kometani and Y. Shimoda: Trans. Iron Steel Inst. Jpn., 24 (1984), 379.
- 3) T. Haru, M. Saino, M. Yasuno, K. Okumura, K. Kaneko, Y. Konishi and T. Sawada: Trans. Iron Steel Inst. Jpn., 24 (1984), 482.
- 4) Y. Kajiwara, T. Jimbo, T. Joko, Y. Aminaga and T. Inada: Trans. Iron Steel Inst. Jpn., 24 (1984), 799.
- 5) M. Hattori, B. Iino, A. Shimomura, H. Tsukiji and T. Ariyama: ISIJ Int., 33 (1993), 1070.
- 6) J. Jimenez, J. Mochon, A. Formoso and J. Ayala: ISIJ Int., 40 (2000), 114.
- 7) V. R. Radhakrishnan and K. M. Ram: J. Process Control, 11 (2001), 565.
- 8) A. Murao, Y. Kashihara, S. Watakabe and M. Sato: ISIJ Int., 51 (2011), 1360.
- 9) Y. Liu: The Law of Blast Furnace, Metallurgical Industry Press, Beijing, (2005).
- 10) Z. J. Teng, S. S. Cheng, P. Y. Du and X. B. Guo: Int. J. Miner. Metall. Mater., 20 (2013), 620.
- 11) X. Zhou, X. Li, D. Liu, Y. Yin, X. Chen and Q. Hou: Int. Conf. on Intelligent Control and Information Processing, IEEE, Piscataway, NJ, (2010), 286.
- 12) X. Li, D. Liu, C. Jia and X. Chen: Neurocomputing, 148 (2015), 209.
- 13) J. Hinnela and H. Saxen: ISIJ Int., 41 (2001), 142.
- 14) X. Chen, J. Wei, D. Xu, Q. Hou and Z. Bai: ISIJ Int., 52 (2012), 2048.
- 15) V. R. Radhakrishnan and K. M. Ram: J. Process Control, 10 (2000), 509.
- 16) J. Chen: Eng. Appl. Artif. Intell., 14 (2001), 77.
- 17) Y. Yang, S. Zhang and Y. Yin: Neural Comput. Appl., 27 (2016), 241.
- 18) L. Jian, C. Gao, L. Li and J. Zeng: ISIJ Int., 48 (2008), 1659.
- 19) A. Ghosh and S. Majumdar: Int. J. Adv. Manuf. Technol., 52 (2011), 989.
- 20) R. Martín, F. Obeso, J. Mochón, R. Barea and J. Jiménez: Ironmaking Steelmaking, 34 (2007), 241.
- 21) F. Pettersson, J. Hinnela and H. Saxen: Mater. Manuf. Process., 18 (2003), 385.
- 22) J. Hinnela, H. Saxen and F. Pettersson: Ind. Eng. Chem. Res., 42 (2003), 2314.
- 23) M. Nikus and H. Saxen: ISIJ Int., 36 (1996), 1142.
- 24) Y. Aminaga, Y. Kajiwara, T. Inada, T. Tanaka and K. Sato: Trans. Iron Steel Inst. Jpn., 27 (1987), 851.
- 25) H. Zhao, M. Zhu, P. Du, S. Taguchi and H. Wei: ISIJ Int., 52 (2012), 2117.
- 26) T. Ren, X. Jin, H. Ben and C. Yu: J. Iron Steel Res. Int., 13 (2006), 14.
- 27) Y. Yu and H. Saxen: Chem. Eng. Sci., 65 (2010), 5237.
- 28) Y. Yu and H. Saxen: Powder Technol., 262 (2014), 233.
- 29) J. Xu, S. Wu, M. Kou, L. Zhang and X. Yu: Appl. Math. Model., 35 (2011), 1439.
- 30) Y. Okuno, S. Matsuzaki, K. Kunitomo, M. Isoyama and Y. Kusano: Tetsu-to-Hagané, 73 (1987), 91.
- 31) M. Guha, S. Nag, P. K. Swamy and R. V. Ramna: ISIJ Int., 51 (2011), 1795.
- 32) P. Wang: Iron Steel, 38 (2003), 8.
- 33) X. Guan: Ironmaking, 14 (1995), 37.
- 34) Y. Che, L. Li, B. Sun, P. Sun, T. Guo and X. Liu: Angang Technol., 353 (2008), 16.
- 35) J. Yang and G. Su: J. Anhui Vocat. Coll. Metall. Technol., 16 (2006), 22.
- 36) H. Chen: Iron Steel, 32 (1997), 456.
- 37) H. Saxen and M. Nikus: ISIJ Int., 42 (2002), 115.
- 38) D. Liu, X. Li, D. Ding and X. Chen: Control Theory Appl., 29 (2012), 1277.
- 39) X. Gao, S. Cheng, P. Du, Y. Bai, T. Wu and Z. Hu: Iron Steel, 45 (2010), 19.
- 40) M. Guha, S. Nag, S. Kundu, M. Patra, S. Sinha and S. Kumar: ISIJ Int., 49 (2009), 1816.
- 41) S. Nag, M. Guha, S. Kundu, S. K. Sinha and U. Singh: ISIJ Int., 48 (2008), 1316.
- 42) T. Yang, G. Duan and Y. Zhou: Iron Steel, 26 (1991), 10.
- 43) M. Wu, C. Tian and W. Cao: Control Eng. China, 13 (2006), 490.
- 44) S. Nag, S. Basu and A. B. Yu: Ironmaking Steelmaking, 36 (2009), 509.
- 45) S. Wu, C. Fu, C. Liu, J. Xu and M. Kou: J. Iron Steel Res. Int., 18 (2011), 08.
- 46) Q. Zhu, H. Cheng, Y. Yin and X. Chen: J. Univ. Sci. Technol. Beijing, 34 (2012), 1061.
- 47) G. Zhao, S. Cheng, W. Xu and C. Li: ISIJ Int., 55 (2015), 115.
- 48) X. Du: Angang Technol., 378 (2012), 10.
- 49) Z. Teng, S. Cheng and P. Du: J. Iron Steel Res., 24 (2012), 58.
- 50) Q. Zhu, C. Lv, Y. Yin and X. Chen: J. Iron Steel Res. Int., 20 (2013), 33.
- 51) J. An, M. Wu, Y. He and W. Cao: Proc. 29th Chinese Control Conf. (CCC), IEEE, Piscataway, NJ, (2010), 5660.
- 52) H. Nishio and T. Ariyama: Tetsu-to-Hagané, 68 (1982), 2330.
- 53) M. Ichida, M. Takao, K. Kunitomo, S. Matsuzaki, T. Deno and K. Nishihara: ISIJ Int., 36 (1996), 493.
- 54) D. Fu, F. Tian, G. Chen, D. Huang and C. Zhou: Proc. 2009 ASME Summer Heat Transfer Conf. (HT2009), ASME, New York, NY, (2009), 797.
- 55) P. Zhou, P. Shi, Y. Song, K. Tang, D. Fu and C. Zhou: J. Iron Steel Res. Int., 23 (2016), 765.
- 56) H. Sakoe and S. Chiba: IEEE Trans. Acoust., Speech, Signal Process., 26 (1978), 43.
- 57) D. Berndt and J. Clifford: AAAI-94 Workshop on Knowledge Discovery in Databases, AAAI Press, Palo Alto, CA, (1994), 359.
- 58) M. Hagan, H. Demuth, M. Beale and O. Jesús: Neural Network Design, Chapter 19, PWS Publishing, Boston, (1996), 1.
- 59) G. Carpenter and S. Grossberg: Encyclopedia of Machine Learning, Springer Science & Business Media, New York, (2011), 22.
- 60) G. Carpenter and S. Grossberg: Computer, 21 (1988), 77.
- 61) G. Carpenter and S. Grossberg: Appl. Opt., 26 (1987), 4919.
- 62) G. Carpenter and S. Grossberg: IEEE Trans. Neural Netw., 3 (1992), 698.
- 63) D. Liberzon: Switching in Systems and Control, Springer Science & Business Media, New York, (2012).
- 64) R. Sutton and A. Barto: Reinforcement Learning: An Introduction, MIT Press, Cambridge, MA, (1988).
- 65) C. Lee, M. Wang, S. Yen, T. Wei, I. Wu, P. Chou, C. Chou, M. Wang and T. Yan: Comput. Sci. Eng., 18 (2016), 4.
- 66) D. Prokhorov and D. Wunsch: IEEE Trans. Neural Netw., 8 (1997), 997.
- 67) F. Lewis and D. Vrabie: IEEE Circuits Syst. Mag., 9 (2009), 32.
- 68) F. Wang, H. Zhang and D. Liu: IEEE Comput. Intell. Mag., 4 (2009), 39.
- 69) F. Lewis and D. Liu: Reinforcement Learning and Approximate Dynamic Programming for Feedback Control, John Wiley & Sons, Hoboken, NJ, (2013).