Regular Article
Method for Outlet Temperature Control during Warm Rolling of AZ31 Sheets with Heated Rolls
2017 Volume 57 Issue 9 Pages 1577-1585

Details
2017 Volume 57 Issue 9 Pages 1577-1585
The warm rolling process with heated rolls for AZ31 sheets was proposed instead of normal hot rolling process without roll heating. Experimental study showed that the quality of rolled sheets was sensitive to the outlet temperatures which need well control during rolling process. In the paper, a computational model combining a finite element method (FEM) with a mathematical model was developed to predict the outlet temperature during the warm rolling of AZ31 alloy sheets. The accuracy of the FEM model was verified by rolling experiments with various process parameters. Numerous thermo mechanical finite element simulations were carried out to obtain a database relation between process parameters and out let temperature. The process parameters were rolls and sheet heated temperatures, rolling speed, initial sheet thickness and thickness reduction. The mathematical model was obtained based on regression of the database. The model gave satisfactory results when comparing the predictions and FEM simulation results. A comprehensive validation of the prediction model is presented by new set of designed experiments. In the explored process window, a good correlation was found with an error on the outlet temperature lower than 10°C. The proposed method in this paper was suitable for outlet temperature control by rolling schedule design during the warm rolling process of AZ31 sheet with heated rolls.
As the lightest structural metallic materials, magnesium (Mg) alloys have great potential in weight-saving applications due to their low density, high specific strength and good machinability.1) They show insufficient workability at room temperature (RT) due to their hexagonal close-packed crystal structure and quite acceptable formability at elevated temperatures.2) So generally, magnesium alloy sheets are rolled at elevated temperatures, and so called hot rolling process with sheet temperature higher than 250°C is frequently reported.3,4,5) However, for the practical application of Mg alloy sheets, hot rolling also brings many issues including inefficiency, energy intense, and high cost resulting from the repetitive reheating and rolling steps.6)
In recent year, a new rolling technology called warm rolling with heated rolls was proposed instead of conventional hot rolling.7) By this idea, the rolls are also heated to avoid the temperature reduction of sheets occurring during normal hot rolling process. So the initial sheet temperature can be reduced to lower than 250°C without repetitive reheating and a warm-rolling temperature and improved process ability can be achieved.8)
Several studies had concentrated on warm rolling process of Mg alloy sheet with heated rolls. Cai et al.9) analyzed the induction heating process of roll based on 2-D finite element method and the feasibility of warm rolling technology with heated roll was demonstrated. However, the deformation behavior of Mg alloy sheet during rolling process is not reported. Yu et al.10) studied the warm rolling process of AZ31 alloy using thermal-mechanical finite element simulation, and the influences of process parameters on the thermal field and the mean temperature of magnesium alloy sheet were analyzed. However, no experimental work was carried out for validation of the simulation results.
For the Mg alloy sheet with thickness less than 4 mm, the temperature of the deformation zone was one of the most important parameters during a warm rolling process with heated rolls. The outlet temperature was affected by the rolling process parameters, such as the sheet temperature, rolls temperatures, rolling speed, initial sheet thickness and thickness reduction. However, systemically study of such factors and method for outlet temperature control are still lack for the control of rolling defects and sheet quality. In this paper, a method combing FEM and a mathematical model is proposed to predict the outlet temperature and validated by experimental work, which can be used for rolling schedule design to get objective outlet temperature.
It has been reported that induction heating technique had been used for heating rolls,7) similar method is used and the equipment has undergone several improvements which was also reported in.8)
As shown in Fig. 1(a), the square shape copper pipe was used as induction heater with a power of 40 kW, and it can quickly raise the temperature of roll surface to a constant value, which can be measured by thermal couple on five points with the same distance on the rolls and shown in Fig. 1(b). The heating equipment was assembled in rolling mill to get a setup for warm rolling with heated rolls. As is shown in Fig. 2, the setup contained a 4-high rolling mill assembled with the induction heater and two hydraulic tension cylinders at the entrance and outlet of the mill.
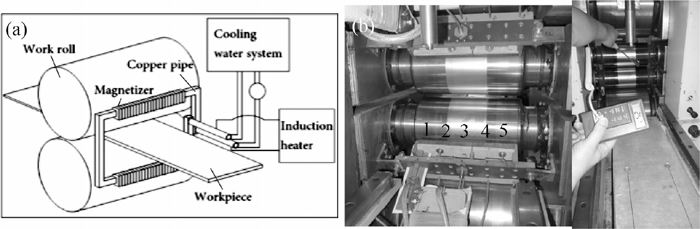
Schematic of the induction heater for rolls8) (a) drawing (b) measurement of roll surface temperatures.

Schematic diagram and photo of the experimental mill (a) Schematic diagram 1- Silicon controlled rectifier, 2- Transformer, 3- Thermometric indicators, 4- Work piece, (b) photo.
Commercial AZ31 alloy sheets with an initial size of 4 mm×150 mm×1000 mm (thickness, width and length) were used for rolling experiments. The sheets on the mill were heated as a resistance element, by electric voltage supplied at both ends by the online resistance heating device. The temperatures of sheets were closed-loop controlled in the range of 200°C–300°C with a difference not more than ±3°C.
The rolls with the same diameter of 200 mm were heated by the induction heating device prior rolling. The two rolls had the same temperature value which was controlled in the range of 100°C–200°C.
Orthogonal experimental plan was designed and rolling experimental conditions was summarized in Table 1 with various roll temperature, sheet temperature, rolling speed, initial sheet thickness and reduction respectively. The levels of rolling conditions can mainly cover the upper and lower limits of different rolling parameters for warm rolling of AZ31 sheets. And 25 experiments were carried out in all.
| Experiment No. | Roll temperature °C | Sheet temperature °C | Rolling speed m·s−1 | Initial thickness mm | Thickness Reduction % |
|---|---|---|---|---|---|
| 1 | 100 | 200 | 0.1 | 1 | 15 |
| 2 | 100 | 225 | 0.12 | 1.5 | 20 |
| 3 | 100 | 250 | 0.14 | 2 | 25 |
| 4 | 100 | 275 | 0.16 | 3 | 30 |
| 5 | 100 | 300 | 0.18 | 4 | 35 |
| 6 | 125 | 200 | 0.12 | 3 | 25 |
| 7 | 125 | 225 | 0.14 | 4 | 30 |
| 8 | 125 | 250 | 0.16 | 1 | 35 |
| 9 | 125 | 275 | 0.18 | 1.5 | 15 |
| 10 | 125 | 300 | 0.1 | 2 | 20 |
| 11 | 150 | 200 | 0.14 | 1.5 | 35 |
| 12 | 150 | 225 | 0.16 | 2 | 15 |
| 13 | 150 | 250 | 0.18 | 3 | 20 |
| 14 | 150 | 275 | 0.1 | 4 | 25 |
| 15 | 150 | 300 | 0.12 | 1 | 30 |
| 16 | 175 | 200 | 0.16 | 4 | 20 |
| 17 | 175 | 225 | 0.18 | 1 | 25 |
| 18 | 175 | 250 | 0.1 | 1.5 | 30 |
| 19 | 175 | 275 | 0.12 | 2 | 35 |
| 20 | 175 | 300 | 0.14 | 3 | 15 |
| 21 | 200 | 200 | 0.18 | 2 | 30 |
| 22 | 200 | 225 | 0.1 | 3 | 35 |
| 23 | 200 | 250 | 0.12 | 4 | 15 |
| 24 | 200 | 275 | 0.14 | 1 | 20 |
| 25 | 200 | 300 | 0.16 | 1.5 | 25 |
The tensions at both ends of the sheet were kept at 3.5 kN during all the rolling experiments. The rolls were cleaned after each experiment and heated before every pass. The outlet temperature of rolled sheet was measured by the thermometric indicators shown in Fig. 2(a).
The Microstructure of the AZ31 sheets after the warm rolling were examined by an optical microscope (Leica DM 2500M). The tensile tests were carried out on a universal testing machine (CMT5105-SANS) with stretching rate was 1 mm/min. The shape and size of the tensile sample was shown in Fig. 3.

Schematic illustration of the tensile sample (The unit were mm).
Within the 25 experiments, the measured outlet temperatures and observed defects are summarized in Table 2. The outlet temperatures were in the range of 161°C−281°C as shown in the table.
| Experiment No. | Outlet temperature °C | Defect type | Max defect depth mm |
|---|---|---|---|
| 1 | 161 | Fracture | |
| 2 | 189 | Edge crack | 8.9 |
| 3 | 214 | Edge crack | 5.1 |
| 4 | 239 | Edge crack | 2.0 |
| 5 | 264 | No defect | |
| 6 | 202 | Edge crack | 7.7 |
| 7 | 224 | Edge crack | 4.0 |
| 8 | 213 | Edge crack | 4.7 |
| 9 | 248 | Edge crack | 0.8 |
| 10 | 233 | Edge crack | 2.1 |
| 11 | 214 | Edge crack | 4.5 |
| 12 | 227 | Edge crack | 4.0 |
| 13 | 253 | No defect | |
| 14 | 244 | Edge crack | 1.5 |
| 15 | 227 | Edge crack | 2.4 |
| 16 | 229 | Edge crack | 1.9 |
| 17 | 231 | Edge crack | 2.6 |
| 18 | 230 | Edge crack | 3.1 |
| 19 | 254 | No defect | |
| 20 | 279 | Pulling narrow | 1.0 |
| 21 | 247 | Edge crack | 1.5 |
| 22 | 249 | Edge crack | 0.5 |
| 23 | 254 | No defect | |
| 24 | 252 | No defect | |
| 25 | 281 | Pulling narrow | 2.0 |
Rolling defects including pulling narrow and edge cracks were found depend on outlet temperature. For the two experiments with highest outlet temperatures of 279°C and 281°C, pulling narrow defects occurred as shown in Table 2 and Fig. 4(a). When outlet temperature was lower than 244°C, obvious edge cracks occurred as shown in Table 2 and Fig. 4(b). The depth of edge cracks was also outlet temperature dependent. At outlet temperature of 161°C, the max depth of cracks was greater than 10 mm, as shown in Table 2, which could result in break. At outlet temperature of 239°C, the max depth of edge cracks was less than 2 mm, as shown in Table 2 and Fig. 5(b). With outlet temperature higher than 248°C, the rolled sheet had no edge cracks, as shown in Table 2 and Fig. 5(c).

The defects of warm rolled AZ31 sheets: (a) pulling narrow occurring in experimental No. 25, (b) edge cracks occurring in experimental No. 11.

Edge quality of the strip under different temperature and warm rolling process: (a) experiment No. 3 with serious edge cracks, (b) experiment No. 4 with little edge cracks, (c) experiment No. 5 without edge cracks, (d) the sheet of experiment No. 3 in warm mill, (e) burrs at the edges in warm rolling.
The optimal outlet temperature was found in the range of 253°C–264°C, when rolled sheet with good surface quality (which means no defects) can be achieved as shown in Fig. 5(d), and only burrs were generated at the edge as shown in Fig. 5(e), which could be cleaned before every pass to avoid sticking to the rolls.
Then the microstructure and tensile property were studied for rolled sheets. The samples from rolled sheets from experiment No. 3, No. 4 and No. 5 with outlet temperature of 214°C, 239°C and 264°C were selected for study.
The optical micrographs were shown in Fig. 6. Figure 6(a) shows the original grain structure of raw sheets, which was composed of irregular shaped grains and equiaxed grains mainly, with the grain size in the range of 10–35 μm. Figure 6(b) shows the grain structure for sample from experiment No. 3, the grain size distribution extremely uneven in the range of 1–35 μm with irregular coarse grains and some small grains because dynamic recrystallization occurs partially during the rolling process. Figure 6(c) shows the microstructure for sample from experiment No. 4, a lot of fine equiaxed grains can be found around the coarse grains, which implied the large content of dynamic recrystallization occurring. Figure 6(d) shows the microstructure of for sample from experiment No. 5, full of equiaxed grains relatively smaller than that in the raw sheets can be found which means fully dynamic recrystallization and grain growth occurring.

Microstructures of AZ31 magnesium alloy under different experiments: (a) raw material, (b) sample from experiment No. 3, (c) sample from experiment No. 4, (d) sample from experiment No. 5.
Table 3 shows the tensile test data of raw sheet and the three samples. The yield strength and tensile strength had been improved greatly by the three warm rolling processes. The yield ratio decreased from 0.863 to about 0.77, which was favorable for afterward sheet metal forming. The elongation of sample from experiment No. 3 sharply decreased from 21% to about 11.5% while remained about 20% in the sample from experiments No. 4 and No. 5, which can be related to the above mentioned microstructure features.
| Experiment No. | Yield strength MPa | Tensile strength MPa | Elongation % | Yield ratio |
|---|---|---|---|---|
| Raw | 164 | 240 | 21 | 0.863 |
| 3 | 228 | 295 | 11.5 | 0.773 |
| 4 | 213 | 273 | 21 | 0.78 |
| 5 | 208 | 268 | 19 | 0.776 |
So from the rolling experimental results, it can be seen that both the surface and internal quality of rolled sheet are sensitive to the outlet temperature during rolling process, so the control of outlet temperature is crucial for practical application of warm rolling process with heated rolls for Mg alloy sheets.
In this paper, a method combining FEM and a mathematical model is proposed and is discussed in the following paragraphs.
In this warm rolling process, the width of initial sheet 150 mm is much larger than the thickness 4 mm in maximum, so a two-dimensional model can be used as a plane-strain problem regarded for saving calculation time without losing much accuracy. The temperature variations of the deformation zone were simulated by commercial DEFORM-3D software, and the simulation conditions are set the same with experiments shown in Table 1. The tensions at both ends of the sheet were kept at 3.5 kN which is the same with experiments.
3.1. Materials ParametersThe thermal physical parameters for AZ31 sheets used in this work, such as Young’s modulus, thermal conductivity and specific heat are temperature dependent and the measured results using stand methods are shown in Table 4. The Poisson’s ratio, thermal expansion and emissivity of AZ31 sheets were set as 0.35, 2.2×10⁻⁵°C−1, and 0.2 respectively.10)
| Temperature °C | Young’s modulus GPa | Thermal conductivity W·m−1·°C−1 | Specific heat J·°C−1 |
|---|---|---|---|
| 25 | 45.0 | 77.1 | 1.05 |
| 100 | 42.5 | 87.3 | 1.13 |
| 200 | 40.2 | 97.0 | 1.17 |
| 300 | 38.8 | 106.1 | 1.21 |
| 400 | 37.0 | 111.6 | 1.26 |
The stress-strain curves of AZ31 sheets under different strain rates and temperatures were achieved by compression tests on a MMS-200 thermal-mechanical simulator (similar to Gleeble-1500) using the specimens with the dimensions of Φ8 mm×15 mm. The results were shown in Fig. 7. By introducing the Zenner-Hollomon parameter, the constitutive equation of AZ31 alloy can be described as the exponential expression:11)
| (1) |

True stress-true strain curves at the same strain rate under different temperatures: (a) 0.01 s−1; (b) 0.1 s−1; (c) 1 s−1; (d) 10 s−1.
Where,
The material of two work rolls was 86CrMoV7. J Mat Pro software was used to calculate its physical properties. The emissivity was 0.5512) and the other calculated material parameters were illustrated in Table 5.
| Temperature °C | Poisson’s ratio | Young’s modulus GPa | Thermal expansion 10−6°C−1 | Thermal conductivity W·m−1·°C−1 | Specific heat J·°C−1 |
|---|---|---|---|---|---|
| 150 | 0.287 | 209.78 | 11.85 | 45.69 | 3.73 |
| 200 | 0.289 | 207.50 | 12.04 | 44.62 | 3.86 |
| 250 | 0.291 | 204.88 | 12.22 | 43.47 | 3.97 |
| 300 | 0.293 | 201.81 | 12.41 | 42.26 | 4.28 |
| 350 | 0.295 | 198.24 | 12.58 | 40.95 | 4.34 |
The sheet was considered to be rigid-plastic body and 1/4 of sheet dimension used in experiments was meshed using tetrahedral mesh with 6852 elements and 2411 nodes.
3.3. Boundary ConditionsThe friction factor was set to 0.35 without lubricant.10) The room temperature was set to 15°C.
By comparing the measured sheet temperature during air cooling with numerical simulation results as shown in Fig. 8, the convective heat transfer coefficient between sheets and environment was identified as 0.0045 N·s−1·mm−1·°C−1. In the same way, by comparing the measured sheet temperature during rolling process with numerical simulation results, the interface heat transfer coefficient between rolls and sheets was identified as 20 N·s−1·mm−1·°C−1.

Simulated and measured temperature drop curve: 1- measured curve, 2- 0.009 N·s−1·mm−1·°C−1, 3- 0.005 N·s−1·mm−1·°C−1, 4- 0.045 N·s−1·mm−1·°C−1.
The influence of rolling parameters including sheet temperature, rolls temperatures, rolling speed, initial sheet thickness and reduction on outlet temperature was systemically simulated using the above FE model. And the relations between outlet temperature and rolling parameters are shown in Fig. 9.

The influences of the outlet temperature by the factors: (a) rolls temperatures, with the sheet temperature, speed, reduction and thickness to be 250°C, 0.10 m·s−1, 25% and 4 mm (b) sheet temperature, with the rolls temperature, speed, reduction and thickness to be 150°C, 0.10 m·s−1, 25% and 4 mm (c) speed, with the rolls temperature, sheet temperature, reduction and thickness to be 150°C, 250°C, 25% and 4 mm, (d) reduction, with the rolls temperature, sheet temperature, speed and thickness to be 150°C, 250°C, 0.10 m·s−1and 4 mm (e) thickness, with the rolls temperature, sheet temperature, speed and reduction to be 150°C, 250°C, 0.10 m·s−1 and 25%.
From Fig. 9, it can be observed that there is a linear relationship between the outlet temperature of deformation zone and the rolls temperatures and sheet temperature. When the rolling speed increases, the nonlinear changes of outlet temperature showed the synthetic functions of contact heat conduction and deformation heat caused by speed increases. Small changes occurred when the reduction changed from 15% to 35%. The outlet temperature had a non-linear increasing trend when the thickness increased from 1 mm to 4 mm.
To verify the influences of the rolls temperatures, the sheet temperature, speed, reduction and thickness were set to 250°C, 0.10 m·s−1, 25% and 4 mm respectively. Figure 10(a) shows the temperature variations of the deformation zone. As there will be obvious temperature gradient along sheet thickness direction caused by heat transfer between rolls and sheets and deformation induced heating effect in the sheets, which is the main factor influencing the outlet temperature, so the temperature evolution at three points representing different positions along thickness direction was investigated. When the rolls temperatures were 100°C, 150°C and 200°C, curves 1, 2 and 3 expressed the temperatures of the surface, 1/4 of thickness and center points in the sheet, respectively. It was found that the sheet temperature suffered a sudden drop in the deformation zone when the rolls temperatures were 100°C, owing to the heat transfer to the rolls. By contrast, a slight decrease occurred when the rolls temperatures were up to 200°C.

(a) the temperature field distribution of the deformation zone and the temperature evolution curves of the three points with different rolls temperatures: (b) 100°C, (c) 150°C, (d) 200°C.
The comparison of simulated outlet temperature and the experimental values under different rolling conditions and the deviation was within ±8°C , as shown in Fig. 11. So the finite element model is validated to get accurate prediction of outlet temperature.

Temperature error between simulation and experiment value of outlet temperature.
For engineering application, a more simple tool is needed other than FEM for outlet temperature prediction and control during rolling process. A mathematical model was proposed for establishing relation between outlet temperature and rolling conditions as follows:
| (2) |
Where TOutlet is the outlet temperature of the deformation zone, °C. TR is the rolls temperatures, °C. TS is the initial sheet temperature, °C. H is the initial sheet thickness, mm. V is the rolling speed, m·s−1. η is the reduction ratio. a2, b2, c1, c2, d1, d2, e1, e2 and γ are constant coefficients.
Using the simulated results data shown in Fig. 9, the constant coefficients in the mathematical model can be determined by multiple linear fitting and were listed in Table 6.
| a2 | b2 | c1 | c2 | d1 | d2 | e1 | e2 | γ |
|---|---|---|---|---|---|---|---|---|
| 0.428 | 0.463 | 1739.2 | −218.3 | 337.9 | −144.7 | −5.12 | 33.7 | 18.9 |
The calculated outlet temperature by the proposed mathematical model was compared with the simulated results, which is shown in Fig. 12. It can be seen that a high accuracy of 98% was achieved of the proposed mathematical model for prediction of outlet temperature under different rolling conditions within the range of this study, which verified the mathematical model and the parameter calibration.

Comparison of calculated outlet temperature using mathematical model with simulated results.
For the further validation of the mathematical model, objective outlet temperatures including 210°C, 240°C and 270°C which are different with the previous 25 experiment results are chosen for the AZ31 sheets warm rolled down to 1.5 mm after three passes. The rolls temperature, rolling speed, initial thickness and reduction are pre-set and the sheet temperature TS was designed by changing the Eq. (2) to the following:
| (3) |
Then new set of warm rolling experiments were carried out with pre-set sheet temperatures calculated by Eq. (3) and together with other conditions including rolls temperature, rolling speed, initial thickness and reduction during rolling process as shown in Table 7. “Set of Toutlet” is the setting value of the objective outlet temperature, “act of Toutlet” is the actual value of the outlet temperature detected by thermometric indicators during experiments. The errors between the setting and actual value are not more than ±10°C.
| Pass | TR °C | TS °C | v m/s | η % | H mm | Set of Toutlet °C | Act of Toutlet °C | |
|---|---|---|---|---|---|---|---|---|
| 1# | 1 | 120 | 200 | 0.1 | 32.3 | 2.71 | 210 | 217 |
| 2 | 120 | 225 | 0.14 | 27.9 | 1.95 | 210 | 218 | |
| 3 | 120 | 250 | 0.18 | 23.4 | 1.50 | 210 | 202 | |
| 2# | 1 | 160 | 275 | 0.1 | 32.5 | 2.70 | 240 | 246 |
| 2 | 160 | 300 | 0.14 | 27.7 | 1.95 | 240 | 241 | |
| 3 | 160 | 200 | 0.18 | 23.6 | 1.49 | 240 | 235 | |
| 3# | 1 | 200 | 225 | 0.1 | 32.8 | 2.69 | 270 | 280 |
| 2 | 200 | 250 | 0.14 | 27.4 | 1.95 | 270 | 277 | |
| 3 | 200 | 275 | 0.18 | 23.9 | 1.49 | 270 | 273 |
So the outlet temperature mathematical model developed in this paper can be used for rolling schedule design to get outlet temperature control even for multi-pass rolling. And the precision of the outlet temperature mathematical model is limited to the range of rolling speed and sheet thickness. If the thickness is greater than 4 mm, the model should be recalculated for the temperature difference between the surface and center.
(1) The warm rolling experiments AZ31 sheet with heated rolls shows that the outlet temperature is an import factor for quality control. Serious edge cracks, inhomogeneous organization and poor elongation were exhibited when the outlet temperature of the deformation zone was lower than 244°C, and pulling narrow occurs when outlet temperature is higher than 279°C.
(2) Thermo mechanically coupled finite element model for the Mg alloy sheet warm rolling process was established. The correlation between the FEM-calculated outlet temperature and experimental data verified the reliability of the FE model.
(3) A mathematical model was proposed based on the FE simulation results and accuracy of the mathematical model within ±10°C was verified by new designed experiments, which also indicated the ability of the proposed model in rolling schedule design for outlet temperature control.
The support of supported by the National Nature Science Foundation of China (Project 51274063); and Fundamental Research Funds for the Central Universities, China (Project N120407005) was acknowledged.