Abstract
Fatigue crack growth testing was carried out on Type304 stainless steel (Type304SS) at room temperature (RT) in mixed gasses controlled to various pressure levels of up to 70 MPa in order to measure changes in embrittlement sensitivity due to hydrogen partial pressure. At PH2 less than 3 MPa, as hydrogen partial pressure decreases, the crack growth rate (da/dN) of Type304SS decreased, and at PH2=5×10⁻⁵ MPa (50 Pa), it was 2.8 times higher than that in the air. The hydrogen partial pressure whose da/dN equals the rate in the air, which is the lower limit critical hydrogen partial pressure, was not observed. On the other hand, at PH2=3 MPa or higher, the da/dN reached approximately 20 times higher than in the air. There was an upper limit of the da/dN which no longer increases after hydrogen partial pressure reaches a certain level. From a conservative judgment, it is able to plan the fatigue life considering the da/dN at PH2=3 MPa as the upper limit; approximately 20 times higher than in the air.
1. Introduction
Austenitic stainless steel (SS) is widely used for devices and pipes where high-pressure industrial gasses are used, since it has good cold-working capabilities and corrosion resistance. Type316L (UNS S31603) SS is commonly used as material for equipment that handles hydrogen gas, due to less likelihood of hydrogen embrittlement.1) Type304 (UNS S30400) SS, although it is less expensive than Type316LSS and has excellent strength after cold working, is not used as material to handle high-pressure hydrogen gas due to embrittlement. Specifically, its mechanical properties deteriorate substantially in hydrogen gas at room temperature (RT).2,3,4,5) For Type304SS, elongation after fracture in 75 MPa hydrogen at RT decreases to approximately 30% of that in the air.5) Since Type304SS is metastable austenitic steel, local areas of austenite phase (γ phase) transform into deformation-induced martensitic phase (α’ phase) due to substantial plastic deformation. It is considered that Type304SS is embrittled in hydrogen gas due to interactions between transformation structures of α’ phase etc., generated in plastic regions at crack tips, and hydrogen.6)
Although Type304SS is embrittled in hydrogen gas, it is desirable from an economic standpoint to use this steel in place of Type316LSS as austenitic stainless steel materials for equipment that handles high-pressure atmosphere and inert gas that do not contain hydrogen. In addition, for equipment where hydrogen may be mixed into atmosphere or inert gas due to diffusion through permeable membranes or misoperation, Type304SS may be used if the mixed hydrogen concentration is low. To ensure the equipment safety, it is necessary to examine the critical hydrogen partial pressure that does not induce embrittlement, or the promotion and/or control of embrittlement by the mixed inert gas. Koide7) focused on tensile characteristics and tensile testing of Type304SS at slow strain rate, in mixed gasses controlled at various pressures up to 75 MPa at RT. It was demonstrated that the hydrogen embrittlement susceptibility of Type304SS was determined with the function of PH2 regardless of gas compositions, and that the critical PH2 where Type304SS is embrittled at RT is inferred to be between 0.05 and 0.1 MPa.
However in order to ensure the equipment safety it is especially important to understand the impact on fatigue characteristics as well as tensile. The effect of gaseous hydrogen to the embrittlement of austenitic stainless steel have been primarily evoluted based on tensile studies and the available data from fatigue testing are relatively scarce. This report focuses on fatigue characteristics, and fatigue crack growth testing was carried out on Type304SS at RT in mixed gas of 5% H2–Ar controlled at various pressures up to 60 MPa and in pure-H2 gas at 45 MPa and 70 MPa, in order to measure changes in embrittlement sensitivity due to hydrogen partial pressure.
2. Tests
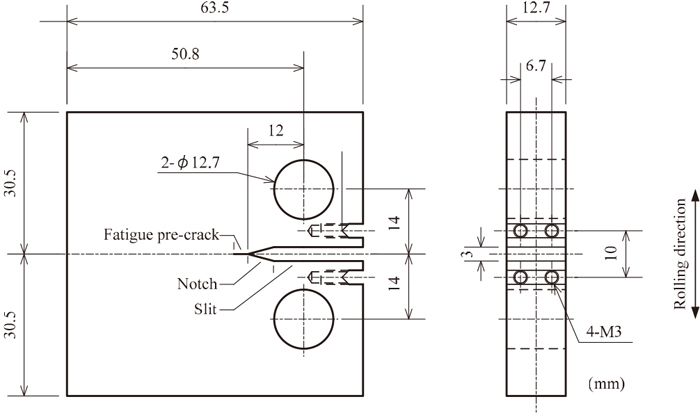
Type304SS available on the market was used as sample materials. In Table 1, (a) shows chemical compositions and (b) shows mechanical properties. Specimens were in the shape and dimension of 1/2 CT as shown in Fig. 1, and sampled perpendicularly in the rolling direction. After the 2-mm pre-crack was introduced on the specimen in the air at RT, specimens were used for fatigue crack growth testing in the air and hydrogen gas.
Table 1. Chemical composition and mechanical properties of Type304SS.
(a) Chemical composition (mass%)
| C | Si | Mn | P | S | Ni | Cr |
|---|
| 0.03 | 0.51 | 0.93 | 0.033 | 0.002 | 8.11 | 18.13 |
(b) Mechanical properties
| Yield strength (MPa) | Tensile strength (MPa) | Elongation (%) |
|---|
| 259 | 655 | 58 |
Fatigue crack growth testing was performed at various hydrogen partial pressures using the device shown in Fig. 2. This device has a pressure sealing container with a bellows mechanism under the pressure vessel to improve the O-ring durability at the sealing area, through equalization of hydrogen gas pressure inside the pressure vessel and nitrogen gas pressure inside the bellows sealing container. For load measurement the internal load cell was used, since it is not affected by the frictional force on O-rings at sliding area. The crack length was calculated by the Saxena equation8) using the unloading compliance method. The crack opening displacement (COD) was measured by using detection sticks and differential transformers in fatigue crack growth testing. The detection sticks were attached to the opening part of the CT specimen, and the detection stick displacement (which changes along with the specimen opening) was measured with the differential transformers mounted on the outside of the pressure vessel. The measured COD of CT specimen was transferred to the crack length.

Table 2 shows types of gasses used in the fatigue crack growth testing, and hydrogen partial pressures corresponding to the pressure in vessel. In this paper, hydrogen gas pressure is shown as absolute pressure. After a specimen was set up on a jig inside the test pressure vessel, pure N2 gas was pressurized to 3 MPa and then the pressure was reduced. After this procedure of pressurization and release was repeated three times, 5% H2–Ar mixed gas or pure H2 gas was used to perform the same pressurization and release operation three times. The test gas was filled from the cylinder through a compressor until the prescribed pressure was reached inside the pressure vessel. In both tests, highly pure H2 gas (purity of 99.99999% or higher) was used. To realize an environment with 0.001 MPa of 5% H2–Ar, 0.1 MPa of 5% H2–Ar was diluted to one-hundredth concentration. Pure N2 was added to the pressure vessel filled with 0.1 MPa of 5% H2–Ar, and was pressurized to reach 1.0 MPa. The pressure was then reduced to 0.1 MPa and pure N2 was again added. After being pressurized to 1.0 MPa, the pressure was reduced to 0.1 MPa to create an environment for 0.001 MPa of 5% H2–Ar.
Table 2. List of fatigue crack growth testing conditions: types of gasses used, levels of pressure in vessel and corresponding hydrogen partial pressure applied in fatigue testing.
| Types of gasses used | Levels of pressure in vessel (MPa) | Partial pressure (MPa) |
|---|
| Air | 0.1 | – |
| 5% H2–Ar | 0.001 | 0.00005
(50 Pa) |
| 0.1 | 0.005
(5 kPa) |
| 60 | 3 |
| pure-H2 | 45 | 45 |
| 70 | 70 |
In the testing, a sine wave load between 0.8 and 8 kN was controlled to create the R ratio of 0.1. Testing frequency of 0.1 Hz was used in hydrogen. On the other hand, in the air, 1 Hz was used to shorten the test period since the testing frequency would not affect the crack growth testing results of Type304SS.9) After the fatigue crack growth testing was completed, the specimens were forcefully fractured to observe areas where fatigue cracks were propagated, using a scanning electron microscope (SEM).
3. Results
3.1. Relationship between the Number of Cycles and Crack Lengths
Figure 3 shows results at PH2=50 Pa and PH2=3 MPa as typical examples of the relationship between the number of cycles and crack lengths measured in the fatigue testing. The crack length of CT specimen includes the lengths of slit, notch and pre-crack according to the Saxena equation.8) The crack length when the number of cycles reached 0.35×10⁴ (3500) was 25.74 mm at PH2=50 Pa, and 33.66 mm at PH2=3 MPa. The stress intensity factor range (ΔK) was calculated from the crack growth measured with the formula defined in ASTM-E647.
3.2. Changes in Crack Growth Rate by Hydrogen Partial Pressure
Figure 4 shows the relationship between crack growth rates (da/dN) and stress intensity factor range (ΔK) measured in the fatigue testing under each condition. The da/dN and ΔK in hydrogen and air showed a linear relationship on double logarithmic charts, and their inclinations were almost same.

Figure 5 shows the relationship between the relative crack growth rate and hydrogen partial pressure. To clarify the impact of hydrogen on the da/dN, the relative crack growth rate was calculated based on the da/dN in the air. The da/dN at each hydrogen partial pressure in ΔK=30 MPa·m1/2 was divided by the da/dN in the air to calculate the relative crack growth rate, (da/dN)H2/(da/dN)air. The relative crack growth rate becomes bigger than 1.0, which means the da/dN of the CT specimen under the testing environment is accelerated more than the rate in air. The relative crack growth rate was determined to be the function of hydrogen partial pressure PH2. At PH2 less than 3 MPa, as PH2 decreases, the da/dN of Type304SS decreased. At PH2=5×10⁻³ MPa (5 kPa), the relative crack growth rate was 7.5 times compared to the rate in the air. Even at PH2=5×10⁻⁵ MPa (50 Pa), the lowest among the conditions used in this test, the da/dN decreased by 2.8 times. The following equation was obtained between the relative crack growth rate and PH2 at 3 MPa or less; (da/dN)H2/(da/dN)air=16.6×PH20.17. On the other hand, at PH2= 3 MPa or higher, the relative crack growth rate was almost constant even if PH2 increased. The upper limit of the da/dN was observed. At PH2=3 MPa, the relative crack growth rate was 16 times compared to the rate in the air, and PH2=45 MPa and 70 MPa it was 21 times and 18 times respectively, almost at the same level as PH2=3 MPa. Itoga et al examined the da/dN of SUS304SS in 115 MPa hydrogen gas at RT, and reported that it accelerated approximately 10 times more than the rate in the air.9)

Figure 6 shows fracture surfaces in the center of plate thickness of specimens after fatigue crack growth testing. Fracture surfaces changed as hydrogen partial pressure increased. As shown in Fig. 6(a), in the air clear striation was observed in the area identified by a black arrow. At PH2=5×10⁻⁵ MPa (50 Pa), as shown in Fig. 6(b), the interval of striation was found to be wider than that in the air. At PH2=5×10⁻³ MPa (5 kPa), as shown in Fig. 6(c), striation is no longer observed, and at PH2=3 MPa, as shown in Fig. 6(d), a subcrack was observed (area identified by a white arrow). Fracture surfaces of PH2=45 MPa and 70 MPa were similar to that of Fig. 6(d), with no striation, and subcracks were observed.
4. Discussion
As shown in Fig. 5, the relative crack growth rate of Type304SS under various hydrogen partial pressures was higher than the rate in the air, specifically 2.8 times higher even at the low hydrogen partial pressure of PH2=5×10⁻⁵ MPa (50 Pa). Although the relative crack growth rate increases as PH2 increases, it becomes almost constant at PH2=3 MPa or higher, to be approximately 20 times higher. As for the striation in the specimen’s fracture surfaces, its interval became wider as the hydrogen pressure increased. Above the pressure of PH2=3 MPa, the any striation were not observed and subcracks were generated. From this it was demonstrated that the da/dN of Type304SS at RT was controlled by hydrogen partial pressures. There is an upper limit of da/dN which no longer increases when hydrogen partial pressure increases beyond a certain level. On the other hand, the hydrogen partial pressure whose da/dN equals that in the air, which is the lower limit critical hydrogen partial pressure, was not observed.
The da/dN of Type304SS didn’t increase at PH2=3 MPa or higher. Therefore, it is able to plan the fatigue life considering the da/dN at PH2=3 MPa as the upper limit; approximately 20 times higher than in the air. The upper limit of da/dN was also observed at carbon steels of SCM435,10) SNCM43911) and SM490B.12) The upper limit of da/dN might be the common phenomena for steel material. On the other hand, at less than PH2=3 MPa the da/dN decreased as PH2 decreased. The relationship of (da/dN)H2/(da/dN)air=16.6×PH20.17 was recognized between the relative crack growth rate and the partial hydrogen pressure. PH2 is calculated to be 4.9×10⁻⁸ MPa by extrapolating the relationship when the relative crack growth rate is equal to 1.0. On the other hand, the hydrogen concentration in standard air is 50×10−6%.13) Calculating PH2 in air by the hydrogen concentration, PH2 becomes 0.1 MPa×50×10−6×10−2= 5.0×10⁻⁸ MPa. In short, “PH2, 4.9×10⁻⁸ MPa, calculated by extrapolating the relationship when the relative crack growth rate is equal to 1.0.” is nearly equivalent to “PH2 in the air, 5.0×10⁻⁸ MPa, calculated by the hydrogen concentration in standard air.” Because the two values agree very much, the da/dN of Type304SS is considered to be controlled by very small PH2 in the air.
If the hydrogen diffusion coefficient of Type304SS at RT is 3.40×10⁻¹²cm2/s,14) the average depth of hydrogen penetration into the material is calculated to be 3 μm during the fatigue crack growth test which started and finished for about 5 hours. In a word, it is thought that the area where the penetrating diffusion hydrogen takes interaction with α’ and structure corresponding to its precipitate in the hydrogen embritteled austenite stainless, is limited on a surface layer. Since the interval is short from new surface layer formation to next surface layer destruction during the crack propagation, it is assumed that hydrogen penetrates hardly into the material and adsorb on the surface. If the crack propagation is controlled by chemical adsorption of hydrogen to the surface, the influence of hydrogen partial pressure to the crack propagation can be explained. At PH2 less than 3 MPa, it was thought that the crack propagation was accelerated because the adsorption process became the rate-limiting process by which the coverage with hydrogen adsorption was partial and it increased as the hydrogen partial pressure increased. On the other hand, at PH2=3 MPa or higher, it was thought that the da/dN was restrained and become almost constant because the coverage with hydrogen adsorption was high and it didn’t increase as the hydrogen partial pressure increased.
Lynch proposed the embrittlement model15) that the hydrogen which adsorbed on the crack tip caused the local plastic deformation and promoted the crack propagation, since the similarity between the fracture surface, by liquid metal embrittlement whose reaction site was limited on the interface, and one by hydrogen embrittlement. The crack of Type304SS in the high pressured hydrogen gas at RT may be also caused with the similar mechanism that the local plastic deformation was generated by the hydrogen adsorbed on the crack tip, and then the α’ formation at local spot and the similar structure change are accelerated, and the local deformation are further promoted by interaction these phases and hydrogen.
As shown in Fig. 6, the striations on fracture surfaces disappeared with increasing hydrogen partial pressure, and the subcracks were observed. The effect of hydrogen pressure on the morphology of fracture surface was reported by Yoshikawa et al.12) According to the fatigue crack growth test on carbon steel SM490B at hydrogen pressure from 0.1 MPa to 90 MPa, the morphology of fracture surfaces was changed to be flat and the striation was not observed clearly with increasing hydrogen pressure. It is thought that the striations were more difficult to observe than in air, because the crack closure plastic deformation zone is concentrated to the crack tip by hydrogen and does not become large. The similar phenomenon is also observed on the fatigue crack test in air with hydrogen-charged specimens of SUS304.16) In this study, the change of fracture surfaces is estimated as follows. The coverage with hydrogen adsorption increased as the hydrogen partial pressure increased. Then the local plastic deformation was promoted and the plastic deformation zone did not become large, and the striations disappeared. Furthermore the crack propagation promoted by hydrogen caused the subcacks.
5. Conclusion
(1) As hydrogen partial pressure increases, crack growth rates of Type304SS increased. At PH2=50 Pa (5×10⁻⁵ MPa), it was 2.8 times higher than that in the air, and at PH2=3 MPa or higher, it reached approximately 20 times higher than in the air.
(2) The da/dN of Type304SS is controlled by hydrogen partial pressure at RT, and there is an upper limit of da/dN which no longer increases after hydrogen partial pressure reaches a certain level. However, the hydrogen partial pressure whose da/dN equals the rate in the air, which is the lower limit of the da/dN, was not observed.
(3) The da/dN of Type304SS didn’t increase at PH2=3 MPa or higher. Therefore, it is able to plan the fatigue life considering the crack growth rate at PH2=3 MPa as the upper limit; approximately 20 times higher than in the air.
References
- 1) 70 MPa Hydrogen Station Technology Standard Examination Committee Report, High pressure Gas Safety Institute of Japan, Tokyo, (2013), 29.
- 2) T. Omura, K. Kobayashi, M. Miyahara and T. Kudo: Zairyo-to-Kankyo, 55 (2006), 139.
- 3) T. Omura, H. Hirata, K. Kobayashi, M. Miyahara and T. Kudo: Zairyo-to-Kankyo, 57 (2008), 30.
- 4) G. Han, J. He, S. Fukuyama and K. Yokogawa: Acta Mater., 46 (1998), 4559.
- 5) K. Koide, T. Minami, T. Anraku, A. Iwase and H. Inoue: Zairyo-to-Kankyo, 63 (2014), 523.
- 6) J. Nakamura, M. Miyahara, T. Omura, H. Semba and M. Wakita: J. Soc. Mater. Sci., Jpn., 60 (2011), 1123.
- 7) K. Koide, T. Minami, T. Anraku, A. Iwase and H. Inoue: ISIJ Int., 55 (2015), 2477.
- 8) A. Saxena and S. J. Hudak, Jr.: Int. J. Fract., 14 (1978), 453.
- 9) H. Itoga, T. Matsuo, A. Orita, H. Matsunaga and S. Matsuoka: Trans. Jpn. Soc. Mech. Eng. Ser. A, 79 (2013), 1726.
- 10) T. Miyamoto, T. Matsuo, N. Kobayashi, Y. Mukaie and S. Matsuoka: Trans. Jpn. Soc. Mech. Eng. Ser. B, 78 (2012), 531.
- 11) A. Macadre, M. Artamonov, S. Matsuoka and J. Furtado: Eng. Fract. Mech., 78 (2011), 3196.
- 12) M. Yoshikawa, T. Matsuo, N. Tsutsumi, H. Matsunaga and S. Matsuoka: Trans. Jpn. Soc. Mech. Eng., 80 (2014), SMM0254 (in Japanese).
- 13) JIS W 0201: 1990, Standard atmosphere.
- 14) G. R. J. Caskey, Jr: Hydrogen Effects in Stainless Steel, Du Pont de Nemours (EI) and Co., Savannah River Lab, Aiken, SC, (1983), 1.
- 15) S. P. Lynch: Acta Metall., 36 (1988), 2639.
- 16) Y. Murakami, T. Kanezaki, Y. Mine and S. Matsuoka: Metall. Mater. Trans. A, 39 (2008), 1327.

