Abstract
The utilization of H2 in the ironmaking process is a potential option for a further reduction of CO2 emission from the blast furnace (BF). H2 promotes the reduction reaction of burden materials, but its influence on their reduction disintegration behavior remains unknown in detail. This study investigates its influence on the specified essential factors governing the reduction disintegration behavior of the iron ore agglomerates, i.e., iron ore sinters and pellets.
Reduction disintegration index (RDI) values were measured after the reduction of the agglomerate samples using the gas mixtures of CO–H2–CO2–N2. The mineral textures of reduced samples were observed using an optical-microscope and an electron probe micro-analyzer for the evaluation of reaction modes. Further, Thiele modulus (ϕ), which is considered as the index of reaction modes during reduction, was calculated using the measurement results. The calculated ϕ showed reasonable correlation with RMI values, which is one index of the reaction mode evaluated by an elemental analysis using EPMA. Disintegration does not make much progress when ϕ is larger than a certain limit value, whereas it proceeds significantly when ϕ is less than that value.
1. Introduction
Steel industry is confronted by important issues related to the CO2 emission and the degradation of iron ore property. In Japan, steel industry is responsible for approximately 14% of the total anthropogenic CO2 emissions,1) and within this value, 70% of anthropogenic CO2 is emitted from the BF ironmaking process.2) In order to reduce such emissions, H2 utilization technologies have been studied.3,4,5,6,7,8,9,10,11,12) However, there is a concern that the temperature of the shaft region of BF decreases because the reduction of iron ores by H2 is an endothermic reaction; the reduction disintegration of the iron ore agglomerates may become tangible. Murakami et al.8,9,10) examined the reduction disintegration behavior of iron ore sinters in the gas mixture of CO–CO2–H2–H2O–N2. The results showed that an addition of small amount of H2 increased reduction disintegration index (RDI) value, whereas further increase in the H2 concentration to 12% led to its decrease. In contrast, Takeuchi et al.11) reported that the influence of H2 gas on the reduction disintegration behavior is slightly different from the above results. Thus, there is some unclearness regarding the effect of H2 on the reduction disintegration behaviors.
Another issue is the decrease in the iron grade of iron ores.13,14) It causes an increase in slag volume, resulting in an increase in the reducing agent ratio of the BF.15) In contrast, the iron content in pellets is stable and higher compared with the sinter feeds, since their raw material is iron ore concentrates that are produced by a beneficiation process at their mining site. So, it is possible to reduce the slag amount using pellets. It is known that RDI values of pellets are lower than those of iron ore sinters.16) However, there have been few reports about the reduction disintegration behavior of the pellets. In order to increase the use of pellets, it is necessary to investigate their reduction disintegration behavior and mechanism under high H2 atmosphere.
The authors have examined the mechanism of reduction disintegration behavior of both iron ore sinters and pellets under high H2 atmosphere and reported the influence of reduction mode on the reduction disintegration behavior.17) However, the evaluation of reaction mode was only qualitative, and the relation between the reaction mode and reduction disintegration behavior was not clarified in detail. Therefore, the quantitative evaluation of reaction mode and reduction disintegration behavior, and their relation were examined in this study.
2. Experimental
2.1. Reduction and Drum Tests
The samples used in this study were two types of iron ore sinters with different compositions and three types of pellets with different basicity. Their chemical compositions and JIS-RDI values are listed in Table 1. These samples were sieved such that their grain size ranged between 10.0 and 15.0 mm. 500 ± 1 g of samples were subjected to the reduction test.17) The samples were first heated up to 823 K in an N2 gas stream with a flow rate of 15 NL/min and kept for 10 min. Subsequently, the gas was changed to a gas mixture, listed in Table 2, with the same flow rate, and the reduction test was carried out for 10, 20, and 30 min. After that, the gas was changed to N2 again, and the reduced samples were cooled down below 373 K.
Table 1. Chemical composition and JIS-RDI values of samples.
| Sample | T.Fe (mass%) | FeO (mass%) | SiO2 (mass%) | Al2O3 (mass%) | CaO (mass%) | C/S (−) | JIS-RDI (mass%) |
|---|
| Sinter A | 57.62 | 8.74 | 5.41 | 1.60 | 10.39 | 1.92 | 31.6 |
| Sinter B | 56.87 | 6.67 | 5.40 | 1.82 | 10.57 | 1.96 | 26.6 |
| Pellet A | 63.88 | 1.62 | 6.43 | 0.38 | 0.48 | 0.07 | 2.1 |
| Pellet B | 63.39 | 0.57 | 3.45 | 0.39 | 1.10 | 0.32 | 2.2 |
| Pellet C | 65.93 | 0.66 | 2.36 | 0.54 | 2.62 | 1.11 | 4.4 |
Table 2. Reducing gas compositions applied in this study.
| Case | Gas composition (vol.%) |
|---|
| H2 | CO | CO2 | N2 |
|---|
| 1 | 0 | 30 | 0 | 70 |
| 2 | 0 | 30 | 30 | 40 |
| 3 | 0 | 30 | 60 | 10 |
| 4 | 10 | 20 | 0 | 70 |
| 5 | 10 | 20 | 30 | 40 |
| 6 | 10 | 20 | 60 | 10 |
| 7 | 20 | 10 | 0 | 70 |
| 8 | 20 | 10 | 30 | 40 |
| 9 | 20 | 10 | 60 | 10 |
| 10 | 30 | 0 | 0 | 70 |
| 11 | 30 | 0 | 30 | 40 |
| 12 | 30 | 0 | 60 | 10 |
Disintegration tests of the reduced samples were conducted using a tumbling drum with an inner diameter of 130 mm and two lifters of 1 mm width at a rotation speed of 30 rpm for 30 min. Then, the sample was sieved using a 3 mm mesh to determine the weight of the sample with particle size larger than 3 mm. RDI values were calculated using the following equation:
|
RDI=(
1-
m
1
m
0
)
×100
,
| (1) |
where,
m0 is the weight of the sample after the reduction experiment, and
m1 is the weight of particles larger than 3 mm. The quantification of reaction mode during reduction was attempted by EPMA in the same way as previously reported for measurement reduction mode index (RMI).
17)
2.2. Derivation of Thiele Modulus during Low Temperature Reduction
In the previous study, it was revealed that reduction disintegration is promoted by the shift of reduction mode from topochemical to non-topochemical reaction due to increase in H2 and CO2 concentrations.17) In the present study, a quantitative evaluation of the reduction and disintegration behaviors of the pellets was attempted by introducing Thiele Modulus (ϕ). ϕ has been formulated using parameters such as gas diffusion coefficient and reaction rate,19) and the analysis methods of ϕ for high temperature reduction of pellets has been reported.24,25,26) However, no reports are available on the quantitative evaluation of reaction mode for low temperature reduction less than 800°C of iron ore agglomerates and an example of evaluating the relation between ϕ and reduction disintegration behavior. The relation between ϕ and low temperature reduction disintegration behavior was verified, and its correlation was investigated. As shown in Fig. 1, the concentration of the reducing gas component A (gas A) in the spherical particle decreases from the surface toward the center because of the reaction. The concentration distribution of gas A in the solid particle is controlled by ϕ, which is the function of the diffusion coefficient and reaction rate as shown by Eq. (2)
|
ϕ=
R
3
ρ
p
k
m
D
e,A
.
| (2) |
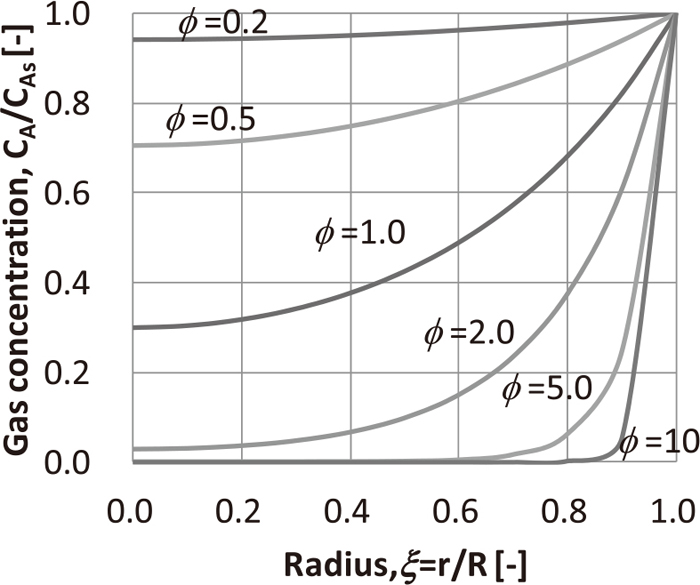
Figure 2 shows the concentration distributions of the gas A in the solid particles corresponding to different values of ϕ. For example, in cases wherein the reaction rate is higher than gas diffusion rate, i.e., high ϕ, most of the reaction is almost completed on the particle surface, and the reaction inside the particle does not proceed. Such a phenomenon corresponds to the topochemical reaction occurring for iron ore pellets that exhibits clear reaction interfaces. In contrast, in cases wherein ϕ is low, the reaction does not complete on the particle surface. Thus, the concentration of reaction gas gradually decreases toward the center, and the reaction proceeds inside the particle. This phenomena corresponds to a homogeneous reaction characterized by an unclear reaction interface. In general, the reaction mode is topochemical when ϕ > 10 or more, whereas it is non-topochemical when ϕ < 0.2 and 0.2 < ϕ <10 is a transition region.20,21)
In the general derivation method of ϕ, the reaction rate is treated as that per unit volume. However, the actual measurement of reaction rate is difficult during the reduction of pellets because the solid density changes as the reaction progresses, it is necessary to derive ϕ using the reaction rate per particle. Then, it is necessary to derive ϕ using “Actual overall rate of reaction” per particle. Here, effective factor (η), which is expressed by the ratio of the “Actual overall rate of reaction” to “Reaction rate calculated assuming that all interior surfaces are exposed to the same condition to the external surface of pellets” is derived using Eq. (3).20,21) Here, the modified ϕ is defined as shown in Eqs. (4) and (5). The solid and dashed lines in Fig. 3 show the relation between η and ϕ and between η and Φ, respectively. The ideal reaction rate (km) is not included in Φ. Hence, Φ is calculated considering the experimental conditions, and thus the results of the effective intraparticle diffusion coefficient (De,A) is known. Further, the value of ϕ is determined by the inverse calculation of Eqs. (4) and (5).
|
η=
(
-
r
m
)
k
m
C
As
=
4π
R
2
D
e,A
(
d
C
A
/dr
)
r=R
(
4/3
)
π
R
2
ρ
p
k
m
C
As
=
1
ϕ
(
1
tanh(
3ϕ
)
-
1
3ϕ
)
| (3) |
|
Φ=
ϕ
2
η=
ϕ
2
{
1
ϕ
(
1
tanh(
3ϕ
)
-
1
3ϕ
)
}
=ϕ(
1
tanh(
3ϕ
)
-
1
3ϕ
)
,
| (4) |
|
Φ=
ϕ
2
η=
(
R
3
ρ
p
k
m
D
e,A
)
2
(
-
r
m
)
k
m
C
As
=
(
-
r
m
)
R
2
ρ
p
9
D
e,A
C
As
.
| (5) |
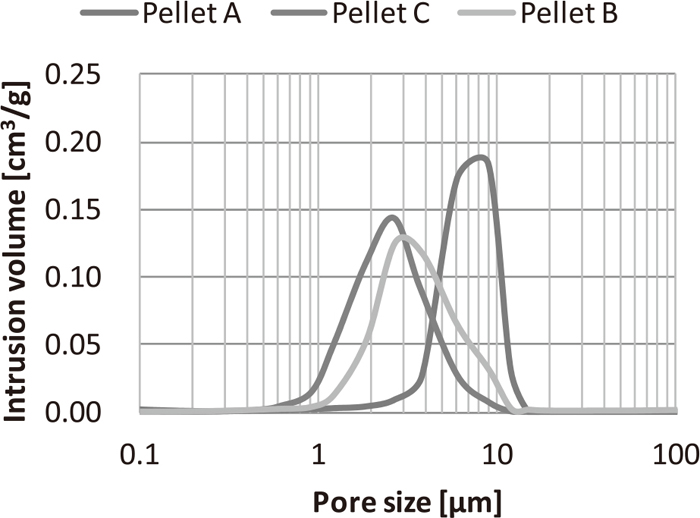
Density (ρp) and porosity (ε) of pellets were measured using mercury intrusion method. Figure 4 shows the pore-size distribution of three types of pellets used in this study. From these results, the standard deviation (σ) of the pore diameter was derived. Furthermore, the average pore diameter (re) was derived by Eq. (6) and the labyrinthine factor (τ) was derived by Eq. (7).27) The pore diameter distribution was measured five times, and each parameter was derived from the average value of pore diameter.
|
R
e
=
∑
j
R
j
h(
R
j
)log(
R
j
+Δr/2
R
j
-Δr/2
)
V
g
,
| (6) |
|
τ=
1
ε
+1.20
σ
2
R
e
.
| (7) |
Reaction rate (rm) was derived by Eq. (8) using weight change of iron ore pellets during the reduction test. The reaction interface moves toward the center as the reaction progresses in cases wherein the reduction of pellets and rm changes from moment to moment. So, it is necessary to set the reduction time (t) as a small value so that the radial position of the reaction interface does not change greatly to derive the initial rm of reaction. Thus, rm was derived with 300 s of reduction time (t) in this study.
|
r
m
=
(
m
s
-
m
t
)
2
M
O
m
s
t
.
| (8) |
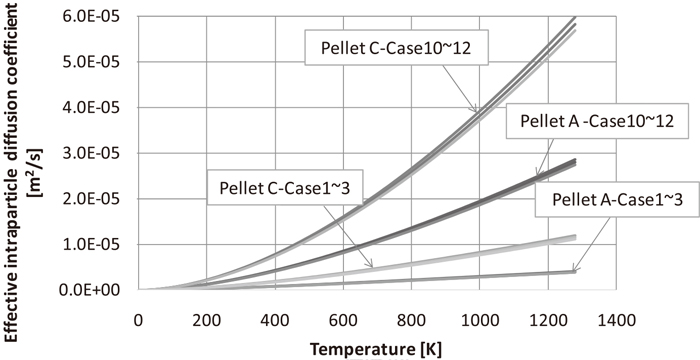
The effective intraparticle diffusion coefficient was derived by the equations from (9) to (13). The mutual diffusion coefficient of A and B (DAB) and molecular diffusion coefficient (DA) of the mixed gas is formulated by the Wilke equation expressed as Eq. (13)29) and Fujita Eq. (12),28) respectively. Figure 5 shows the relation between the intraparticle diffusion coefficient (De,A) and temperature with the intrusion of H2 and CO gas in the pellet. Compared to that of CO, the effective diffusion coefficient (De,A) of H2 becomes high since H2 has a high molecular diffusion coefficient (DA) and Knudsen diffusion coefficient (DKN). Meanwhile, De,A of acid pellet A showed higher values than that of pellet C. This is because the Knudsen diffusion coefficient (DKN) of pellet C was high because the pore diameter of pellet C is 5.5 μm and it is larger than 1.8-μm diameter of that of pellet A, as shown in Fig. 4. This indicated that the effective intraparticle diffusion coefficient of the gas changes depending on the pore structure of the pellet.
|
1
D
N
=
1
D
KN
+
1
D
A
,
| (10) |
|
D
KN
=3.067
r
e
T
Mj
,
| (11) |
|
D
AB
=
0.0067
T
1.83
P
{
(
T
C
P
C
)
A
1
3
+
(
T
C
P
C
)
B
1
3
}
3
1
M
A
+
1
M
B
,
| (12) |
|
D
A
=
1-
y
A
y
B
D
AB
+
y
C
D
AC
+
y
D
D
AD
+…
.
| (13) |
However, reduction of sinter comparably progresses non-uniformly since it has large and non-uniform pores, and complex multicomponent calcium ferrite phases.
17) From this view point, quantitatively evaluation of reaction mode by calculation of
ϕ and EPMA element mapping applied for only in the case of pellet in this study.
3. Results and Discussions
3.1. Influence of Gas Composition on RDI
Figure 6 shows the changes in RDI values with reducing gas composition. It was confirmed that the pellets reduced under the condition of ISO4694-1, i.e., without H2 gas were difficult to be disintegrated, as reported in previous studies.15) RDI values for the samples that were reduced using H2 gas were higher than those reduced using CO gas in all the cases. Furthermore, RDI values obtained by the reduction using the gas mixtures of H2 and CO were higher than the respective cases wherein CO and H2 reductions were performed.
3.2. Evaluation of Reduction Disintegration Behavior Using ϕ
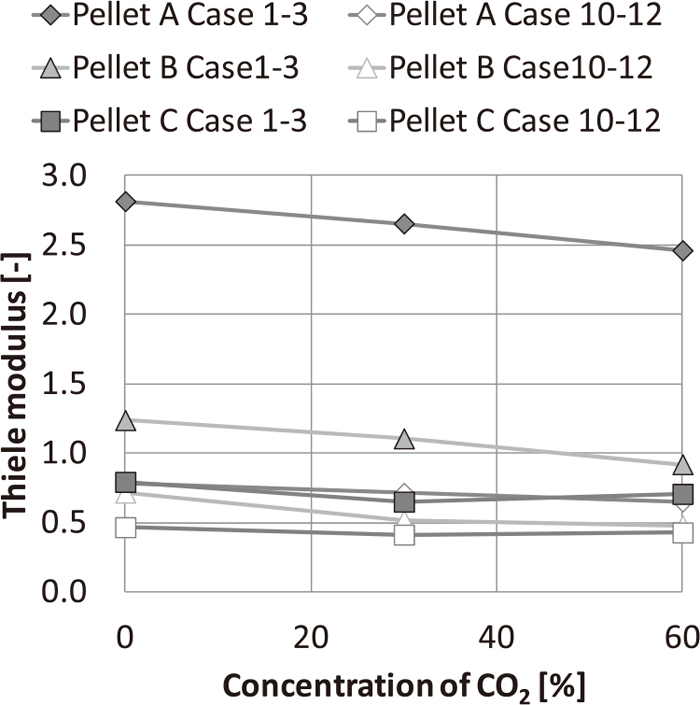
Figure 7 shows the relation between the reducing gas composition and ϕ. It was confirmed that ϕ decreases with an increase in H2 concentration and a decrease in CO2 concentration leading to non-topochemical reduction mode. This is due to the higher diffusion coefficient of H2 and the decrease in the reduction rate with increase in CO2 concentration. Meanwhile, ϕ of pellet A were smaller than those of pellets B and C. This is because the intraparticle diffusion coefficient (De,A) of the pellet A were higher as shown in Fig. 6, and the influence of the pore diameter on gas diffusion appears as described above.
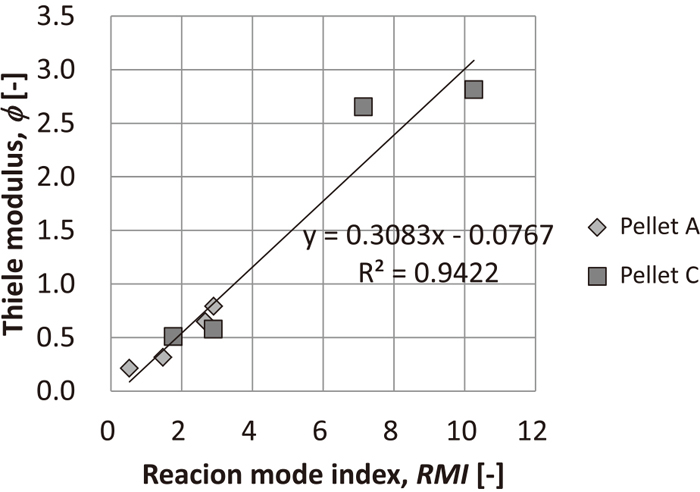
The relation between ϕ and the reaction mode index, which is the slope of the radial magnetite distribution measured by EPMA elemental analysis, is shown in Fig. 8. Here, RMI is ∞ in topochemical reaction, whereas it is 0 in non-topochemical reaction. These tendencies were also strongly correlated by the observation results that were previously reported.17) In cases wherein the reaction rate is higher than gas diffusion rate, i.e., high ϕ, most of the reaction is almost completed on the particle surface, thus RMI become high. In contrast, in cases wherein ϕ is low, the reaction does not complete on the particle surface, thus low RMI. Since such tendencies are not inconsistent with the previously reported observation results, it is supposed that the reduction mode of pellets could be sorted by the ϕ.
The relation between RDI value and ϕ evaluated by the reduction disintegration test results is shown as Fig. 9. In addition to the three types of pellets used in this study, the results for five commercial pellets reduced under the reduction gas condition of Case 1 (30% CO–70% N2) are also shown in the figure. In any case of the pellets and gas conditions, the RDI values increased when the value of ϕ decreased; particularly, the RDI values tend to rapidly increase when the value of ϕ was 0.7 or less. These results suggest that it is important to maintain the value of ϕ at 0.7 or higher by regulating the diffusion coefficient and/or the reaction rate via controlling the pore structure of the pellets and/or the gas composition/temperature profile of the blast furnace (BF).

Iwanaga reported30) that the deterioration curve of reduction disintegration was a quadratic function of reduction degree, as shown in Eq. (14), and its coefficients (a, b) are affected by the reduction temperature, particle size, and RDI value. Since all of these factors are influenced by the reaction mode, the reduction disintegration behavior was represented by Eqs. (15), (16), (17), (18) with the coefficients (a, b) as a function of ϕ.
|
ΔRDI=RDI-
RDI
BR
=a
f
s
2
+b
f
s
+c (
f
s
<11.1
)
,
| (14) |
when
ϕ < 0.7,
|
a=
-57.31
ϕ
2
+96.32ϕ-46.38
11.1
2
| (15) |
when
ϕ ≥ 0.7,
|
a=
1.98ϕ-9.37
11.1
2
| (17) |
where, RDI
BR is a weight fraction of the sample before reduction and after rotation experiment and
fs is a reduction degree.
Figure 10 shows the relation between RDI values estimated by applying Eqs. (14), (15), (16) and those obtained in this experiment and reduction degrees. Since a good correlation was observed between the experimental and the estimated values, RDI values can be estimated from the reduction degree and the ϕ; these values can be used for analyzing the fine ratio of sinter in the BF.
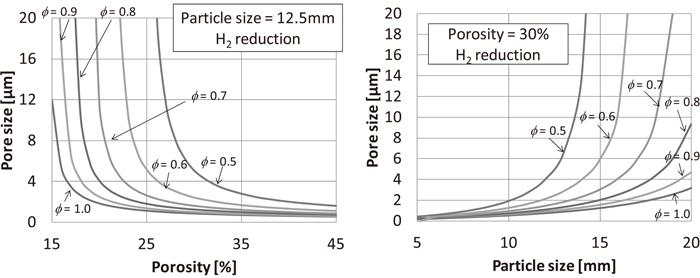
Figure 11 shows the relations between porosity and pore size, and particle size and pore size of pellets and ϕ at 550°C for H2 reduction. The small porosity and small pore size result in the lower diffusion coefficient leading to an increase in ϕ. Similarly, the smaller the particle size, the higher is the value of ϕ. Therefore, it can be expected that decreases in porosity, pore size, and particle diameter suppress the reduction disintegration phenomenon of BF burdens.
4. Conclusion
The quantitative evaluation of reaction mode and reduction disintegration behaviors of iron ore sinters and pellets and their relations were investigated. Quantitative relation between the reduction disintegration behavior and the reaction mode was obtained by introducing Thiele modulus ϕ. The results are summarized as follows:
(1) A quantified method to evaluate the reaction mode was proposed by applying a dimensionless number of ϕ. Smaller porosity or small pore size of the pellet causes lower effective intraparticle diffusion coefficient of reducing gas and higher value of ϕ. This indicates that the effective intraparticle diffusion coefficient of the gas changes depending on the pore structure of the pellet. There is a correlation between ϕ and RMI, which is an index of reaction mode evaluated by EPMA observation.
(2) Reduction disintegration behaviors of iron ore agglomerates are strongly influenced by their reaction mode, which are affected by the reduction conditions; topochemical reaction mode suppresses the reduction disintegration, whereas non-topochemical reaction mode promotes it. The increase in H2 and CO2 concentrations of the reducing gas led to non-topochemical reaction mode; therefore, its reduction disintegration phenomenon is promoted. Disintegration does not significantly progress with ϕ of 0.7 or greater, but it proceeds drastically with ϕ of 0.7 or less.
Nomenclature
CAs: Gas concentration at solid surface [mol/m3]
CA: Gas concentration at reaction interface [mol/m3]
De,A: Effective intraparticle diffusion coefficient [m2/sec]
DN: Pore-diffusion coefficient [m2/sec]
DKN: Knudsen diffusion coefficient [m2/sec]
DAB: Mutual diffusion coefficient of A and B [m2/sec]
DA: Molecular diffusion coefficient [m2/sec]
fs: Reduction degree [%]
km: Ideal reaction rate [m3/kg/sec]
ms: Sample weight before reduction [kg]
mt: Sample weight after t sec. reduction [kg]
M: Mass number [−]
n: Morality [mol%]
P: Pressure [N/m2]
PC_J: Critical pressure of j [N/m2]
rm: Actual overall rate of reaction [mol/kg/sec]
R: Solid radius [m]
Re: Average pore diameter [m]
R j: Pore diameter [m]
t: Reduction time [sec]
T: Temperature [K]
TC_J: Critical temperature of j [K]
Vg: Pore volume per solid unit mass [m3/kg]
W: Mass fraction [mass%]
X: Volume fraction [−]
ε: Porosity [−]
ϕ: Thiele modulus [−]
Φ: Modified Thiele modulus [−]
η: Effective factor [−]
ρp: Solid density [kg/m3]
σ: Standard deviation of pore size [m]
τ: Tortuosity factor [−]
yj: Morality of j [−]
References
- 1) Greenhouse Gas Inventory Office of Japan: The GHG Emissions Data of Japan (2015-4-23), http://www-gio.nies.go.jp/aboutghg/nir/nir-j.html, (accessed 2017-9-21).
- 2) M. Sato, T. Yamamoto and M. Sakurai: JFE Tech. Rep., 19 (2014), 103.
- 3) T. Miwa and H. Okuda: J. Jpn. Inst. Energy, 89 (2010), 28.
- 4) T. Akiyama, H. Sato, A. Muramatsu and J. Yagi: ISIJ Int., 33 (1993), 1136.
- 5) K. Higuchi, S. Matsuzaki and K. Saito: CAMP-ISIJ, 23 (2010), 94, CD-ROM.
- 6) Y. Ujisawa and T. Inada: CAMP-ISIJ, 23 (2010), 880, CD-ROM.
- 7) H. Nogami, Y. Kashiwaya and D. Yamada: ISIJ Int., 52 (2012), 1523.
- 8) T. Murakami, Y. Kamiya, T. Kodaira and E. Kasai: ISIJ Int., 52 (2012), 1447.
- 9) T. Murakami, T. Kodaira and E. Kasai: ISIJ Int., 55 (2015), 1181.
- 10) T. Murakami, T. Kodaira and E. Kasai: ISIJ Int., 55 (2015), 1197.
- 11) N. Takeuchi, Y. Iwami, T. Higuchi, K. Nushiro, N. Oyama and M. Sato: Tetsu-to-Hagané, 99 (2013), 448.
- 12) S. Watakabe, K. Miyagawa, S. Matsuzaki, T. Inada, Y. Tomita, K. Saito, M. Osame, P. Sikström, L. S. Ökvist and J. O. Wikstrom: ISIJ Int., 53 (2013), 2065.
- 13) K. Nagano: Bull. Iron Steel Inst. Jpn., 14 (2009), 643.
- 14) T. Murakami: CAMP-ISIJ, 29 (2016), 1, CD-ROM.
- 15) K. Katayama, H. Ito, M. Matsumura, A. Koike and M. Hoshi: CAMP-ISIJ, 29 (1997), 873, CD-ROM.
- 16) T. Inazumi, K. Shinada and M. Kawabe: Tetsu-to-Hagané, 68 (1982), 2207.
- 17) M. Mizutani, T. Nishimura, T. Orimoto, K. Higuchi, S. Nomura, K. Saito and E. Kasai: ISIJ Int., 57 (2017), 1499.
- 18) M. Mizutani, T. Nishimura, T. Orimoto, K. Higuchi, S. Nomura, K. Saito and E. Kasai: Proc. Iron & Steel Technology Conf. and Exposition (AISTech 2017), Association for Iron & Steel Technology, Warrendale, PA, (2017), 555.
- 19) E. W. Thiele: Ind. Eng. Chem., 31 (1939), 916.
- 20) G. F. Froment, K. B. Bischoff and J. D. Wilde: Chemical Reactor Analysis and Design, 3rd ed., John Wiley & Sons., Hoboken, NJ, (2011), 195.
- 21) Chemical Engineering Handbook, 7th ed., Maruzen Publishing, Tokyo, (2012), 75.
- 22) S. Ito, M. Ota, S. Nakazawa and T. Azaue: J. Min. Mater. Process. Inst. Jpn., 105 (1989), 951.
- 23) H. Scott Fogler: Elements of Chemical Reaction Engineering, 4th ed., Prentice Hall, Upper Saddle River, NJ, (2006), 813.
- 24) M. Ishida and C. Y. Wen: AIChE J., 14 (1968), 311.
- 25) T. Murayama and Y. Ono: Tetsu-to-Hagané, 73 (1987), 1323.
- 26) C. Kamijo: ISIJ Int., 57 (2017), 1797.
- 27) M. H. Abbasi, J. W. Evans and I. S. Abramson: AIChE J., 29 (1983), 617.
- 28) S. Fujita: J. Chem. Eng. Jpn., 28 (1964), 251.
- 29) C. R. Wilke: Chem. Eng. Progress, 46 (1950), 95.
- 30) Y. Iwanaga: Tetsu-to-Hagané, 68 (1982), 740.