3. Results and Discussion
3.1. Slag-metal Reaction Model
Kinetic model based on penetration and film theories is established to analyze the change of Ti, Al and Si in experiments.12) As shown in Fig. 2, the process controlling solute redistribution in molten metal is the reactions among Fe+FeO, Ti+TiO2, Al+Al2O3 and Si+SiO2. The concentration of FeO at slag-metal interface
C
(FeO)
*
is used to express the equilibrium of multiphase reactions.
3.1.1. The Reactions at Slag-metal Interface
If it is assumed that the reactions among Fe+FeO, Ti+TiO2, Al+Al2O3 and Si+SiO2 systems have reached equilibrium at the slag-metal interface, the thermodynamic parameters can be expressed by Eqs. (1), (2), (3), (4), (5), (6).8,9,10) Since the concentrations of MnO and Cr2O3 in molten slag are extremely low in the present experiment, the Mn+MnO and Cr+Cr2O3 systems are not considered. And because liquid iron is alloying element solvent, the transport of iron in metallic phase is discounted. Further, AlO1.5 is employed to simplify the calculation.
|
[Al]+1.5(FeO)=(
AlO
1.5
)+1.5[Fe]
| (1) |
|
[Si]+2(FeO)=(
SiO
2
)+2[Fe]
| (2) |
|
[Ti]+2(FeO)=(
TiO
2
)+2[Fe]
| (3) |
|
lg
K
Al
=lg
a
AlO
1.5
a
Al
⋅
a
FeO
1.5
=lg
γ
AlO
1.5
X
AlO
1.5
f
Al
[%Al]⋅
γ
FeO
1.5
X
FeO
1.5
=
22 604
T
-6.3265
| (4) |
|
lg
K
Si
=lg
a
SiO
2
a
Si
⋅
a
FeO
2
=lg
γ
SiO
2
X
SiO
2
f
Si
[%Si]⋅
γ
FeO
2
X
FeO
2
=
18 100
T
-6.372
| (5) |
|
lg
K
Ti
=lg
a
TiO
2
a
Ti
⋅
a
FeO
2
=lg
γ
TiO
2
X
TiO
2
f
Ti
[%Ti]⋅
γ
FeO
2
X
FeO
2
=
18 372
T
-5.122
| (6) |
Where γi and Xi are the activity coefficient and molar fraction of oxide component in molten slag; fi is the activity coefficient of alloying element in molten metal, and can be calculated by Eq. (7).
The first-order interaction parameters17) used in current work are listed in Table 3. The available second-order interaction parameters18,19,20) are expressed as
r
Al
Si
=−0.0006,
r
Si
Si
=(−0.0055+6.5/T),
r
Ti
Ni
=0.0005,
r
Al
Ni
=0.000164,
r
Al
Al
=(−0.0011+0.17/T),
r
Si
Cr
=0.00043,
r
Al
C
=−0.004,
r
Ti
Ti
=−0.001.
|
lg
f
i
=∑
(
e
i
j
w[%j]+
r
i
j
w
[%j]
2
)
| (7) |
Table 3. Activity interaction coefficients of the elements in present work.
|
e
i
j
| C | Mn | Cr | Ni | Si | Al | Ti |
|---|
| Al | 0.091 | 0.035 | 0.03 | −0.017 | 0.056 | 0.043 | 0.004 |
| Ti | −0.19 | −0.043 | 0.055 | – | −0.025 | 0.0037 | 0.042 |
| Si | 0.18 | −0.015 | −0.004 | 0.005 | 0.10 | 0.058 | 1.23 |
On the basis of the previous study5) and ion and molecule coexistence theory,13,14,15,16) the activity coefficient of each oxide component in slag γi can be measured after determining the slag composition (CaO–CaF2–Al2O3–SiO2–MgO–TiO2–FeO).
3.1.2. Slag-metal Reaction Mass Transfer Model
According to the description of penetration and film theories, the Ti mass transfer Eq. (8) can be obtained, and the derivational process has been studied in the previous study.12) For the same reason, the mass transfer model Eqs. (8), (9), (10), (11) are acquired.21)
|
-
d
C
[Ti]
dt
=
A
V
m
k
Ti
*
(
C
[
Ti
]
-
C
(
TiO
2
)
Ω
Ti
C
(FeO)
*2
)
| (8) |
|
-
d
C
[Al]
dt
=
A
V
m
k
Al
*
(
C
[
Al
]
-
C
(
AlO
1.5
)
Ω
Al
C
(FeO)
*1.5
)
| (9) |
|
-
d
C
[Si]
dt
=
A
V
m
k
Si
*
(
C
[
Si
]
-
C
(
SiO
2
)
Ω
Si
C
(FeO)
*2
)
| (10) |
|
d
C
(FeO)
dt
=
A
V
S
k
FeO
(
C
(FeO)
-
C
(FeO)
*
)
| (11) |
|
Ω
i
=
K
i
⋅
100
n
M
i
ρ
m
ρ
s
∑
w
iO
n
M
iO
n
γ
(FeO)
n
f
i
γ
iO
n
| (12) |
|
1
k
i
*
=
1
k
i
+
1
k
iO
Ω
i
C
(FeO)
*n
| (13) |
Where C[i] and C(iO) are the concentration of i in metallic phase and iO in slag phase, mol/m3;
C
(FeO)
*
is the concentration of FeO at the slag-metal interface; Mi and
M
iO
n
are the molecular weight of i in metal and iOn in slag;
w
iO
n
is mass fraction of iOn in slag; ρm and ρs are the densities of molten metal and slag; Ki is the reaction equilibrium constant, and can be calculated by Eqs. (4), (5), (6);
k
i
*
is the comprehensive mass transfer coefficient of i; ki and kiO are the mass transfer coefficients of i in metallic phase and iO in slag phase;
D
i
m
and
D
iO
w
are the molecular diffusion coefficients of i in metallic phase and iO in slag phase; A is the slag-metal interface; Vs is the volume of molten slag in ESR furnace; Vm is the volume of liquid metal within a time interval that a metal droplet drips from electrode to metal pool, respectively.
As the metal volume Vm is far less than the slag volume Vs during each metal droplet reacting with slag, the oxide component in slag would change very little within a time interval. Thus, the Eq. (16) can be obtained, and the mass transfer differential Eqs. (8), (9), (10), (11) can be integrated to Eq. (17). After solving the Eq. (17), the differential Eqs. (8), (9), (10), (11) are replaced with integral Eqs. (18), (19), (20), (21), which are also the mass transfer equations:
|
C
iO
w
=
C
iO
w,o
+
V
m
/
V
S
(
C
i
m,o
-
C
i
m
)
≈
C
iO
w,o
| (16) |
|
ln
C
i
m
-
C
iO
w,o
Ω
i
C
(FeO)
*n
C
i
m,o
-
C
iO
w,o
Ω
i
C
(FeO)
*n
=-
A
V
m
k
i
*
t
| (17) |
|
C
Ti
m
=EXP(
-
A
V
m
k
Ti
*
t
)
×(
C
Ti
m,o
-
C
TiO
2
w,o
Ω
Ti
C
(FeO)
*2
)
+
C
TiO
2
w,o
Ω
Ti
C
(FeO)
*2
| (18) |
|
C
Si
m
=EXP(
-
A
V
m
k
Si
*
t
)
×(
C
Si
m,o
-
C
SiO
2
w,o
Ω
Si
C
(FeO)
*2
)
+
C
SiO
2
w,o
Ω
Si
C
(FeO)
*2
| (19) |
|
C
Al
m
=EXP(
-
A
V
m
k
Al
*
t
)
×(
C
Al
m,o
-
C
AlO
1.5
w,o
Ω
Al
C
(FeO)
*1.5
)
+
C
AlO
1.5
w,o
Ω
Al
C
(FeO)
*1.5
| (20) |
|
C
FeO
w
=EXP(
A
V
S
k
FeO
t
)
×(
C
FeO
w,o
-
C
(FeO)
*
)
+
C
(FeO)
*
| (21) |
Where
C
i
m,o
and
C
iO
w,o
are the average concentrations of i in metallic phase and iO in slag phase, mol/m3; t is the metal-slag reaction time: te at the tip of electrode, td at the droplet, and tp at the metal pool, respectively.
As shown in Fig. 2 and Eqs. (1), (2), (3), according to the conservation law of oxygen atoms, the Eq. (22) is acquired. And then FeO at slag-metal interface
C
(FeO)
*
can be calculated from Eqs. (18), (19), (20), (21), (22).
|
2(
C
Ti
m,o
-
C
Ti
m
)+1.5(
C
Al
m,o
-
C
Al
m
)
+2(
C
Si
m,o
-
C
Si
m
)-
V
s
/
V
m
(
C
FeO
w,o
-
C
(FeO)
w
)=0
| (22) |
If this
C
(FeO)
*
and the appropriate mass transfer coefficients in metallic and in slag phases are given, reaction velocities of the respective system Fe+FeO, Ti+TiO2, Al+Al2O3 and Si+SiO2 can be obtained. Hence, the change of Ti, Al and Si with height of ingot can be obtained according to the Fig. 3. And the change of TiO2, SiO2 and Al2O3 during each time interval can be obtained from Eqs. (23), (24), (25).

It was assumed that the diffusion coefficient
D
i
m
on the metal side has an identical value for all the components. On the other hand, assuming that the diffusion coefficient for SiO2 on the slag side has different value from the other components, and is considered as
D
Si
O
2
=0.2×DFeO according to the reference.21) It is possible to acquire the diffusion coefficients based on the agreement with experimental results. Thus, the metal side diffusion coefficient
D
i
m
is considered as 6.75×10¹²exp(−71123/T) cm2/s,11) the slag side diffusion coefficient of the components other than silica
D
iO
w
is 0.05×exp(−12551/T) cm2/s,22) and the slag side diffusion coefficient of silica is 0.01×exp(−12551/T) cm2/s, respectively.
|
d
C
(TiO
2
)
=
V
m
V
s
(
C
Ti
m,o
-
C
Ti
m
)
| (23) |
|
d
C
(SiO
2
)
=
V
m
V
s
(
C
Si
m,o
-
C
Si
m
)
| (24) |
|
d
C
(Al
2
O
3
)
=
V
m
2
V
s
(
C
Al
m,o
-
C
Al
m
)
| (25) |
The slag-metal reaction model parameters necessary for the solution of Eqs. (18), (19), (20), (21), (22) are: (i) Geometric parameters: geometrical dimensions of the metal film at the tip of consumable electrode, metal droplet, and metal pool; (ii) Kinetic data: flow field of slag during ESR process, and the reaction time at the tip of consumable electrode, metal droplet and metal pool process; (iii) Distribution of temperature at the tip of consumable electrode, metal droplet and metal pool. The relevant parameters above can be calculated according to the previous study,12) and the results used for mass transfer model are listed in Table 4.
Table 4. Summary of mass-transfer coefficient, reacting time, and geometrical dimension during ESR process.
| Parameter | Location (reaction site) |
|---|
| Film/slag | Droplet/slag | Pool/slag |
|---|
| kSi, kAl, kTi, cm/s | 0.0070 | 0.22 | 0.042 |
| kAl2O3, kTiO2, kFeO, cm/s | 0.011 | 0.11 | 0.022 |
| kSiO2, cm/s | 0.0048 | 0.051 | 0.0097 |
| Reaction surface area, cm2 | 36.91 | 8.38 | 141.03 |
| Liquid metal volume, cm3 | – | 0.35 | 399.57 |
| Area/Volume, cm−1 | – | 24 | 0.35 |
| Residence time, s | – | 0.19 | – |
| Volume/Reaction time, cm3/s | 2.55 | 1.84 | – |
The liquidus temperature of 1Cr21Ni5Ti is considered as 1730 K (1457°C), which is calculated by Thermo-calc. To simplify the mass transfer model, the temperature at the tip of consumable electrode is set as constant temperature, 1750 K (1477°C), with a certain superheat.11) According to the measured results under the similar ESR condition in the reference,11) the temperature at the metal pool/slag interface is considered as 1950 K (1677°C) in the present study. The average temperature of falling metal droplets in slag layer are assumed to be 1950 K (1677°C), which is equivalent to metal pool/slag temperature.
The ESR process consists with two processes: the one is slag temperature rising period at the beginning of ESR process, and another is slag temperature being stable, which can be distinguished by the change of remelting rate during the whole ESR process. Since the slag temperature increasing rate at the beginning of ESR process is continually decreasing, the increment of slag temperature (TSlag) at the interface of droplet metal/slag and pool metal/slag in the first 780 seconds (13 cm height of the ingot) can be expressed by ellipse Eq. (26). And the change of molten metal pool volume (VPool) with time can also be determined by ellipse Eq. (27), as shown in Fig. 4.
|
(
t
time
-780)
2
780
2
+
(1 950-
T
Slag
)
2
200
2
=1
| (26) |
|
(
t
time
-780)
2
780
2
+
(
V
Pool
)
2
396
2
=1
| (27) |
As the consumable electrode is oxidized by air, the iron oxide at the surface of electrode is added into slag.23) The increment of iron oxide (IFeO) during each time interval can be determined on the total losses of all alloying elements (Al, Ti and Si) in remelted ingot during this time interval. Thus, the Eq. (28) is equivalent to the FeO increment per second, and the change of FeO increment per second with time is shown in Fig. 5. It is clear that the increment of iron oxide per second can be expressed by the line of IFeO=0.115 g/s.
|
I
FeO
=
W
m
⋅
M
FeO
(
2×
[%Si]
Ele.
M
Si
+
2×
[%Ti]
Ele
M
Ti
+
1.5×
[%Al]
Ele
M
Al
-
2×
[%Si]
Ingot
M
Si
-
2×
[%Ti]
Ingot
M
Ti
-
1.5×
[%Al]
Ingot
M
Al
)
| (28) |
Where: Wm is the mass remelting rate, g/s; Mi is the molar mass of i element.
3.3. Concentration Change of Al, Ti and Si in Experimental A
Based on the analysis above, the mass-transfer model of oxidation of alloying elements during ESR of stainless steel has been established. Figures 6, 7, 8 show the change curves of Ti, Al and Si along the height of ingot in experimental A, in comparison with the calculated results of numerical model established above. In Figs. 6, 7, 8 the experimentally determined concentration curves are shown together with the calculated results.
As shown in Figs. 6, 7, 8, after 80 g silica was added into molten slag at 5 th and 13 th minute during the ESR process (5 cm and 13 cm height of ingot), plenty of aluminum and titanium are oxidized into slag according to [Ti]+(SiO2)=(TiO2)+[Si] and 4[Al]+3(SiO2)=2(Al2O3)+3[Si].
As can be seen in Fig. 7(a), with the increase of slag temperature in the first 13 minutes (from 1750 K to 1950 K, 1477°C to 1677°C), the aluminum increases during 1–5 cm and 5–13 cm height of ingot, respectively. As the temperature increases in the first 13 cm height of ingot, the increase of lgK(Ti,Al) in Eq. (30) makes the lg
(
w
Al
4
/
w
Ti
3
)
(aluminum) have the rising trend in Exp.A. Thus, extra TiO2 should be added into molten slag in the first 13 minutes to keep the value of lg
(
w
Al
4
/
w
Ti
3
)
stable according to Eq. (30), which is carried out in Exp.B and Exp.C.
|
3[Ti]+2(
Al
2
O
3
)=4[Al]+3(
TiO
2
)
| (29) |
|
lgK(
Ti,Al
)
=lg
w
Al
4
⋅
f
Al
4
w
Ti
3
⋅
f
Ti
3
+lg
γ
TiO
2
3
⋅
X
TiO
2
3
γ
Al
2
O
3
2
⋅
X
Al
2
O
3
2
=-
35 300
T
+9.94
| (30) |
Based on the mass transfer model, Exp.B and Exp.C were carried out, and the results are shown in Figs. 9, 10, 11. As shown in Fig. 9(a), it is clear that: (i) the titanium ranges from 0.25% to 0.39% in Exp.B, while the titanium ranges from 0.33% to 0.42% in Exp.C; (ii) the aluminum is close to the line of 0.025% in Exp.B, while the aluminum ranges from 0.045% to 0.055% in Exp.C. Since the titanium in AISI 321 ranges from 5(C-0.02)% to 0.8% and the carbon content is 0.10%, the titanium in AISI 321 should range from 0.4% to 0.8%. Thus, the slag containing high CaO is appropriate to Drawing-Ingot-Type ESR of high-carbon AISI 321 stainless steel. Moreover, the remelting rate and titanium in electrode should be increased to guarantee the requirement of titanium in ingot, which will be investigated below.
3.5. Effects of Remelting Rate and Electrode Composition on Controlling of Al and Ti
3.5.1. Variations of Alloying Element under 66, 78 and 90 kg/h Remelting Rates24)
Based on the Eqs. (18), (19), (20), when diameters of water cooled copper mold and electrode are fixed, the t/Vm decreases with the increase of Wm. In order to investigate the influence of remelting rate on alloying element during Drawing-Ingot-Type ESR process, the numerical values of Ti, Al and Si along the height of ingot are calculated based on the model established above by using slag S3 under 66, 78 and 90 kg/h remelting rates. In each simulation experiment, 150 g TiO2 was added into molten slag in the first 7 minutes. The deoxidizer Al and SiO2 are added into molten slag during the whole ESR process: the Al and SiO2 addition rates are 2 kg t−1 and 1.8 kg t−1, respectively.
As can be seen in Fig. 12, the faster the remelting rate is, the more the titanium content in ingot there is. But the effect of remelting rate on variations of each alloying element is little.
3.5.2. Variations of Alloying Element under 0.7, 0.9 and 1.1% Ti in Electrode
As shown in Fig. 9(a), the titanium in ingot ranges from 0.33% to 0.42%. Unfortunately, the AISI 321 stainless steel requires titanium ranging from 0.4% to 0.8%. For example, the GH3044 requires titanium ranging from 0.30% to 0.70%, the 1Cr21Ni5Ti requires titanium ranging from 0.35% to 0.8%.
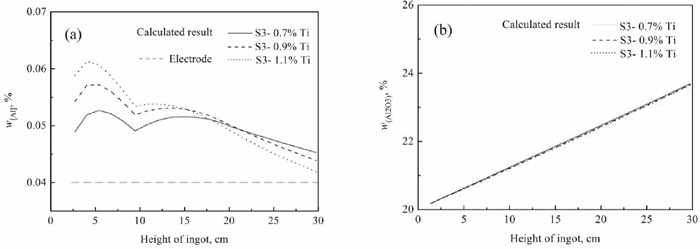
In order to discuss the effects of titanium in electrode on alloying element content in ingot during Drawing-Ingot-Type ESR process, the titanium content in electrode are assumed as 0.7%, 0.9% and 1.1%, respectively. In each simulation experiment, 150 g TiO2 was added into molten slag in the first 7 minutes, the deoxidizer Al addition rates is 2 kg t−1, and the remelting rate is about 90 kg/h during ESR process. It should be noted that the SiO2 addition rates are 1.8 kg t−1 under electrode with 0.7% Ti, 3.5 kg t−1 under electrode with 0.9% Ti, and 5.2 kg t−1 under electrode with 1.1% Ti, respectively. And then the corresponding results under the condition of different titanium content in electrode combined with slag S3 are calculated based on the mass transfer model, as shown in Figs. 15, 16, 17.
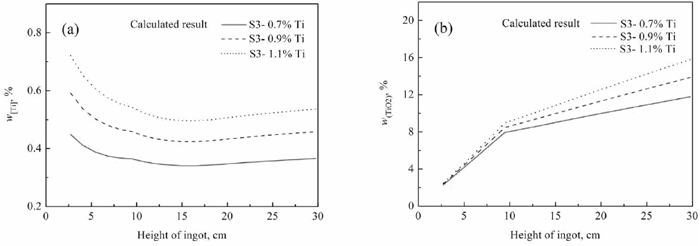
As shown in Fig. 15(a), when there is 0.7% titanium content in electrode, the titanium content in ingot ranges from 0.34% to 0.45%; in the case of 0.9% titanium content in electrode, the ingot containing 0.42%–0.59% titanium would be acquired; under the condition of 1.1% titanium in electrode, the titanium in ingot ranges from 0.50% to 0.72%.
The current work investigates the influence of CaO in molten slag on the change of Al, Ti and Si in ingot based on kinetics during Drawing-Ingot-Type ESR process. After selecting CaO content, the current work also studies the effects of remelting rate and titanium in electrode on the concentrations of titanium, aluminum and silicon in ingot further. This work focuses on providing slag mixtures, electrode and ESR process which can be used to control titanium and aluminum during Drawing-Ingot-Type ESR of steel containing Ti, Si and Al. In addition, it should be pointed out that the TiO2 in each experiment is larger than 10% in slag (shown in Fig. 15(b)), and the effect of slag composition on the surface quality of ingot would be investigated in a industrial Drawing-Ingot-Type ESR furnace based on this study further.