Abstract
Wear debris classification is of great significance for identifying machine wear states. In this paper, a method of wear debris classification using feature fusion and CBR is proposed. The method integrates local feature LBP, global feature FD and Tamura coarseness, and then the fused features are applied in CBR system with different weights and different similarity, which is adaptable, extendable, modular and fast. The results show that the subdivision of wear debris images into size 32*32 when calculating LBP is helpful for improving the classification, the combination of local features and global features can get better results. The comparative experimental results of different classification methods show that the CBR system has the shortest time-consuming while maintaining high classification accuracy.
1. Introduction
Wear debris are the friction particles suspended in lubricating oil in the friction pair of the equipment, carrying a lot of information about the running state of the machine, which can reflect and reveal the wear degree and wear mechanism of the machine. Analysis of wear debris allows for monitoring of the status as well as the long term trend of steel production equipment parts wear.1) It plays an important role in preventive measures that can help avoiding faults of steel production equipment.
In this paper, five typical wear debris images are studied: normal, fatigue, severe sliding, spherical and cutting wear debris. As shown in Fig. 1, the normal wear debris are flaky, the surface is smooth and small, and they usually deposited along the line of magnetic force distribution in the iron sheet. Fatigue debris is one of the more severe particles and is characterized by an irregular outline. There are obvious scratches and straight edges on the surface of severe sliding wear debris and the scratches are attached with black oxide. Spherical wear debris have obvious imaging characteristics of central and black bands. Cutting wear particles are normally small, no more than 50 μm in length, elongated and usually curved, and are often to be found in a new engine.2)

Most researches that classify the wear debris images are based on the specification of particular shape and color factors of debris.3,4,5,6) The features such as the long axis, short axis ratio, equivalent diameter, Euler number, deformity, gray-scale and color are calculated and used for classification.
In recent years, more and more researches about the classification of wear debris images are based on texture features.7,8,9) The texture features are a combination of discrete wavelet transform parameters and GLCM, the results showed that the classification based on texture was more efficient and accurate than that based on the size and shape of wear debris. It seems that the texture-based classification has great potential to become a very useful tool in the machine condition monitoring industry.
As for classifiers, artificial intelligence methods are commonly used.4,10,11) Machine Learning methods such as pattern recognition method of fuzzy clustering, CART method and artificial neural networks have become the premier candidate as the modeling tool. The experimental results showed that those AI methods are sufficient enough in predicting the equipment wear.
The research showed12) that the shape factor and color of the wear debris are not obvious for the severe sliding wear debris and fatigue wear debris. Besides, it’s difficult to extract shape factor due to the complicated background of wear debris images. Since the researches about texture features are showing better performance for classifying wear debris, the problem is how to select a suitable set of texture features. As for classifiers, wear classification relies on a knowledge base derived from human experts, case base reasoning system is adaptable, extendable, modular and fast, so it is more suitable for the interactive system than other Machine Learning methods. Therefore, a method of wear debris classification based on feature fusion and CBR is proposed.
2. Texture Features
At present, the typical features based on texture are Gray Level Co-occurrence Matrix (GLCM), Gabor filter, Local binary patterns (LBP), Tamura texture and fractal dimension (FD). GLCM is a matrix function of pixel distance and angle, with a wide selection of parameters and a large amount of computation. Gabor filter group has multiple scale parameters and direction parameters, so the computational cost is also large. Therefore, in this paper, LBP, FD and Tamura coarseness are selected to measure the texture features of wear debris.
2.1. Feature Fusion
LBP describes the texture from the local neighborhoods, which mainly focuses on the local features and has some loss of global information. However, the FD and the Tamura texture describe the texture features from a global perspective. Therefore, the combination of the three features can better classify the wear debris. The FD and Tamura coarseness are sensitive to different kinds of texture features. The FD offers the ability to describe and characterize the complexity of the images or more precisely of their texture composition in total, while coarseness is the texture feature, which describes the gray difference for adjacent areas. Sometimes, it is necessary to simultaneously use FD and Tamura coarseness rather than only one of them to achieve better classification results.
There are four typical wear debris shown in Fig. 2. The FD and Tamura coarseness are extracted from these images. As can be seen from Table 1, it’s hard to distinguish wear debris by the FD or Tamura coarseness. But it can be easily distinguished by combining the FD and Tamura coarseness. It shows that the combination of Tamura coarseness and FD is helpful for the classification of wear debris.
Table 1. The coarseness and FD of four kinds of wear debris.
| Wear debris type | spherical | normal | cutting | fatigue |
|---|
| Tamura coarseness | 14.03 | 15.50 | 16.86 | 16.86 |
| Fractal dimension | 2.24 | 2.24 | 2.32 | 2.42 |
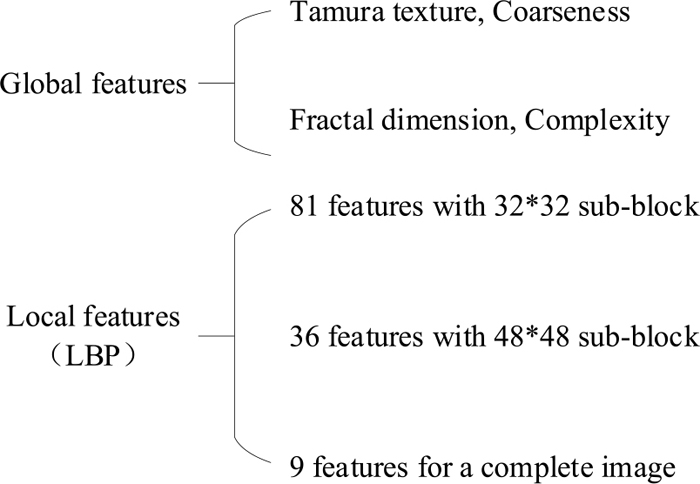
The fused texture features is shown in Fig. 3. Global features Tamura coarseness, FD and local feature LBP are fused to better classify wear debris. Sub-blocks partitioning strategy is used when extracting LBP features.
The fusing process is composed of the following four steps. First, LBP texture features of the original image are extracted. Division of LBP sub-blocks is used to extract LBP features, there are 81-dimensional (81-D) features with 32*32 sub-block, 36-dimensional (36-D) features with 48*48 sub-block and 9-dimensional (9-D) features for a complete image. Second, 1-dimensional (1-D) FD features of the original image is extracted. Third, 1-dimensional (1-D) Tamura coarseness is extracted. Last, the LBP features, 1-D FD features and 1-D Tamura coarseness are combined in the following manner.13)
|
{
T
Fused
83-D
=
T
LBP(32*32)
81-D
∪
T
Coarseness
1-D
∪
T
FD
1-D
T
Fused
38-D
=
T
LBP(48*48)
36-D
∪
T
Coarseness
1-D
∪
T
FD
1-D
T
Fused
11-D
=
T
LBP(96*96)
9-D
∪
T
Coarseness
1-D
∪
T
FD
1-D
| (1) |
Local binary pattern (LBP) is a texture description operator proposed by Ojala et al.14) in 1994, which has the advantages of rotation invariance, invariance of gray scale and simple calculation.
2.2.1. Uniform LBP
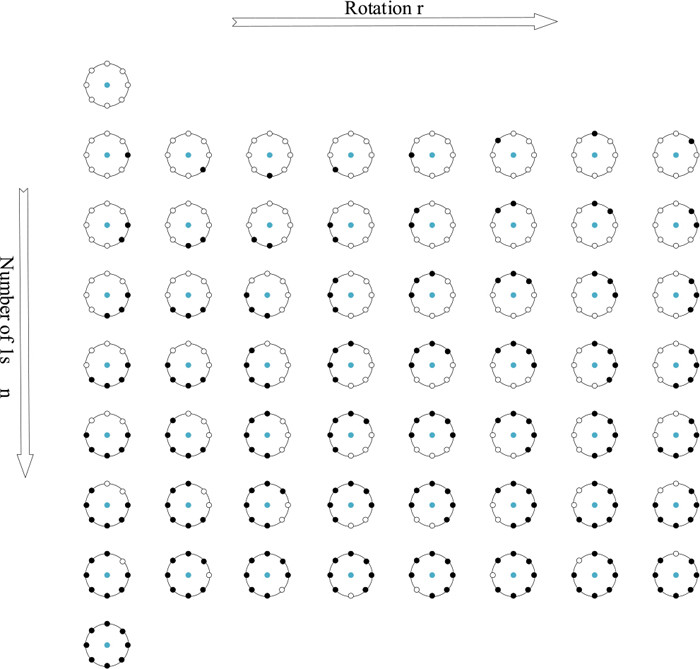
An LBP is uniform if it contains at most 1 - zero to one and 1 - one to zero transition in a circular manner. For example 11111111 (0 transitions), 00000001 (2 transitions) are uniform, whereas 11001100 (4 transitions) and 01010101 (8 transitions) are not uniform. Uniform LBP is treated as the fundamental properties of texture image, and there is 80% to 85% of the texture images contain only Uniform LBP.15) The number of uniform LBP patterns is P (P-1) + 2, P is the number of pixels in the field. For 8 sampling points, there are 58 kinds of output in the form of Uniform, and all the other values are 59th classes, so the histogram is reduced from the original 256 dimension to the 59 dimension, and it can reduce the influence brought by high-frequency noise. The 58 LBP patterns in Uniform format are shown in Fig. 4:16)
2.2.2. LBP with Rotation Invariance
Since the starting point of coding is certain, each binary coding mode will produce different coding results after being rotated. In order to form a rotation invariant coding mode, the coding result generated by rotation of the same coding mode is encoded as the same value, that is, the minimum value of these rotation results. In the uniform LBP (Fig. 4.), each row in the middle 7 rows is rotated and compiled into a coded value, which is added with all 1 s and all 0 s, for a total of 9 eigenvalues.
|
LB
P
P,R
riu2
={
∑
P=0
P-1
s(
g
P
-
g
C
)
P+1
if U(LB
P
P,R
)≤2
otherwise
| (2) |
Where P means the number of pixels in the field, R means the sampling radius, U corresponds to the number of spatial transitions, superscript riu2 corresponds to the use of rotation invariant ‘uniform’ patterns that have U value of at most 2. gC is the gray value of the center pixel while gP is the gray values of the eight surrounding pixels. s(x)=1 when x ≥ 0, s(x)=0 when x<0.
2.3. Fractal Dimension
As an important feature and measure method, FD can be used as a stable feature descriptor to describe the object, and it can combine the spatial information and gray information of the image. Therefore, FD has attracted much attention in image processing and analysis and got rapid development and extensive application.17) The research shows that the perception of coarseness and concavity in human visual system is closely related to the FD. So the FD of the image area can be used to describe the texture characteristics of the image area.18) How to estimate the FD accurately, the common algorithms include the box counting method of Keller,19) the differential box-counting (DBC) proposed by Sarkar and Chaudhuri,20) the blanket covering method based on morphological operators of Peli21) and so on. In this paper, DBC is used to calculate the FD.
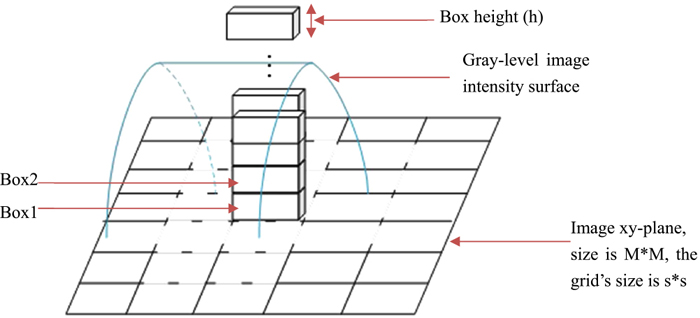
DBC is a fast, simple fractal calculation method. The Calculation principle of DBC is shown in Fig. 5.20) The main idea of the algorithm is to divide the M * M image into s * s grids
(
1<s<=
M
2
, s is an Integer
)
, r=s/M. Think of the image as a surface in 3D space, where xy are the plane positions and z is the grayscale value. The xy plane is divided into many s * s grids, each grid is a series of s * s * h boxes, h is the height of a single box,
h=
s*G
M
, where G is the total gray level. Assuming that the minimum and maximum values of the image gray in the (i, j) grid fall in the kth and the lth boxes, then:
Where nr is the number of boxes needed to cover the image in the (i, j) grid, and the number of boxes needed to cover the entire image is Nr:
|
N
r
=
∑
i,j
n
r
(i,j)
| (4) |
For different r, calculate the Nr, then use the least squares method to get D:
|
D=lim
log
N
r
log(1/r)
| (5) |
D is the required FD of the texture. Since D is the slope of the line corresponding to Nr and 1/r, it needs to change R and grid size many times to get multiple sample points, and get the final D by least squares fitting.
2.4. Tamura Coarseness
Based on the psychological research of human perception of texture, Tamura et al.22) put forward six components of texture, namely coarseness, contrast, direction, linearity, regularity and roughness, which correspond to six attributes of texture characteristics from psychological perspective. Among them, the texture coarseness is the highest level of texture visual perception, the most significant transformation of the underlying image features to high-level semantic features. In many algorithms for extracting texture coarseness, the research shows that the23) Tamura coarseness has better robustness and rotation invariance. Accordingly, in this paper, the Tamura coarseness is chosen as the texture parameter to measure wear debris.
The calculation of the coarseness is carried out in three steps. First, the average gray value of the pixels in the active window of 2k * 2k pixels in the sample image is calculated.
|
A
k
(x,y)=
∑
i=x-
2
k-1
x+
2
k-1
∑
j=y-
2
k-1
y+
2
k-1
g(i,j)/
2
2k
| (6) |
Where g(i,j) is the pixel gray value of the coordinate (i, j), k = 0,1 ..., 5. Second, the average intensity difference between the windows that each pixel is not overlap in the horizontal and vertical directions is calculated separately.
|
{
E
k,h
(x,y)=|
A
k
(x+
2
k-1
,y)-
A
k
(x-
2
k-1
,y)
|
E
k,v
(x,y)=|
A
k
(x,y+
2
k-1
)-
A
k
(x,y-
2
k-1
)
|
| (7) |
Set the best size Sbest(i,j) = 2k, which is determined by the k value that can make the E maximum. Finally, the average value of Sbest in the whole image is calculated to get the coarseness.
|
F
crs
=
1
m*n
∑
i=1
m
∑
j=1
n
S
best
(i,j)
| (8) |
Here m and n are the image’s length and width.
3. Case-based Reasoning System
Case-Based Reasoning (CBR) is the process of using the existing experience to solve similar problems. The basic idea of CBR work is to find historical cases that are similar to solving problems, and then apply the found results to new problems, that is, to use retrieval historical cases to find out the cases similar to the requested problems according to the key features of the cases. CBR system is adaptable, extendable, modular and fast, so it is more suitable for the interactive system than other AI methods.
3.1. Workflow of Case Based Reasoning System
The workflow of CBR system is shown in Fig. 6.
In the structure diagram of CBR, the setting of similarity and the weight setting of the features are the key points, and the realization in the system is explained below:24)
3.1.1. Similarity Calculation
In CBR system, the problem should be matched with the stored cases to find the most similar case or several similar cases. Here, the result of the most similar case could be the solution of problem. There are two kinds of methods to calculate the similarity: the similarity calculation method based on Euclidean distance and gray distance.25)
3.1.2. Weights Set
Before calculating the similarity, the weights of features should be determined. In this CBR system, two methods of calculating the feature weights are adopted: the even weight method and the entropy weight method.26) For even weight, the weight of each feature is equal. For entropy weight, according to the degree of variation of each feature, the entropy of each feature based on information entropy is calculated.
4. Experiment of Wear Debris Classification
The data used in this experiment are the wear debris images of large mechanical equipment provided by a large steel plant. After preprocessing, the size of the picture is 96*96, and 794 pictures are involved. The number of specific categories is shown in Table 2.
Table 2. Typical wear debris and their quantity.
| Wear debris category | Normal | Spherical | Cutting | Severe sliding | Fatigue | Total number |
|---|
| Quantity | 91 | 159 | 157 | 189 | 198 | 794 |
Table 3. Comparison of classification accuracy of different texture description, weight and similarity calculation method.
| CBR calculation methods | Features | 96*96 sub-block | 48*48 sub-block | 32*32 sub-block |
|---|
| Even weight + Euclidean distance | LBP | 79.594% | 81.484% | 84.782% |
| LBP+FD | 79.972% | 82.122% | 83.754% |
| LBP+Tamura | 80.234% | 81.236% | 84.128% |
| LBP+FD+Tamura | 83.376% | 84.262% | 85.774% |
| Entropy weight + Euclidean distance | LBP | 80.224% | 81.106% | 84.400% |
| LBP+FD | 79.720% | 81.620% | 83.378% |
| LBP+Tamura | 80.480% | 80.856% | 83.626% |
| LBP+FD+Tamura | 83.126% | 83.508% | 84.512% |
| Even weight + Gray distance | LBP | 79.594% | 81.484% | 84.782% |
| LBP+FD | 79.972% | 82.122% | 83.754% |
| LBP+Tamura | 80.108% | 81.236% | 84.128% |
| LBP+FD+Tamura | 83.376% | 84.262% | 85.774% |
| Entropy weight + Gray distance | LBP | 80.226% | 80.984% | 84.152% |
| LBP+FD | 80.222% | 81.366% | 83.122% |
| LBP+Tamura | 80.736% | 80.73% | 82.998% |
| LBP+FD+Tamura | 83.624% | 81.994% | 84.764% |
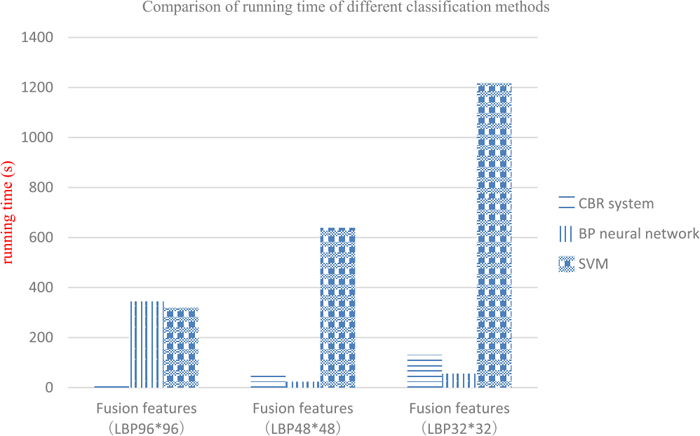
Table 4. Classification accuracy and running time comparison of different classification methods.
| classification method | Texture description method | Classification accuracy (%) | Running time (s) |
|---|
| CBR system | Fusion features (LBP96*96) | 83.376 | 16.992 |
| Fusion features (LBP48*48) | 84.262 | 58.394 |
| Fusion features (LBP32*32) | 85.774 | 130.705 |
| BP neural network | Fusion features (LBP96*96) | 51.250 | 344.570 |
| Fusion features (LBP48*48) | 56.300 | 23.955 |
| Fusion features (LBP32*32) | 64.110 | 55.963 |
| SVM | Fusion features (LBP96*96) | 74.940 | 319.25 |
| Fusion features (LBP48*48) | 82.120 | 638.950 |
| Fusion features (LBP32*32) | 87.150 | 1217.500 |
Since the information of the processed wear debris map is mostly concentrated in the central area, the rotation invariant uniform LBP model will lose part of the texture information, so the sub-block partition method is applied to effectively combine the local information in order to get better feature expression. Each image is divided into size 48 * 48, 32 * 32 and 96 * 96 sub blocks when calculating LBP features. As shown in Fig. 7, for the fatigue wear debris, the image is first divided into 4 sub-blocks of size 48 * 48 and the rotation invariant uniform LBP is calculated for each sub-block, namely, a nine-dimensional eigenvector. The LBP histograms of each sub-block are obtained respectively and normalized. Finally, the 4 sub-blocks LBP histogram is connected in series as the LBP feature vector of the whole picture.
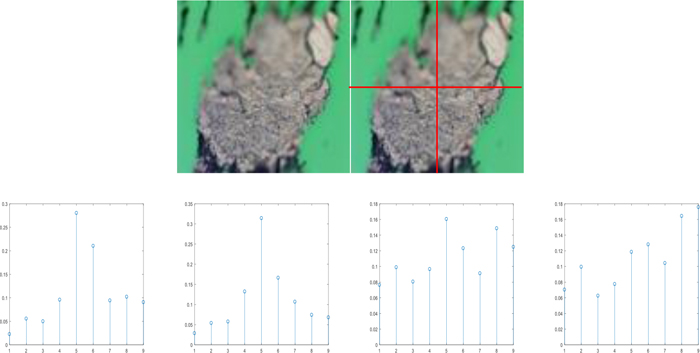
As shown in the figure above, the 4 * 9 = 36 eigenvectors can be obtained by dividing the image into size 48 * 48, and the 9 and 81 eigenvectors can be obtained by dividing 96 * 96 and 32 * 32 separately. Combined with the FD and Tamura coarseness, the classification result can be obtained by inputting the CBR system.
4.2. CBR Based on Fused Features
The fusion features are applied in CBR system. Equal weight method and entropy weight method are respectively adopted for the weights of influential factors, and the gray distance and the Euclidean distance are adopted for similarity calculation, and then the classification result is obtained. The experiments were conducted using five-fold cross validation and the average value was taken as the final classification accuracy. The results were compared with the direct input of LBP, LBP + FD and the LBP + Tamura coarseness. The results are shown in the following Table.
Bar charts for each calculation method are drawn as follows:
As can be seen from Fig. 8 the sub blocks divided into 32 * 32 have the highest classification accuracy compared with the 48 * 48 and 96 * 96 in the LBP solving process, therefore, 32 * 32 subdivision of wear debris image is more appropriate. The fused features based on LBP, FD and Tamura coarseness are more accurate than the LBP feature, indicating that the feature fusion method proposed in this paper is effective. In the case of Tamura or FD only, the classification effect is not ideal compared with LBP, indicating that the fusion of FD and Tamura is necessary.
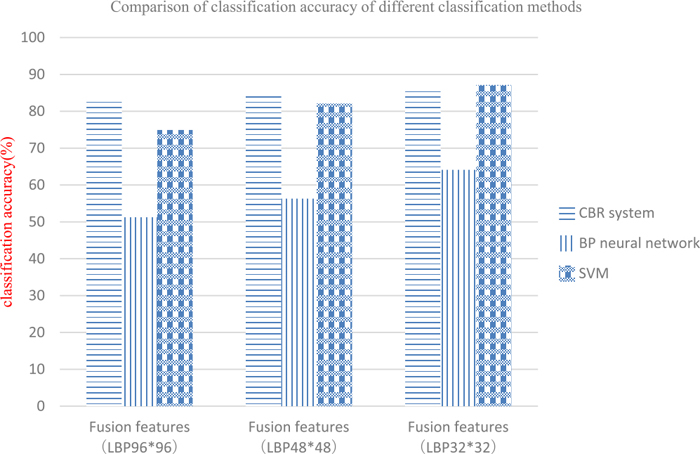
4.3. Results of Different Classification Methods
In order to verify the effectiveness of CBR system, this paper uses BP neural network27) and SVM28) as a classifier for comparative experiments. The texture features of the experiment are described as the fusion of the three features, and the five-fold cross validation method is adopted. The average value of the five experiments is taken as the final classification precision, the total time of the five experiment is used as the running time, and the results are as follows:
The classification accuracy and running time histogram are shown in Figs. 9 and 10:
From the above diagram, we can see that the classification accuracy of CBR system and SVM has little difference, which is better than BP neural network, but the running time of CBR system is obviously lower than that of SVM, which verifies the practicability of CBR system in the research of wear debris classification.
5. Wear Monitoring of Steelmaking Equipment
5.1. Fault Diagnosis of IDF Fan Bearing
In the process of wear analysis of the free side bearing of a IDF fan in a steelmaking plant, it is found that the concentration of Fe in the lubricating oil is very high, reaching 1569 μg/g, and the concentration of Cu, Sn and Cr is also very high, which is greatly increased compared with the previous analysis data. The analysis of wear debris shows that there are many steel debris in the lubricating oil. The fused features of the wear debris image are extracted, and it is fatigue wear debris identified by the CBR system and the size is large, which indicates that the bearing has the phenomenon of fatigue peeling. Vibration analysis conducted at the same time also shows that there is abnormal wear of the bearing, so it is recommended to shut down the bearings immediately on site. The results of maintenance showed that the copper strip used for fixing the outer ring of the bearing had serious wear, so the bearing clearance increased, and there was a phenomenon of running out of the outer ring (Fig. 11). Meanwhile, a small amount of fatigue peeling appeared on the bearing raceway. After the replacement of the bearing, the equipment is restored to normal operation state.

The 450 t driving of a steel making plant is an important lifting equipment in converter steelmaking and belongs to the key equipment in the production line. The running status of it directly affects the normal operation of the steelmaking production line. Through on-site sampling and analysis, it was found that the concentration of iron in lubricating oil is high, and the value of copper concentration is greatly increased compared with the previous analysis, and the mechanical impurities also increase obviously. Most of the wear debris types are fatigue and severe sliding identified by CBR system. Based on this, it is considered that the wear rate of the steel friction pairs in the reducer is high, there are signs of abnormal wear bearings. After receiving the diagnosis report on site, we checked out of the box and found that there was obvious wear phenomenon on the gear surface of the planetary gear and there were some pits and flaking on some tooth flanks (Fig. 12). The input shaft of the motor bearing ring is worn fracture, we decided to replace the gearbox according to the scene. The results of the open box examination were in full agreement with the diagnosis conclusion.

6. Conclusion
In this paper, a feature description method based on the texture fusion is proposed, LBP, FD and the Tamura coarseness are fused in series as the texture description of wear debris. Based on feature expression, CBR system is first applied to wear debris classification, and the similarity between problem and case base is calculated to determine the category of problem case.
CBR system with different weights and different similarity calculation methods is used to classify texture description methods based on feature fusion and LBP, LBP + FD and LBP + Tamura coarseness. The experimental results are compared and the following conclusions are obtained:
(1) The feature fusion method proposed in this paper that add the global feature FD and the Tamura coarseness to the local feature LBP is effective, which can improve the classification accuracy of the wear debris compared with the local feature.
(2) The division of LBP sub blocks has an effect on the classification of wear debris, and the classification precision of the sub block divided into 32*32 is higher than that of 48*48 and 96*96.
By comparing the classification results and runtime of CBR system, BP neural network and SVM, it is found that CBR system has shorter computing time while keeping higher classification accuracy. Therefore, CBR is effective for wear debris classification.
Ackonwledgements
This is financially supported by National Natural Science Foundation of China (51674030, 51574032), National Key Research and Development Program (2016YFB0601301, 2017YFB0304000).
References
- 1) V. Macián, R. Payri, B. Tormos and L. Montoro: Wear, 260 (2006), 562.
- 2) K. Xu, A. R. Luxmoore and F. Deravi: Eng. Appl. Artif. Intell., 10 (1997), 485.
- 3) B. J. Roylance, I. A. Albirdewi and M. S. Laghari: Lubr. Eng., 50 (1994), 111.
- 4) F. Wang: MA. Sc. thesis, Wuhan University of Technology, (2005), http://www.ixueshu.com/document/835fac2f9f052ba5318947a18e7f9386.html, (accessed 2018-01-30).
- 5) Y. Peng, T. Wu, S. Wang and Z. Peng: Wear, 376 (2017), 1885.
- 6) T. Wu, H. Wu, Y. Du, N. Kwok and Z. Peng: Wear, 316 (2014), 19.
- 7) G. D. Wang, P. L. Zhang and G. Q. Ren: Lubr. Eng., 36 (2011), 76.
- 8) C. Gachot, A. Rosenkranz, S. M. Hsu and H. L. Costa: Wear, 372 (2017), 21.
- 9) G. P. Stachowiak, G. W. Stachowiak and P. Podsiadlo: Tribol. Int., 41 (2008), 34.
- 10) W. Yuan, K. S. Chin, M. Hua, G. Dong and C. Wang: Mech. Syst. Signal Process., 72–73 (2016), 346.
- 11) V. Manieniyan, G. Vinodhini, R. Senthilkumar and S. Sivaprakasam: Energy, 114 (2016), 603.
- 12) S. Li, H. Zuo and Y. Zhang: Opt. Precis. Eng., 17 (2009), 589.
- 13) Q. Wu, Y. Gan, B. Lin, Q. Zhang and H. Chang: Neurocomputing, 151 (2015), 1133.
- 14) T. Ojala, M. Pietikäinen and D. Harwood: Proc. 12th Int. Conf. on Pattern Recognition (ICPR), Vol. 1, IEEE Computer Society Press, Los Alamitos, (1994), 582.
- 15) V. V. Kumar, A. S. Rao and Y. S. Krishna: Int. J. Image Graph. Signal Process., 8 (2015), 50.
- 16) T. Ahonen, J. Matas and C. He: Image Analysis, Springer, Berlin, Heidelberg, (2009), 61.
- 17) P. Xiao, J. Xu and S. C. Chen: Electron. Technol., 23 (2010), 49.
- 18) L. Liu and G. Y. Kuang: J. Image Graph., 14 (2009), 622.
- 19) S. S. Chen, J. M. Keller and R. M. Crownover: IEEE Trans. Pattern Anal. Mach. Intell., 15 (1993), 1087.
- 20) N. Sarkar and B. B. Chaudhuri: IEEE Trans. Syst. Man Cybern. Syst., 24 (1994), 115.
- 21) T. Peli: J. Opt. Soc. Am. A, 7 (1990), 1101.
- 22) H. Tamura, S. Mori and T. Yamawaki: IEEE Trans. Syst. Man Cybern. Syst., 8 (1978), 460.
- 23) H. Y. Zhao, G. M. Xu and P. Hong: Comput. Sci., 38 (2011), 288.
- 24) Y. Liang, H. Wang, A. Xu and N. Tian: ISIJ Int., 55 (2015), 1035.
- 25) H. Ke, Y. Chen and L. Yi: J. Syst. Eng. Electron., 18 (2007), 281.
- 26) K. P. Zhou, Y. Lin and H. W. Deng: Trans. Nonferr. Met. Soc. China, 26 (2016), 1995.
- 27) J. C. Li, D. L. Zhao and B. F. Ge: Phys. A, 495 (2018), 1.
- 28) G. Zhu and G. B. Dan: Remote Sens. Environ., 80 (2002), 233.