Forming Processing and Thermomechanical Treatment
Heat Transfer from a Hot Steel Plate Impinged by Air-atomized Water Jet and Impinging Water Jet
2019 年 59 巻 1 号 p. 113-121
詳細
2019 年 59 巻 1 号 p. 113-121
Thermo-mechanical controlled process (TMCP) technology has been widely used to improve the mechanical properties of hot-rolled steel plate. Laminar cooling has been the main cooling form in the steel mills. However, the performance of laminar cooling is limited by its low cooling capacity, nonuniformity, and inefficiency. In this work, it was demonstrated that the air-atomized water jet can be applied in the hot-rolled plate manufacturing process with excellent cooling performance. The cooling efficiency of the steel plate (700°C) was significantly improved by applying air-atomized jet (AJ) with different water densities compared with impinging jet (IJ). Moreover, the local spray density, boiling curves at different positions and the corresponding average heat flux of both cooling methods were systematically investigated by mathematical correlations. The experimental data in this study would be beneficial for design and simulation of the cooling device to achieve better cooling rate and uniformity.
The hot rolled steel plate has been widely used in construction engineering, machinery manufacturing, container manufacturing, shipbuilding and many other fields. One of its main manufacture processes is the plate cooling to a targeted temperature at a given cooling rate. The formation and distribution of microstructure in the plate (cools down from above 750°C high-temperature) are highly dependent on the cooling rate. Therefore, the cooling process is critical to control the plate mechanical properties. However, there are still many problems in the cooling process, such as the low cooling capacity, poor cooling uniformity, complicated radiation model,1) and low cooling efficiency. Up to date, laminar jet cooling is the most prevalent cooling form in steel industries. The main disadvantage of jet cooling is the accumulated water on the plate, thus most of the cooling water slides and falls off the plate instead of directly impinging on the plate because of the Leidenfrost phenomenon.2,3,4) Due to the strong boiling intensity under high thermal gradient, a layer of vapor filmforms between the surface and cooling water and then decreases the heat transfer rate by degrading the probability of solid-liquid contact.
Many researchers have worked on the jet impingement cooling. Leocadio5) reported the cooling process of a hot plate by vertical water jet with different initial temperatures. Their results demonstrated the shape and magnitude of the boiling curves were sharper accordingly with the increase of initial temperature. Nitin Karwa6,7) mainly focused on the flow patterns and the heat transfer distribution during the cooling process on a 900°C stainless cylinder specimen by impinging jet with the different speed, and their conclusion revealed the heat flux distribution and surface flow field with a great reference value. Meanwhile, they also indicated the effect of jet velocity on heat transfer at the impinging point was not noticeable. Myung8) focused on flow field of staggered arranged nozzles jet on a moving surface. The Fluent software was used for the numerical calculation, and an equation was derived to predict the height of the water pool on the surface. Mozumderet9) experimentally investigated the transient heat transfer of water jet impinging on a hot rotating stainless steel cylinder. They studied the heat transfer cooling mechanism and found the higher surface temperature would lower the surface heat flux.
Considerable experimental and theoretical works were implemented on the hot steel cooling using different processes such as impinging jet, spray, air-atomized jet.10,11,12) Among them, air-atomized cooling has attracted much attention for it is considered as a promising alternative to the steel plate cooling.13) The droplets of AJ are atomized to 20–50 μm by the compressed air. As a result, the droplets are more likely to direct contact the plate surface, then evaporate. On the other hand, the air flow will move away the residual droplets. In this case, the vapor film disappears and the region of film boiling reduced dramatically.14,15) Moreover, the water droplet size is the most dominating parameter that influences the cooling rate according to Bhattacharya.16) Reducing droplet size would enhanc the heat extraction capacity. Mohapatra17) investigated the steel plate cooing by AJ and found the heat extraction capacity increased with the air flow rate when water flow rate was constant.
Currently, the air-atomized jet has been used the in continuous annealing, continuous casting, and other fields,18,19) where do not demand the fast cooling rate. However, in the area of plate online cooling and quenching process where require the fast cooling rate, the AJ with weak cooling capacity has rarely been considered or applied. Due to the great difference of experimental data obtained under different circumstances, the precise comparisons between the impinging jet and the air-atomized jet still need to be performed.
In this study, possibility of applying the air-atomized were investigated in the hot-rolled plate online cooling and quenching process. The transient heat transfer experiments were implemented to analyze the impinging cooling and air-atomized cooling of high-temperature stainless steel. The local spray density and boiling curves at different positions were obtained, and the average heat flux of both cooling methods in the certain area were compared. The obtained results in this study were favorable for the design and simulation of the cooling device with higher cooling rate and uniformity.
The experiment was carried out on a specially designed cooling platform as shown in Fig. 1. The water flow rate and air pressure were set to the target value before the cooling process. The specimen was heated to 700°C by two ceramic heating panels. Then it was transferred to the trestle table above the water tank. The heat losses during the transportation are ~25°C.

The schematic of the specially designed cooling platform. (Online version in color.)
AISI 304 stainless steel specimen was chosen for its stable austenitic structure and the excellent oxidization resistance at high temperature.20) As shown in Fig. 2, nine K-type sheathed thermocouples with a measurement range of 0–900°C and 3 mm in diameter were used to obtain temperature data. The impinging point located at the position of the leftmost thermocouple. The accuracy detected position located at the top of the thermocouple. The measuring component inside the thermocouple was attached to the sheath to make sure a fast temperature response. The distance between the center of the hole and the impinged surface was 2.5 mm, with a 30 mm inserted depth . The paste of high temperature thermal conductive (λ = 9.1 W·m−1 K−1) was utilized to fulfill the inside of holes to ensure the close contact of thermocouples and plate. The temperature data were recorded by an independently moveable device (midi LOGGER GL220) at a frequency of 10 Hz. Before each experiment, the steel was polished to exclude the influence of surface roughness, and its average surface roughness was ~0.3 μm.

The schematic of plate and the arrangement of thermocouples.
To reduce the deviation in the data acquisition process, the deviation of surface roughness and other physical parameters of samples were try to be kept stable. It is important to implement the impinging jet cooling and air-atomized cooling on the same platform. All the measurements were repeated twice to reduce main uncertainty of temperature fluctuations due to the positional deviation of thermocouples. In the current experiments, the maximum uncertainty of the average data was ~10%. The uncertainty of steel thermal properties was assumed to be less than 10% in the temperature range of 200–700°C. The water temperature was controlled within ±0.5°C during the cooling process. The jet velocity was controlled within a tolerance of ±0.2 m/s. The experimental parameters were listed in Table 1. In this study, the air pressure Pa during the air-atomized cooling was set to 0.15 MPa to guarantee the even dispersion of water. The flow rate of AJ is very small, and the maximum flow rate of most AJ nozzles is still much lower than the normal flow rate of IJ (the flow rate used in the steel plate cooling process in industry condition). This study intended to analyze of the heat transfer characteristics of AJ and IJ, and discuss the possibility of AJ application under industrial conditions. For better atomization, the selection of AJ parameters are taken into consideration. The droplet size will increase with water flow rate and the difference between AJ and IJ will be weaken when increasing the flow rate of AJ. The selections of IJ jet speed and nozzle diameter are referenced to the parameters of a cooling device in a steel plant in China,21) and jet speed is an important mean to adjust the cooling capacity. By comparing IJ with such parameters, it is possible to better analyze the application of AJ in industrial condition.
| Case | Cooling form | Tw (°C) | D (mm) | V (m/s) | H (mm) | wfr (L/min) | Pa (MPa) | Pw (MPa) | dave (μm) |
|---|---|---|---|---|---|---|---|---|---|
| C1 | IJ | 10 | 3 | 7.1 | 100 | 3.0 | – | – | |
| C2 | IJ | 10 | 3 | 4.7 | 100 | 2.0 | – | – | |
| C3 | IJ | 10 | 3 | 3.5 | 100 | 1.5 | – | – | |
| C4 | IJ | 10 | 3 | 2.4 | 100 | 1.0 | – | – | |
| C5 | AJ | 10 | – | – | 100 | 0.3 | 0.15 | 0.05 | 30.4 |
| C6 | AJ | 10 | – | – | 100 | 0.4 | 0.15 | 0.1 | 34.4 |
| C7 | AJ | 10 | – | – | 100 | 0.6 | 0.15 | 0.15 | 37.0 |
The structure of impinging jet is a stainless steel tube with a diameter of 3 mm and a length of 150 mm. The air-atomized nozzle has a variety of structures, such as the internal mixing type, external mixing type. The main difference is that the water intensity would be hindered by increasing Pa in internal mixing nozzle. The tiny droplets broken by high-speed air are with strong kinetic energy and helpful to sweep away the water film at the surface. The commercial float pattern of air-atomized spray nozzle (B1/4J-SS+SU22-SS) was adopted in this study, as shown in Fig. 3. The filtered water is used as the coolant which is the same as that of the steel mill. The water flow rate of air-atomized jet ranges from 0.3 to 0.6 L/min, according to product specification and theoretical calculation. The droplets is in the size range of 30–37 μm.
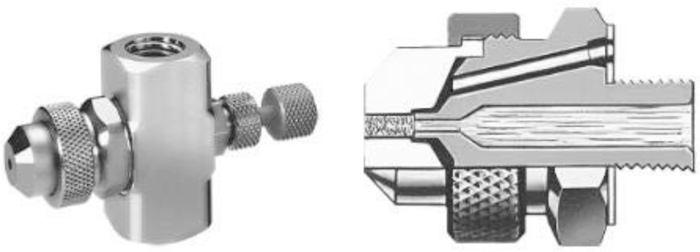
The structure of air-atomized nozzle.
When the Pa=0.15 MPa, H=100 mm, the water density is measured with a patternator that consisted of an array of small collecting tubes (diameter 5 mm) arranged parallelly to the main spray axis. After a period of water collecting, the water density of air-atomized nozzle at radial direction is shown in Fig. 4. The water density reaches the maximum at the center of the impinging area and decreases linearly with increasing the distance to the impinging center.
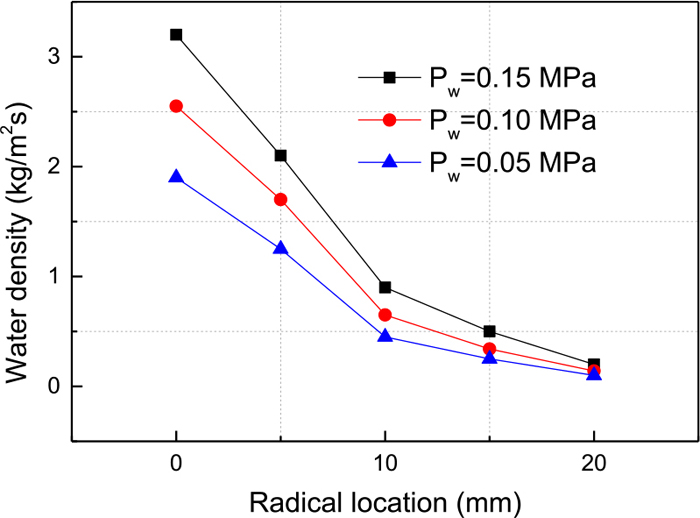
Characteristic of air-atomized nozzle. (Online version in color.)
A program by applying finite difference method based on the Matlab software was developed to calculate the surface heat flux and the temperature of the plate. During the impinging cooling process, the surface-water and vapor make the usual temperature measurement techniques such as infrared thermography hard to perform. Consequently, the surface temperature and heat flux are obtained by inverse heat transfer method based on thermal conduction differential equation and temperature curves reading from the inside of the plate.22)
The two-dimension unsteady thermal conduction differential equation is written as:
| (1) |
The third boundary condition is adopted, and the initial and boundary conditions are written as follows,23) where the B represents the plate width, the Hp represents the plate thickness, Tp is plate temperature, τ is the time, λ is the heat conductivity, C is the specific heat, ρ is the steel density, ϕ is the initial temperature of steel plate, qx is the heat flux at the thickness direction and qy is the heat flux at the width direction.
| (2) |
| (3) |
| (4) |
| (5) |
The Crank-Nicolson difference method is employed both in thickness and width directions. The computing time step is 0.1 s, and the grid size is 1 mm2. In each time step, the difference between the measured and calculated values is used to calculate a new heat flux. The details of the calculation can be found in Wang’s work.18)
Figure 5 represents the surface states during the cooling process of IJ with V=7.1 m/s and AJ with Pw=0.15 MPa. In both cases, at the beginning of the impingement, the water was sputtered to the surrounding of impinge point. Part of the water slipped over the surface, while rest of it just bounced up. However, it was difficult to distinguish the sputtering phenomenon for the small size of water drops when applying the AJ. The existence of sputtered water indicated the sizes of the water drops were above the critical size because the water cannot completely be converted into vapor during the cooling process. The small black circle zone appeared around the impinging point is called wetted region, in which the cooling water contacts the surface directly.24) In Fig. 5(b), in the IJ condition, the radius of the wetted area is ~10 mm, whereas, it is ~5 mm in AJ condition in Fig. 5(f). Such a difference in the wetted region indicated that the IJ had the faster wetting rate during the initial cooling process, which would be helpful for elevating the cooling ability in the moving cooling condition.14)
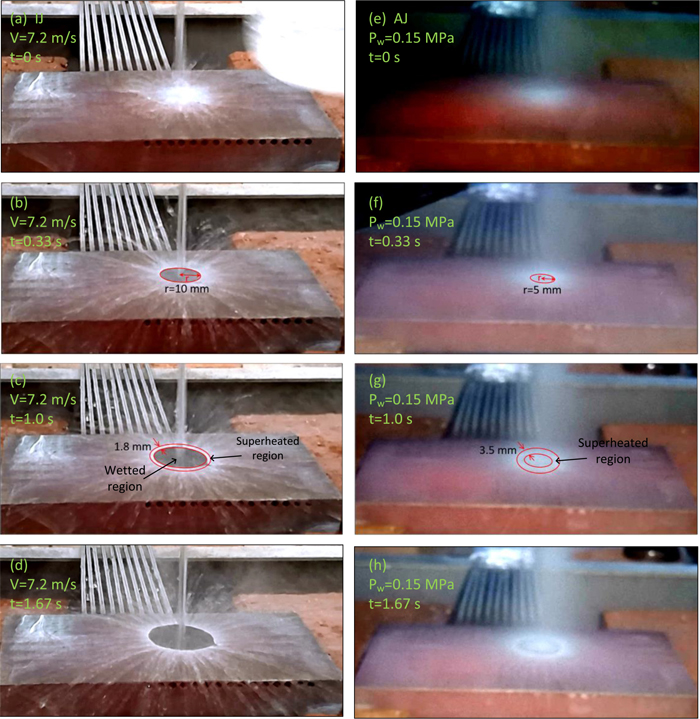
The comparison of surface states under IJ and AJ. (Online version in color.)
The dark zone spreads radially as the cooling continues from 0.33 s to 1.67 s. Under the IJ condition in Figs. 5(b)–5(d), a white annular region where the violent boiling exists is obvious at the periphery of the black area. And the white annular region is called superheated region,25,26) where the parallel flow is constrained to form the spaced tilt streams. The similar phenomenon is also found in the air-atomized jet as shown in Fig. 5(g). However, the superheated region of the AJ is broader than that of the IJ for the larger parallel speed. Meanwhile, the formation of spaced small stream at the periphery of the wetted region was similar to the cooling process of a single water jet.27,28) It is worth noting that the stream is likely to form at the location where hydraulic jump happened in both conditions. The radius of air-atomized impact area grows to ~15 mm during 1.0 s–1.67 s, the wetted area keeps expanding and finally exceeds the impact area with a gradually decreased expanding speed, which is dominated by the less water volume and the decreased surface residence time.
3.2. Analysis of Surface TemperatureExcept the visual observations of surface states, the transient surface temperatures were also recorded. Figure 6 shows the corresponding transient surface temperature curves deduced from the inverse heat conduction method. These cooling curves are in accordance with the curves in previous literatures.29,30) The starting point of the abscissa represents the moment jet impinged on the surface. At the impinging point, the temperature decreased sharply, and the effect of jet velocity on the surface temperature was not obvious in the IJ. While the water pressure had great influence on the temperature curve in the AJ, from which it can be concluded that the enhanced cooling rate resulted from increasing the water density and water pressure. The cooling capacity was proportional to the water density until reaching the limit of water density. As a result, the cooling rate of the AJ was close to the impinging jet when the water pressure was 0.15 MPa.

The surface temperature curves at varies locations, (a) r=0 mm, (b) r=5 mm, (c) r=10 mm, (d) r=15 mm. (Online version in color.)
Figures 6(b), 6(c), and 6(d) compare the surface temperature curves of IJ and AJ at r = 5, 10, 15 mm, respectively. In IJ case, the temperature curves began to drop earlier when the jet velocity was increased. Moreover, a similar but not obvious trend were also observed in the AJ case when the water pressure increased. The phenomenon indicated that it took a certain time for the wetted region to reach the periphery of the stagnation points. When the wetting front arrived at a particular spatial location on the surface, a sharp drop in surface temperature was observed.6,31) Also, the surface cooling rate at different spatial locations also varied with the jet velocities. And the effect of fluid density on elevating cooling rate grew larger with increasing the radial location gradually.
In order to get a more intuitive information about the cooling process, the distribution of surface heat flux and temperature at the different cooling times are displayed in Fig. 7. As shown in Fig. 7(a), the maximum temperature drop was found at the IJ with V=7.1 m/s and the minimum temperature drop was found at AJ with Pw=0.05 MPa. The smaller temperature drop of AJ at the initial cooling process can be attributed to the longer wetting delay time in the AJ. Apparently, increasing the water density would be beneficial to reduce wetting delay time and increase cooling rate. Under both cooling systems, the maximum heat flux (MHF) always located at the position that was a little behind the wetting front and the corresponding temperature was around 500°C.

The variation of surface heat flux and temperature with cooling time, (a) t=0.5 s, (b) t=1.0 s, (c) t=1.5 s, (d) t=2.0 s. (Online version in color.)
As shown in Figs. 7(b), 7(c) and 7(d), around the impinging point, the temperature difference between IJ with V=7.1 m/s and AJ with Pw=0.15 MPa decreased with expanding the cooling time (0.5 s–2.0 s). The difference was 14.2°C at 2.0 s (r=5 mm) and showed a significant rise along the radial direction (5 mm–20 mm). This phenomenon can be attributed to the feature of the AJ, whose cooling capacity decreased significantly outside the impinging area. As shown in Fig. 5(b), the radius of the impinging area in the AJ is ~15 mm, outside this region the water drops would slip away at a fast speed and the water is unlikely accumulated at the surface. The abundant accumulated water is an important factor to ensure the surface temperature dropping to a critical wetting-start temperature. Therefore, the wetting rate drastically decreases outside the impinging area.
3.3. Analysis of Surface Heat FluxThe heat flux represents the intensity of surface cooling rate varied with cooling time at various places, and the corresponding plots are shown in Fig. 8. Figure 8 indicates the heat flux increases sharply due to the high boiling driving force under high surface superheat. As a result, it reached the maximum rapidly and followed by a slow decrease.32) During the initial cooling process, the dominant boiling mechanism is transient boiling, and it would transform into nucleate boiling6,32) as soon as the heat flux reached the MHF. What’s more, the higher MHF indicates the higher boiling frequency along with the shorter bubble detaches time.33,34)
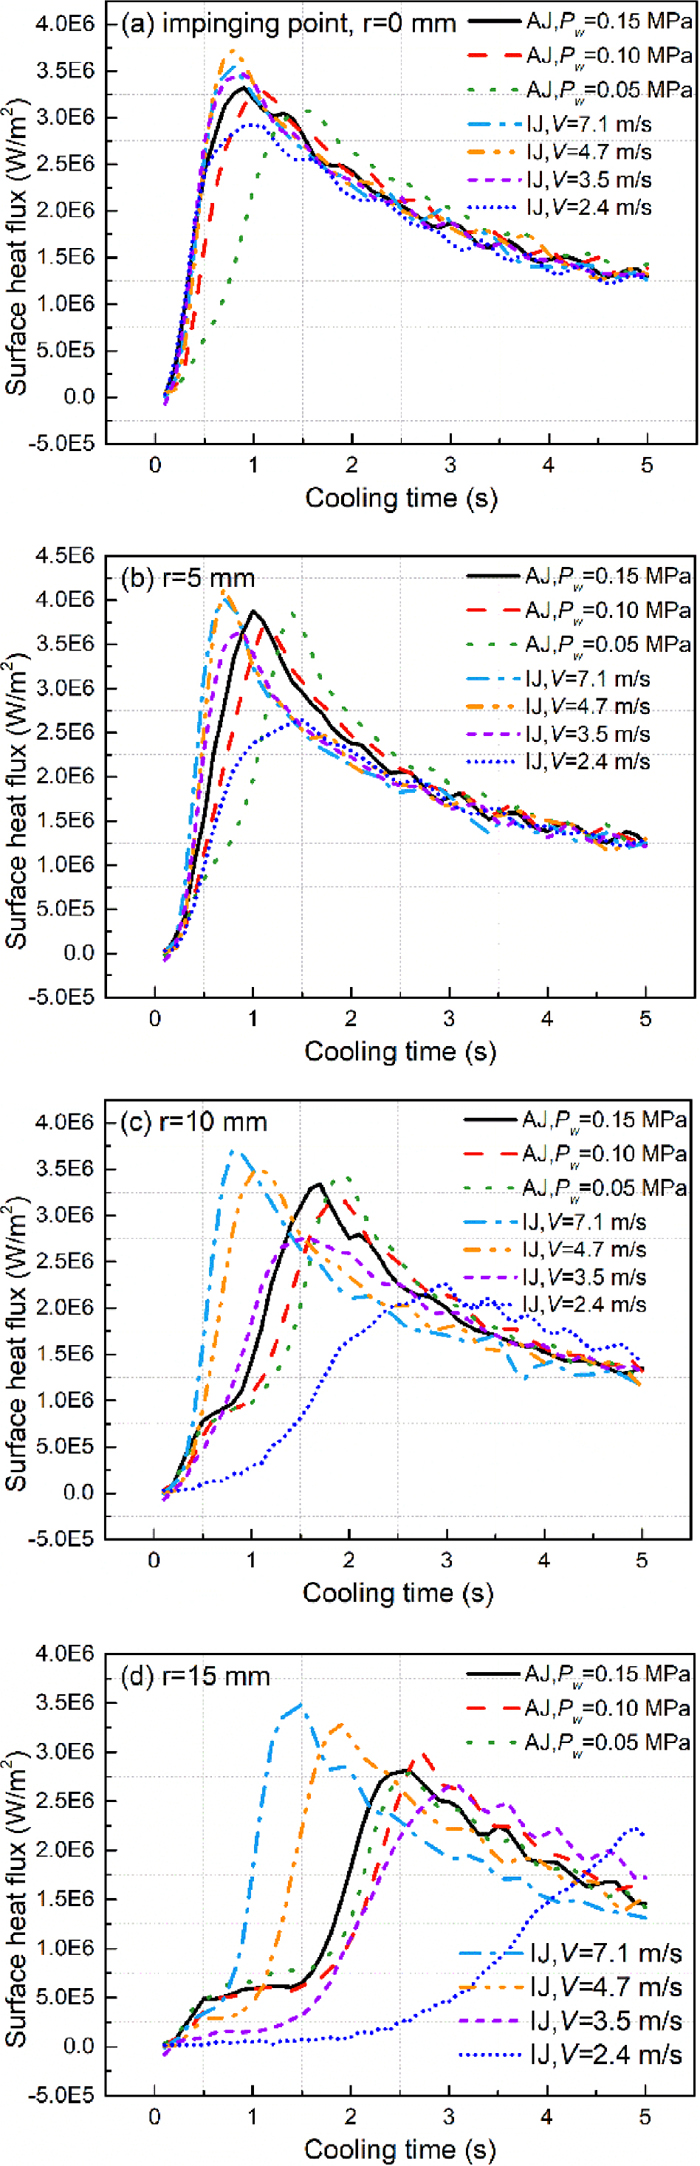
The surface heat flux curves at different locations, (a) r=0 mm, (b) r=5 mm, (c) r=10 mm, (d) r=15 mm. (Online version in color.)
At impinging point, the heat flux of AJ with Pw=0.05 MPa displayed the slowest increase rate, which meant the wetting process was slower than that of other cases. When the Pw increased from 0.05 MPa to 0.10 MPa, the heat flux rising rate showed a significant increase. Below critical water density, higher water density would accelerate the wetting process as well as enhance the MHF; For IJ, a larger jet velocity would result in a faster heat flux rising rate and a higher MHF, but the enhancement was disproportion with the jet velocity. For example, when the jet velocity increased from 2.4 m/s to 7.1 m/s (~2.96 times), the MHF only increased by 22% This result agreed well with the previous studies by applying a single impinging jet.6,32)
At position r=5 mm, the time to reach MHF in the AJ is still longer than that of the IJ case. It is noteworthy that the MHF of AJ with Pw=0.15 MPa is 3.88 MW/m2, which is 3.2% lower than that of the IJ with V=7.1 m/s, and 47% higher than that of the IJ with V=2.4 m/s. In the area of r > 5 mm, for IJ, the wetting speed and MHF both increased with increasing V, because the increased water density was corresponded with a higher critical wetting surface temperature.24) Along the impinging point radial direction, the slowly increasing stage of heat flux under AJ lasted longer as shown in Fig. 8(d). This period is the time from the start of impingement to the wetting region expanded to exceed the specific location. During this period, the boiling rate of water drops was constrained by the vapor film which was derived from the high temperature of the unwetted surface. Moreover, the AJ showed higher heat flux than that of the IJ at position r=15 mm before 0.6 s. In the industrial application, the impinging time at a certain position is short, because the plate is always moving at a fast speed and it is lack of time for the wetted region to expand sufficiently. In the period of impingement, the temperature difference is less in the impinging area of AJ. Therefore, the higher heat flux at the initial stage of AJ would be helpful to increase the total heat extraction capacity and enhance the cooling uniformity.
3.4. Analysis of the Average Heat Flux and Heat EfficiencyUp to date, the nozzles in the cooling equipment are usually arranged at regular intervals in steel industries. The interference of impinging flows limits the potential wetted region of each jet. Therefore, the evaluation criterion of cooling rate of different nozzles should be the heat extraction capacity in a certain area. Based on the heat flux and temperature data at various locations, formula 6 and 7 are adopted to calculate the average heat flux and temperature in a designated area.
| (6) |
| (7) |
The average heat flux in the area of r ≤ 45 mm and r ≤ 15 mm are shown in Figs. 9(a) and 9(b) respectively. As the cooling time goes on, all the curves show the average heat flux rises to a maximum value then drops. The main differences are the contour profile and the magnitude of the boiling curves. For the IJ, increasing jet velocity had a significant impact on both rising speed and the peak of the average heat flux. For the AJ, the influence of Pw was not so obvious, but a positive effect still could be observed on the peak of the average heat flux. As shown in Fig. 9(a), the average heat flux curves of Pw=0.15 MPa in the AJ and V=4.7 m/s in the IJ showed the similar trend, although, in this case, the flux in IJ (2 L/min) was 3.3 times larger than it in AJ (0.6 L/min). The responses of average heat flux to the variation of Pw in AJ were not obvious before 3.5 s.
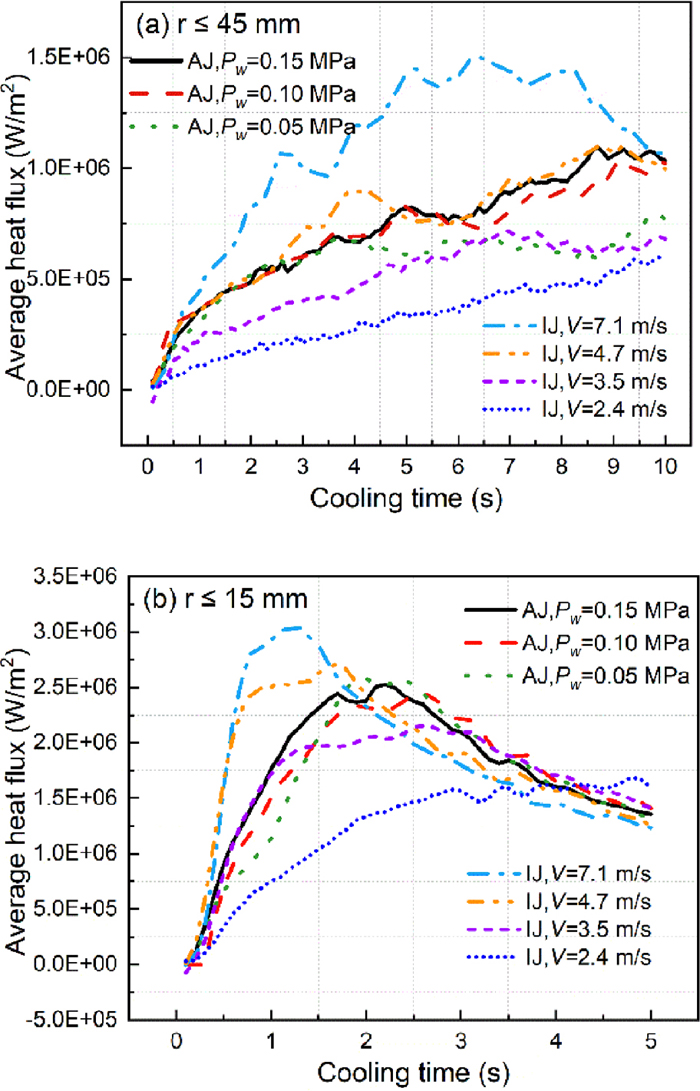
The variation of average heat flux with cooling time, (a) r ≤ 45 mm, (b) r ≤ 15 mm. (Online version in color.)
The impact region in AJ is a circular area with radius ~15 mm when the jet is 100 mm above the plate, beyond this area, the wetting rate decreases dramatically because the reduced cooling water on the plate. Taking into account that the potential wetted region is restricted by the interference of nearby jets in multiple jets condition, it is reasonable to evaluate the heat flux in a smaller area. As shown in Fig. 9(b), for the IJ, initial cooling (in the first 0.55 s) was not influenced by increasing the velocity from 4.7 m/s to 7.1 m/s. Combined with analyzing the heat flux at different locations (Fig. 8), we have reason to believe that the increased velocity would strengthen the heat removal ability by enlarging the effective cooling area rather than substantially increasing the heat flux in the impinging region. For the existence of a critical flow value within a certain area, further increasing the flux could not effectively enlarge the wetted area for the ineffective heat transfer of the extra water. In the relatively small area, the difference between IJ and AJ becomes smaller, the average MHF in AJ with Pw=0.15 MPa is 17% lower than that in the case of V=7.1 m/s in IJ, and the difference is 27% in area r=45 mm. The average heat flux curves exhibit the similar tendency when Pw=0.15 MPa in AJ and V=3.5 m/s in IJ. In this study, the lower MHF and wetting speed of the AJ can be ascribed to the feature of the commercial air-atomized nozzle that does not have the optimum water-drop size and water density, so there are still opportunities for further enhancements.
| (8) |
Here we define the average heat flux of a unit water volume as
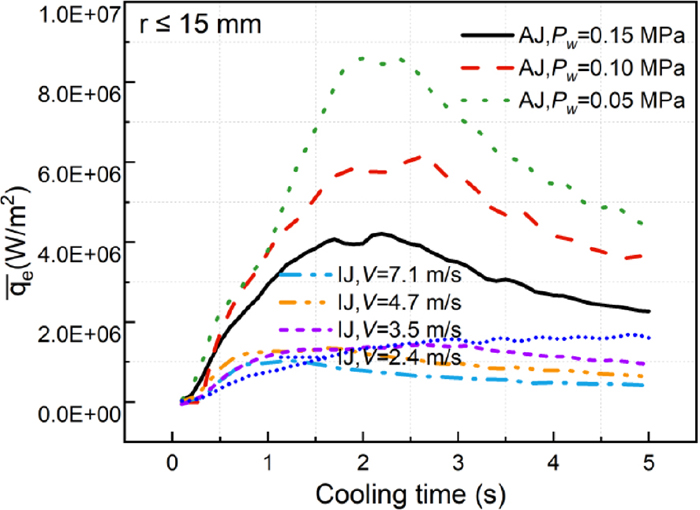
The variation of
From Fig. 10 it can be concluded that the
In order to further investigate the relationship between average heat flux, average surface temperature and cooling time in IJ, the corresponding plots in the area r≤45 mm are presented in Fig. 11. The data of average heat flux and surface temperature were calculated by formula 6 and 7. And the 3D curved surface of cooling plots in Fig. 11 was fitted by formula 9. The well matched curves in Fig. 11 indicates the used model and formula are reasonable. In calculating the temperature field during the steel plate cooling process, the most critical and challenging part was to obtain the accurate boundary conditions, such as the heat flux varied with surface temperature and radial location. Therefore, formula 9 can be used to calculate the temperature field of plate cooling process. the obtained results are beneficial for predicting the phase transformation in the thickness direction.
| (9) |

The variation of average heat flux with different temperatures and jet velocities in the area r ≤ 45 mm. (Online version in color.)
Figure 11 indicates that as increasing the V, the average heat flux show the higher rising speed and the maximum. After the impingement, the average heat flux would experience three stages. Firstly, it increased with decreasing the surface temperature. Secondly, it reached the maximum in the temperature range 400–500°C. Finally, it began to drop when the temperature was lower than 150°C. In this temperature range, the superheat of the surface has not been sufficient enough to drive the initialization of boiling point, and the heat transfer mechanism is mainly based on single-phase flow heat transfer.
The current study systematically focused on the heat transfer characteristics of the impinging jet and air-atomized jet. The surface states in the center of the impinging region first started wetting and then expanded radially, and they were similar in both cooling systems. The heat flux rose rapidly in the transient boiling phase until it reached the maximum when the boiling converted from transient boiling to nucleate boiling.
In the area r ≤ 45 mm, the average heat flux increased obviously with V in the IJ, but less obviously in the AJ. The heat flux curve of the AJ was similar to the IJ with V = 4.7 m/s and 3.5 m/s in the case of r ≤ 45 mm and r ≤ 15 mm, respectively.
Despite the lower maximum heat flux in the AJ, the cooling efficiency of it was much higher than that of in the IJ. The
In this study, AJ was proved to be a promising method for the cooling process after rolling and heat treatment of the hot-rolled plate. The AJ showed much superior cooling efficiency and uniformity. The energy consumption (include the water and electric energy) can be largely reduced in the AJ case. However, there are still disadvantages by applying the AJ, such as the slower wetting rate which would limit its application in the moving speed of steel plate. Therefore, the further work to enhance the cooling performance of the AJ would be focused on the optimizing of wetting rate and water dispersion density.
This work was supported by the National Science Foundation of China (Grant No. 51674004) and the open project of the RAL at Northeastern University (2016006).
Tw: water temperature (°C)
q: average surface heat flux (W/m2)
wfr: water flow rate (L/min)
Pw: water pressure of air-atomized jet (MPa)
Pa: air pressure of air-atomized jet (MPa)
H: distance between the nozzle exit and the impingement surface (mm)
D: nozzle diameter (mm)
V: nozzle impinging speed (m/s)
dave: averaged droplet diameter (μm)