Abstract
The microstructure and hardness of martensite in Fe–C and Fe–N alloys with up to 7.5 at% contents of carbon and nitrogen, respectively, were compared. Their difference in hardness was discussed based on four strengthening mechanisms. The martensitic structures of Fe–C and Fe–N alloys with equal contents of carbon and nitrogen, respectively, were nearly identical, except for the amount of retained austenite. Furthermore, Fe–C alloy was considerably harder than Fe–N alloy. This discrepancy gradually increased with carbon and nitrogen contents. The enhanced hardness of Fe–C alloy martensite was attributed to its higher dislocation density and the stronger pinning force of interstitial carbon atoms on dislocations.
1. Introduction
Martensitic structures in steels are characterized by a high density of dislocations and a fine substructure. They typically exhibit hardness which can be improved by interstitial elements such as carbon and nitrogen. Therefore, martensite with high contents of carbon and nitrogen is an important microstructure for strengthening steel. It is introduced in commercial steel products, such as hard steels for tools, hardened surface layers of machine structural steels, and steel sheets for automobiles. Recently, the improvement of high-strength industrial steels was necessitated to cope with economic and environmental demands. Hence, the applications of high-carbon and high-nitrogen martensite are expected to expand and therefore, a deeper understanding of their structures and properties is essential.
Carbon steel martensite has been extensively investigated for many decades. The morphology of its microstructure,1,2,3,4,5,6) substructure of dislocations and twins,3,4,5,6,7,8) crystallographic character,9,10) and mechanical properties6,11,12,13,14) were deeply examined based on carbon content. Even in high carbon martensitic steels with a carbon content of more than 1 mass%, the microstructure,14,15) habit planes,14,15) and hardness14) have been reported. However, the number of studies on martensite in nitrogen steels is significantly lesser than those of carbon steels, which might be due to its limited applications. Since the development of the high-temperature gas nitriding and quenching method (N-quench)16) as an alternative surface-hardening method to conventional carburizing and quenching, studies on nitrogen-bearing martensitic steels have gradually increased. Hitherto, the effects of nitrogen content on lattice parameter,17,18,19,20,21,22) hardness,16,23) microstructural size, and crystallography24) have been reported. For example, Chiba16) reported that the hardness of a Fe–N system martensite increases with the amount of nitrogen in the solid solution, but eventually decreases at nitrogen concentrations over 5 at% due to the formation of retained austenite.
Generally, nitrogen influences the microstructure and hardness in a manner similar to carbon. The extent of the difference of their effects has not been adequately discussed. Morito et al.24) investigated and compared the substructures of lath martensite in Fe–C and Fe–N steels with hypoeutectoid compositions by transmission electron microscopy and reported that both carbon and nitrogen refine the size of block and packet structures and increases the dislocation density in their corresponding steels, but with a different degree of influence. Though we can obtain information on nitrogen-containing martensite from these limited studies, they lack details on steels containing more than 1 mass% nitrogen or sufficient comparison between the effects of carbon and nitrogen.
In this study, we prepared high-nitrogen martensitic steels with a maximum nitrogen concentration of 2 mass% (7.5 at%) by high-temperature gas nitriding and quenching, and high-carbon martensitic steels with a similar carbon concentration by the conventional melting method. The microstructure and hardness of these specimens were examined, and the effects of carbon and nitrogen were compared. The difference in their hardness was then discussed based on four strengthening mechanisms: particle-dispersion strengthening, grain-refinement strengthening, dislocation strengthening, and solid-solution strengthening.
2. Experimental Procedure
Figure 1 illustrates two heat treatment processes used to prepare samples of Fe–N and Fe–C alloys along with their respective binary phase diagrams. Since the melting process cannot be adopted for Fe–N alloys, a high-temperature gas nitriding and quenching method was applied to 10 mm×15 mm×0.01 mm pure iron foil. The foil was nitrided under NH3+H2 gas containing 2 to 7 vol% NH3 at a temperature of 938 to 1093 K for 14.4 to 21.6 ks, followed by water quenching. The nitrogen contents of the products were estimated from their weight gain after the heat treatment. The nitrogen concentration distribution through the foil thickness was confirmed using an electron probe micro-analyzer (EPMA). Moreover, to prepare Fe–C alloy samples with the same carbon content as the nitrogen content of the nitrided specimens, S45K (0.44 mass% C), SK85 (0.87 mass% C), and a high-carbon steel (1.66 mass%C) were melted, so that their carbon content would be the target content. The melted Fe–C alloy samples were hot-rolled to plates with a thickness of 5 mm, solution-treated at different temperatures depending on their carbon content, and then water-quenched. Table 1 shows the chemical compositions of the prepared samples. Throughout this paper, the specimens will be identified with atomic percent of C and N, like 2.0C, 2.0N, etc. in consideration of the physical meaning. A small amount of substitutional elements, Cr and Mn, is added to each specimen to ensure hardenability; however, the effects of such a minor addition on microstructure and hardness of as-quenched martensite have been demonstrated to be negligible.25)
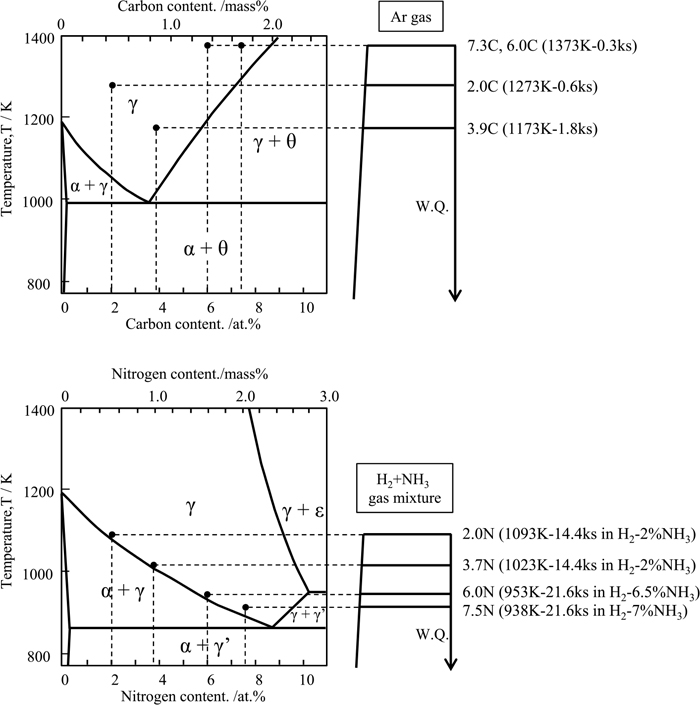
Table 1. Chemical composition of the specimens used in this study (mass%).
| | C | Si | Mn | Cr | N | Fe |
|---|
| Fe–C alloys | 2.0C | 0.44
(2.01 at.%) | 0.067 | 0.750 | 0.160 | <0.001 | Bal. |
| 3.9C | 0.865
(3.90 at.%) | 0.220 | 0.298 | 0.071 | <0.001 | Bal. |
| 6.0C | 1.36
(6.02 at.%) | <0.001 | <0.001 | 0.026 | <0.001 | Bal. |
| 7.3C | 1.66
(7.28 at.%) | <0.001 | <0.001 | 0.038 | <0.001 | Bal. |
| Fe–N alloys | 2.0N | <0.020 | 0.006 | 0.165 | <0.020 | 0.505
(1.98 at.%) | Bal. |
| 3.7N | <0.020 | 0.006 | 0.165 | <0.020 | 0.95
(3.68 at.%) | Bal. |
| 6.0N | <0.020 | 0.006 | 0.165 | <0.020 | 1.58
(6.02 at.%) | Bal. |
| 7.5N | <0.020 | 0.006 | 0.165 | <0.020 | 2.00
(7.52 at.%) | Bal. |
The microstructure of the samples was observed by optical microscopy (OM), scanning electron microscopy (SEM), and transmission electron microscopy (TEM). The accelerating voltages for SEM and TEM were 20 kV and 200 kV, respectively. The samples for OM and SEM were wet-polished with colloidal silica abrasive and etched with 3% nital. For the TEM observations, thin sheet samples of φ3 mm were electropolished by the twin-jet method using 5% HClO4-95% CH3COOH solution. The lattice parameter and volume fraction of the retained austenite were analyzed by X-ray diffraction (XRD) with a Co-Kα1 source at 40 kV and 30 mA. The interior hardness of each microstructure without the effect of retained austenite was measured by nanoindentation tests, and 20 measurements were obtained for each plot. Consequently, hardness was evaluated as the mean value of 18 measurements, disregarding the maximum and minimum values.
3. Results
3.1. Characteristics of Martensitic Structure Formed in Fe–C and Fe–N Alloys
Figure 2 shows the optical micrographs of the specimens. The prior austenite grain size of the specimens is indicated in each picture. The 7.3C steel exhibits a significantly larger prior austenite grain size compared with the other specimens, which is due to the much higher solution treatment temperature to dissolve cementite fully into austenite solid solution. Typical lath martensitic structures composed of plate-like blocks are observed in (a) 2.0C, (b) 3.9C, (d) 2.0N, and (e) 3.7N steels. The block widths of these specimens were slightly refined with increasing carbon and nitrogen contents at 1.01 μm, 0.87 μm, 1.09 μm, and 0.89 μm, respectively. However, the block sizes of Fe–C and Fe–N alloys with identical contents of carbon and nitrogen, respectively, were comparable. The micrographs of (c) 7.3C and (f) 7.5N reveal that both consist of coarse lenticular martensites containing clear midrib and fine secondary lenticular martensites which fill the spacing of the coarse lenses. According to Hai,6) butterfly martensite might be formed even in low-alloy high-carbon steels after high-temperature austenitizing as in the cases of 6.0C and 7.3C. However, it was hard to identify the butterfly martensite by the limited experimental evidences in this study. Minimal difference in the morphology and size of the martensitic structure was observed between Fe–C and Fe–N alloys, while the discrepancy in the amount of retained austenite was evident in the optical micrographs. This will be discussed later quantitatively. For Fe–N alloys, nitrogen gas voids appeared along the prior austenite grain boundaries. Although the number of voids increased with nitrogen content, EPMA measurements revealed that the nitrogen concentration is uniform within the specimen and that the magnitude of denitrogenation has negligible influence on the average nitrogen content of the bulk specimen.

Figure 3 presents TEM images of (a) 3.9C and (b) 3.7N steels with lath martensitic structure observed with the incident beam of <111>M direction. The lath width of 3.9C and 3.7N steels was 250 and 360 nm, respectively, indicating that Fe–C martensite has thinner laths than Fe–N martensite. Morito et al.24) compared the lath widths of Fe–N alloy (<2.7 at% N) and Fe–C (<2.6 at% C). They reported that the lath width of Fe–C alloy was greater than that of Fe–N alloy in the low-concentration regime. However, that of Fe–C alloy diminished with increasing carbon content, while that of Fe–N alloy is independent of the nitrogen content. If these behaviors persist in the high-concentration regime, the size relation in terms of the lath width between Fe–C and Fe–N steels will be reversed, which is consistent with the results of this study. However, the reason for the different lath widths of the Fe–C and Fe–N alloys is unclear. Figure 4 presents TEM bright-field images obtained near the midrib of lenticular martensitic structures in (a) 7.3C and (b) 7.5N steels. Though various sizes of lenticular martensite exist, the lens size was selected constant for each specimen. The midribs of both 7.3C and 7.5N consist of closely spaced transformation twins in accordance with established knowledge.4,26,27) The twins in 7.3C and 7.5N were both less than 10 nm thick. Notably, the twinned region in 7.5N was wider than that in 7.3C. Presumably, the width of the twinned region depends on the martensitic transformation temperature,27) stacking fault energy, and strength of austenite. However, studies on this are inadequate, and the factors influencing twin size have yet to be established.
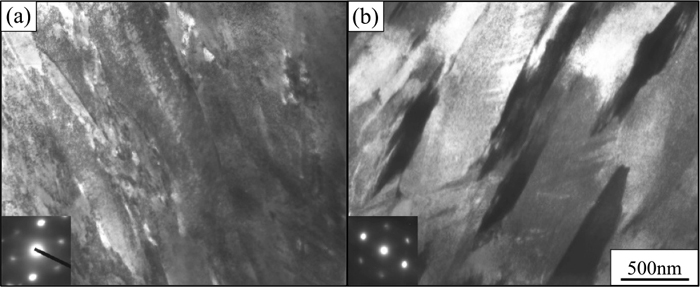
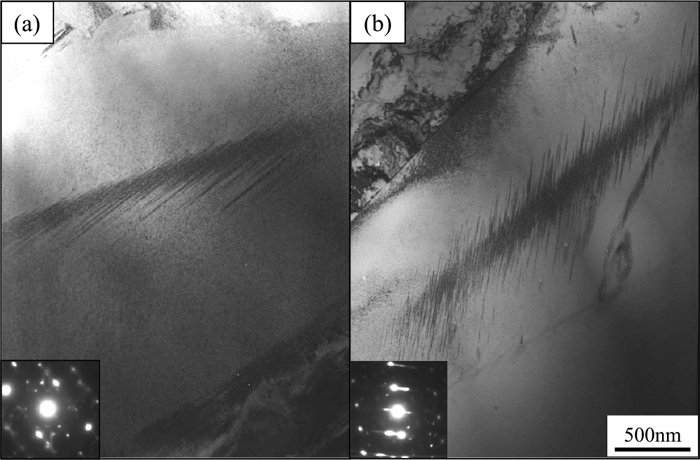
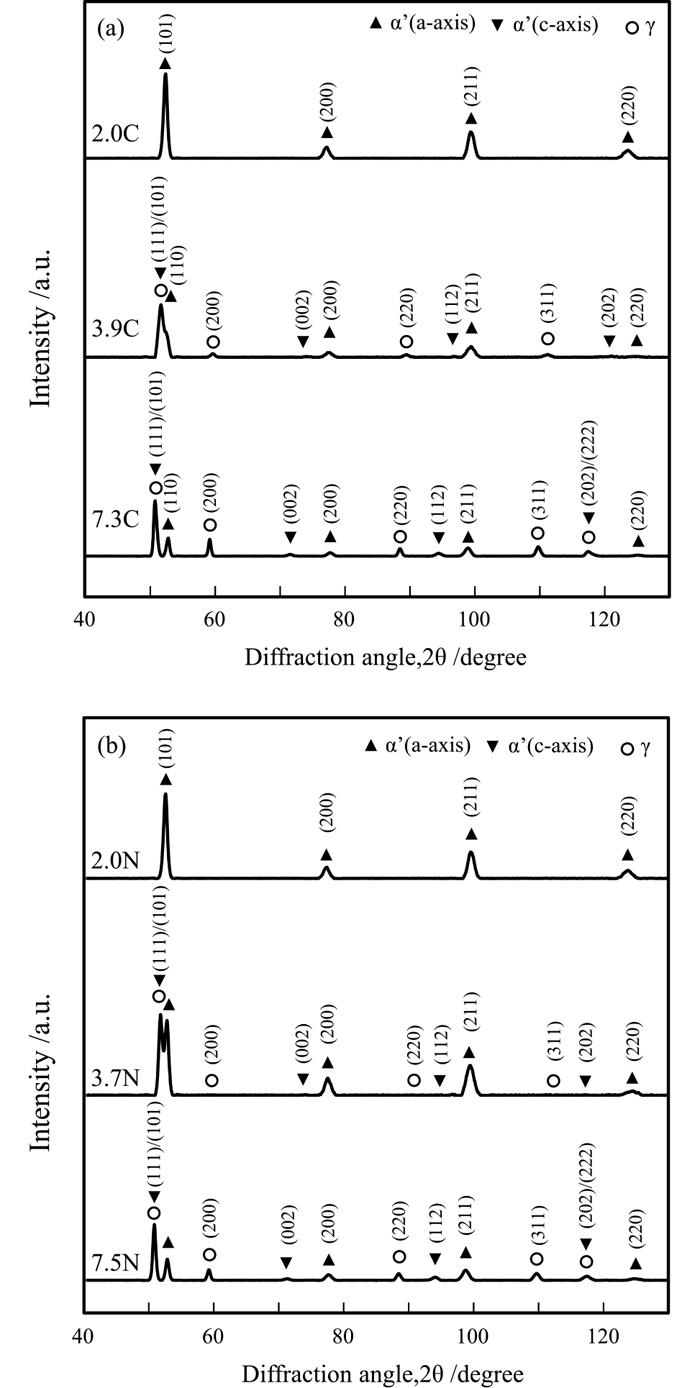
Figure 5 presents the XRD pattern of each specimen. Peaks corresponding to α’ martensite were detected, and those of retained austenite appeared and intensified with increasing carbon and nitrogen concentrations. Peaks for γ’-Fe4N and ε-Fe2N were not observed. The peaks of α’ martensite split into a and c axes due to its body-centered tetragonal (bct) structure upon increasing the carbon and nitrogen contents to more than approximately 2.4 at%.17) The lattice parameters a and c, and their ratio (a/c) are plotted against carbon and nitrogen contents in Fig. 6. The result for retained austenite and plots of previously reported values18,19,20,21,22) are also presented. The measured lattice parameters for martensite and austenite agree with previously reported values, suggesting that the specimens, excluding 2.0C and 2.0N without the c-axis peak, possess bct structure. Furthermore, during cooling, all the carbon and nitrogen existed in the solid solution without undergoing precipitation, segregation, or auto-tempering.

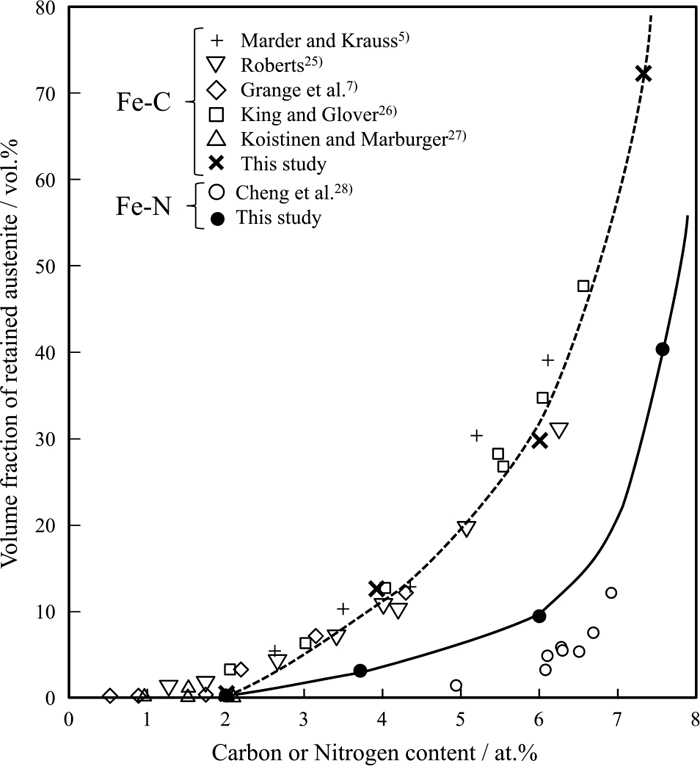
The change in the volume fraction of retained austenite, obtained from the diffraction peak of face-centered cubic (fcc)-Fe, is shown in Fig. 7, together with some previously reported values.5,7,28,29,30,31) The data are consistent with the previous results, where the volume fraction of retained austenite increased with both nitrogen and carbon contents. Upon comparison, the amount of retained austenite in Fe–C alloy was greater than that in Fe–N alloy. Between lenticular martensites 7.3C and 7.5N, the volume fraction of retained austenite in 7.3C (72 vol%) is remarkably greater than that in 7.5N (40 vol%); however, the austenite grain size is larger in the former than the latter. This indicates that carbon more effectively lowers γ→α’ martensitic transformation temperature than nitrogen. Therefore, the thermal stability of austenite in Fe–C alloy is higher than that in Fe–N alloy. Figure 8 shows the T0 of the Fe–C and Fe–N alloys calculated with Thermo-Calc software, adopting the Ms temperature reported by Greninger32) and Bell.33) At any carbon or nitrogen concentration, T0 is higher in Fe–N alloy than in Fe–C alloy, implying stronger driving force for martensitic transformation at ambient temperature in Fe–N alloy. The calculated free energy change from fcc to bcc transformation (ΔGγ-α) at ambient temperature (300 K) revealed that the difference in the driving force of transformation between Fe–N and Fe–C alloys (ΔGγ-αFe–N–ΔGγ-αFe–C) gradually intensified with increasing concentration. This reaches an approximately 140 J/mol discrepancy, when both carbon and nitrogen concentrations are 7.5 at%†. This might contribute to the higher Ms temperature and smaller amount of retained austenite of Fe–N alloy compared with that of Fe–C alloy.
† The calculation result of Thermo-Calc with SSOL database was assumed to be correct even at a low temperature around Ms. Actually, calculation results for such a low temperature might be less reliable quantitatively.
3.2. Effects of Carbon and Nitrogen on Hardness of Martensite
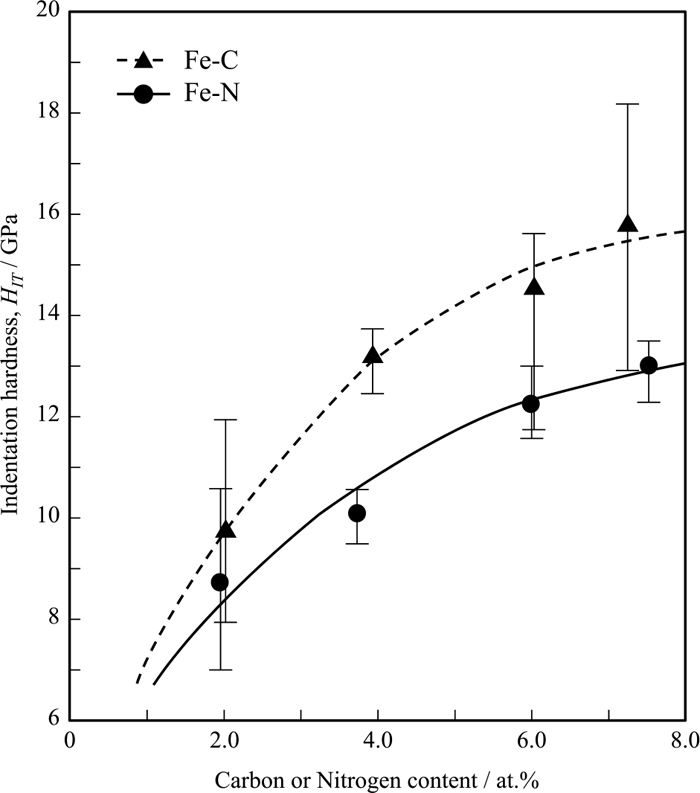
The changes in the hardness of Fe–C and Fe–N alloys with the corresponding carbon or nitrogen content measured by micro-Vickers hardness tests are shown in Fig. 9. The results reported by Chiba et al.16) and Krauss34) are also shown for comparison. In the micro-Vickers hardness tests, the diamond indenter forms indentations with size ranging from tens to hundreds of micrometers. Therefore, the measured hardness considered the effects of block or lens boundaries and retained austenite, because their widths are of several micrometers. In addition, the hardness of Fe–N alloy might be influenced by the voids formed due to denitrogenation inside the steel. The hardness results concur with those reported by Chiba and Krauss. Fe–C alloys tend to be harder than their Fe–N alloy counterpart at similar concentrations. Furthermore, the hardness deteriorated when the concentration increased above 4 at%. The decrement of hardness in the high-concentration regime is attributed to the contribution of retained austenite and voids. This means that the measured hardness does not reflect the true hardness of a martensite matrix with carbon or nitrogen atoms. Therefore, nanoindentation hardness (HIT) testing was conducted to demonstrate the effects of carbon and nitrogen contents on the true hardness of martensite, excluding the effects of retained austenite and voids. Since the indentation size in the nanoindentation tests is around one to two micrometers, it is possible to completely measure the hardness within a lens without the effect of the lens boundary in lenticular martensite. However, block boundaries may still affect the hardness of lath martensite. Zhang et al.26) reported that the substructure in lenticular martensite is transformed from twins to dislocations between the midrib and the martensite/austenite interphase boundary. Simultaneously, the local hardness is gradually decreased in Fe-33mass%Ni alloy. Therefore, the change in the local hardness of 7.3C and 7.5N within a lens was also investigated and plotted against the distance from the midrib in Fig. 10. The nanoindentation hardness of 7.3C is considerably higher than that of 7.5N anywhere in the lens. Additionally, the hardness of 7.5N decreases with increasing distance from the midrib, which is similar to the behavior exhibited by Fe-33mass%Ni alloy.26) However, the hardness of 7.3C tends to increase slightly. This variation might be due to their different substructures. The twinned region in a lens is narrower in 7.3C, suggesting that its hardness would be susceptible to the effect of dislocation substructure, namely local dislocation density. However, the variation in hardness within a lens is negligible compared to the difference in hardness between 7.3C and 7.5N. In this study, the hardness of lenticular martensite was measured 0.5 μm away from the midrib, where the amount of retained austenite is insignificant. The corresponding hardness numbers are plotted against carbon or nitrogen content (Fig. 11). Observably, Fe–C alloys are harder than their Fe–N alloy counterparts by approximately 30%. This difference gradually increases with carbon and nitrogen contents. Furthermore, hardness continuously increased even when carbon and nitrogen contents exceed 7 at%. Finally, there is no discontinuous hardness change regardless of the microstructural change from lenticular to lath, suggesting that microstructural change has an insignificant effect on hardness in martensitic steels.

4. Discussion
In this study, the microstructure and hardness of martensite in Fe–C and Fe–N alloys were compared. Results revealed that Fe–C alloys are harder than Fe–N alloys at identical contents of carbon and nitrogen, respectively. However, their morphologies and microstructure sizes are comparable. Here, the improved hardening effect of carbon was discussed based on four strengthening mechanisms: particle-dispersion strengthening (precipitation strengthening), grain-refinement strengthening, dislocation strengthening, and solid-solution strengthening.
Firstly, particle dispersion strengthening is discussed. If carbon and nitrogen atoms precipitate as carbide or nitride during cooling through auto-tempering, the as-quenched martensite should be hardened by the precipitates. This might occur in low-carbon and low-nitrogen steels, including 2.0C and 2.0N, with relatively high Ms temperatures. However, carbon and nitrogen atoms in 3.9C and 7.3C, and 3.7N and 7.5N steels, respectively, were fully dissolved in solid solution as confirmed by X-ray analysis (Fig. 6). Nevertheless, Fe–C is significantly harder than Fe–N even at higher contents. This means that the hardness difference between Fe–C and Fe–N alloys is hard to be explained by the particle-dispersion strengthening.
For grain-refinement strengthening, the nanoindentation hardness of the lath martensite in 2.0C, 2.0N, 3.9C, and 3.7N steels may have been affected by block boundaries, although the lath boundaries could be regarded as a less influential factor due to their small misorientation. Ohmura35) reported that block boundaries in lath martensite can contribute to the nanoindentation hardness of lath martensite in carbon steel. Thus, if the strengthening effect by grain boundary segregation36) is more significant in alloys with carbon than with nitrogen, hardness will be more effectively increased by carbon-segregated boundaries. However, the nanoindentation hardness of Fe–C martensite was higher even in lenticular martensite without a grain boundary. This suggests that grain-boundary strengthening could not have significantly caused the enhanced hardening effect of carbon.
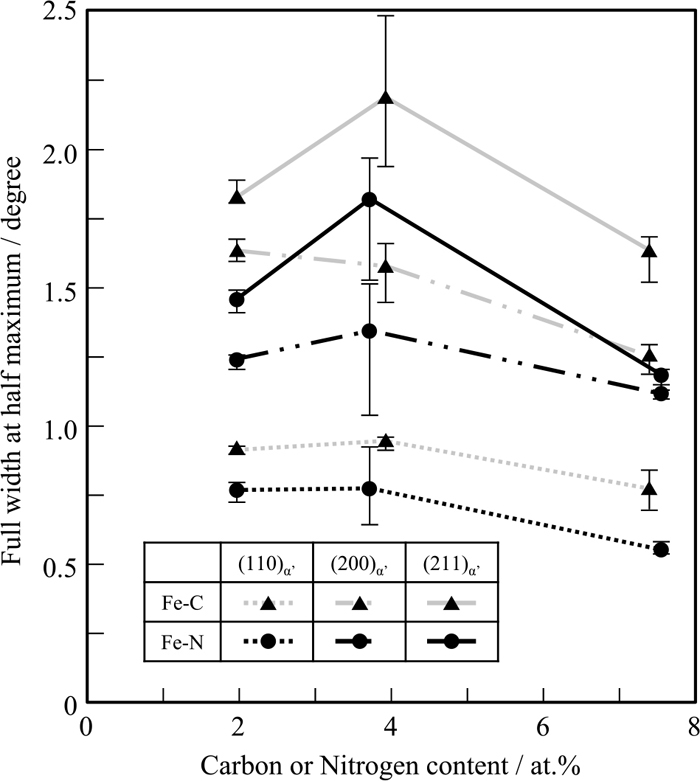
Dislocation strengthening was then investigated by considering the density of dislocations introduced into the martensitic structure. The quantitative estimation of dislocation density for high-carbon/-nitrogen martensite by X-ray analysis is difficult due to the bcc-to-bct transformation. However, the full width at half maximum (FWHM) of diffraction peaks were observed to generally increase with dislocation density. Thus, the FWHMs of (110)α’, (200)α’, and (211)α’ corresponding to the a-axis are plotted against either carbon or nitrogen content as shown in Fig. 12. Comparison of lath martensites 2.0C and 2.0N, or 3.9C and 3.7N, revealed that Fe–C alloys exhibit larger FWHM than their Fe–N alloy counterparts. Therefore, the dislocation density must be higher in lath martensitic Fe–C alloys than in Fe–N alloys. Similarly, the lenticular martensite 7.3C displayed broader FWHM than 7.5N. The reduction of FWHM with increasing carbon and nitrogen contents in 7.3C and 7.5N, respectively, were attributed to their lower dislocation density from lattice-invariant deformation by twinning instead of dislocation gliding during martensitic transformation. Morito et al.24) investigated the dislocation substructure in Fe–C and Fe–N alloys with martensitic structure with TEM, and reported that the dislocation density of lath martensite in Fe–C alloys (C%<2.77 at%) was higher than that in their Fe–N alloy (N%<2.70 at%) counterparts, which agrees with the results of this study. The difference in dislocation density between Fe–C and Fe–N steels is probably due to the difference in Ms temperature shown in Fig. 8. The transformation strain becomes relatively larger in Fe–C steel at a lower Ms temperature compared with Fe–N alloy, thereby introducing a higher density of dislocations during the transformation of Fe–C alloys. Furthermore, a lower Ms temperature hinders plastic accommodation in austenite and dislocation recovery upon cooling. Hence, dislocation introduction was presumed to be more probable in Fe–C alloys. Therefore, a higher degree of dislocation strengthening in Fe–C alloy chiefly contributed to a harder martensite.
The discrepancy in hardness between Fe–C and Fe–N alloys increased with carbon and nitrogen contents. However, the difference in their FWHMs were almost constant regardless of the content level. This relationship could not be fully explained by dislocation strengthening. Therefore, the effect of solid-solution strengthening must be considered. As shown in Fig. 6, the effects of carbon and nitrogen on the lattice parameters of martensite (a and c axes) were almost identical, suggesting that the lattice distortion caused by the interstitial solid solution in either alloy was similar. Recently, authors analyzed the interaction between an interstitial atom and an edge dislocation in iron by molecular dynamics simulation37) and estimated that the pinning force of a carbon atom on an edge dislocation was 1.5 times stronger than that of a nitrogen atom. This calculation suggests that the addition of carbon to steel leads to a higher solid-solution strengthening effect than nitrogen, effectively contributing to the higher hardness of Fe–C martensite.
Herein, explanations for why Fe–C martensite is harder than Fe–N martensite are proposed and discussed. However, these have yet to be confirmed quantitatively. To verify the mechanism, further investigation is necessary regarding the substructure of martensite, atomic-level interaction between interstitial elements and dislocations, segregation behaviors of interstitial elements along grain boundaries, and ageing effect during cooling and at ambient temperature.
5. Summary
(1) The block and packet sizes, and martensitic structure of Fe–C and Fe–N alloys with identical contents of carbon and nitrogen, respectively, were nearly similar; however, Fe–C martensite (3.9 at% C) has a smaller lath size than Fe–N martensite (3.7 at% N).
(2) The morphology and thickness of transformation twins in the midribs of lenticular martensite are similar in both Fe–C (7.3 at% C) and Fe–N (7.5 at% N) alloys. However, the twinned region in the Fe–N alloy is wider than that in the Fe–C alloy.
(3) The volume fraction of retained austenite is remarkably larger in Fe–C alloy than in Fe–N alloy, indicating that the thermal stability of the austenite of Fe–C alloy is higher than that of Fe–N alloy. This could be qualitatively explained by the relatively higher Ms temperature of Fe–N alloy, which suggests a larger driving force for martensitic transformation.
(4) The martensite in Fe–C alloys is harder than that in their Fe–N alloy counterparts by approximately 30%. Furthermore, this difference increased with carbon and nitrogen contents until 7.5 at%.
(5) The improved hardness of Fe–C alloy relative to that of Fe–N alloy at identical contents of carbon and nitrogen, respectively, was attributed to the higher dislocation density and stronger pinning force on dislocations by interstitial atoms in Fe–C alloys.
References
- 1) T. Maki, K. Tsuzaki and I. Tamura: Trans. Iron Steel Inst. Jpn., 20 (1980), 207.
- 2) R. G. Davies and C. L. Magee: Metall. Trans., 2 (1971), 1939.
- 3) P. M. Kelly and J. Nutting: J. Iron Steel Inst., 197 (1961), 199.
- 4) A. Stormvinter, P. Hedström and A. Borgenstam: J. Mater. Sci. Technol., 29 (2013), 373.
- 5) A. R. Marder and G. Krauss: Trans. ASM, 60 (1967), 651.
- 6) G. Hai: Metallography, 20 (1987), 263.
- 7) R. A. Grange, C. R. Hribal and L. F. Porter: Metall. Trans. A, 8A (1977), 1775.
- 8) S. Morito, J. Nishikawa and T. Maki: ISIJ Int., 43 (2003), 1475.
- 9) P. M. Kelly: Mater. Trans. JIM, 33 (1992), 235.
- 10) S. Morito, Y. Adachi and T. Ohba: Mater. Trans., 50 (2009), 1919.
- 11) M. Kehoe and P. M. Kelly: Scr. Metall., 4 (1970), 473.
- 12) S. Morito, H. Yoshida, T. Maki and X. Huang: Mater. Sci. Eng. A, 438–440 (2006), 237.
- 13) Y. Mine, K. Hirashita, H. Takashima, M. Matsuda and K. Takashima: Mater. Sci. Eng. A, 560 (2013), 535.
- 14) G. Krauss: Mater. Sci. Eng. A, 273–275 (1999), 40.
- 15) Y. Liu, Y. Li, Y. Tan and B. Huang: J. Iron Steel Res. Int., 13 (2006), 40.
- 16) M. Chiba, G. Miyamoto and T. Furuhara: J. Jpn. Inst. Met., 76 (2012), 256.
- 17) O. D. Sherby, J. Wadsworth, D. R. Lesuer and C. K. Syn: Mater. Trans., 49 (2008), 2016.
- 18) W. B. Pearson: A Handbook of Lattice Spacing and Structure of Metals and Alloys, Pergamon Press, Oxford, (1958), 895.
- 19) M. Tsuchiya, M. Izumiyama and Y. Imai: J. Jpn. Inst. Met., 29 (1965), 427.
- 20) K. H. Jack: Proc. R. Soc. A, 208 (1951), 200.
- 21) B. N. Bose and M. F. Hawkes: J. Met., 188 (1950), 307.
- 22) V. G. Paranjpe, M. Cohen, M. B. Bever and C. F. Floe: J. Met., 188 (1950), 261.
- 23) W. S. Owen, E. A. Wilson and T. Bell: The Structure and Properties of Quenched Iron Alloys, in High Strength Materials, ed. by V. F. Zackay, John Wiley & Sons, New York, (1965), 167.
- 24) S. Morito, Y. Iwami, T. Koyano and T. Ohba: Mater. Trans., 57 (2016), 227.
- 25) J. L. Burns, T. L. Moore and R. S. Archer: Trans. ASM, 26 (1938), 1.
- 26) L. Zhang, T. Ohmura, A. Shibata and K. Tsuzaki: Mater. Sci. Eng. A, 527 (2010), 1869.
- 27) A. Shibata, S. Morito, T. Furuhara and T. Maki: Acta Mater., 57 (2009), 483.
- 28) C. S. Roberts: J. Met., 197 (1953), 203.
- 29) H. W. King and S. G. Glover: J. Iron Steel Inst., 193 (1959), 123.
- 30) D. P. Koistinen and R. E. Marburger: Acta Metall., 7 (1959), 59.
- 31) L. Cheng and E. J. Mittemeijer: Metall. Trans. A, 21A (1990), 13.
- 32) A. B. Greninger: Trans. Am. Soc. Met., 30 (1942), 1.
- 33) T. Bell: J. Iron Steel Inst., 206 (1968), 1017.
- 34) G. Krauss: Steels Processing, Structure, and Performance, ASM International, Materials Park, OH, (2005), 299.
- 35) T. Ohmura and K. Tsuzaki: Tetsu-to-Hagané, 92 (2006), 295 (in Japanese).
- 36) S. Araki, K. Fujii, D. Akama, T. Tsuchiyama, S. Takaki, T. Ohmura and J. Takahashi: Tetsu-to-Hagané, 103 (2017), 491 (in Japanese).
- 37) K. Hyodo, S. Araki, S. Munetoh, T. Tsuchiyama and S. Takaki: The 5th Int. Symp. on Steel Science (ISSS2017) Proc., ISIJ, Tokyo, (2017), 175.