Mechanical Properties
Determining Hot Deformation Behavior of an Advance High Strength Steel (AHSS) by Means of Dynamic Processing Maps
2019 年 59 巻 1 号 p. 176-185
詳細
2019 年 59 巻 1 号 p. 176-185
The deformation behavior of an Advance High Strength Steel (AHSS) with a composition of 0.22C-1Si-2Mn was investigated by means of dynamic processing maps. The flow stress curves, which were determined by tensile tests within the temperature range of 1173 and 1573 K and at strain rates between 10−3 and 1 s−1, were used for constructing the processing maps based on the Dynamic Materials Modeling approach (DMM). These maps were used to evaluate the optimum thermomechanical processing conditions by identifying the stable “safe” regions for plastic flow. Microstructure and fracture analysis of the test samples was performed and correlated to the processing maps. This analysis was used for determining the “safe” domains within the maps whereby plastic flow can be optimum for processing the material. This study will allow us in determining optimal industrial processing routes for producing these steels and to achieve the highest quality of the end product.
Strict environmental regulations in the automotive industry, mainly for reducing CO2 emissions, has motivated metallurgical researches in developing a wide range of new steel grades that can allow the reduction of weight of automotive parts without compromising its structural integrity while in service.1) These new steel grades, such as the Dual Phase (DP) Advance High Strength Steels (AHSS), have attracted great industrial interest due to their adequate balance in mechanical properties i.e. toughness, strength and ductility.2) However, the high strength and toughness of these steels may imply difficulties for their production. Also, considering the microstructural changes that accompany the plastic deformation of these steels, it is wise to have full understanding of its behavior at critical processing temperatures and strain rates. Localized strains due to the anisotropy of the structure and distribution of phases may lead to the formation of weak spots which can provoke failure of the work piece during processing. Therefore, it is necessary to understand their plastic behavior as a function of microstructure, temperature, strain and strain rate, in order to avoid unstable or “unsafe” processing routes.
During hot deformation (such as in the process of hot rolling), the microstructure of metals goes through a series of changes, which influence its plastic behavior. Thus, one of the most important goals in hot deformation is to control the microstructure, avoid the formation of micro- or macro defects or flow instabilities that can compromise the material integrity during processing. Advanced numerical models which correlate plastic flow with the inherent material properties have facilitated the design of optimum processing paths while identifying critical parameters such as temperatures and strain rates. Material models for hot deformation can predict optimum process parameters and window range for process control for given industrial schemes.3) The dynamic processing maps determined with the Dynamic Materials Modeling approach (DMM) is one of the most effective tools for determining optimum processing parameters. This approach has been validated and applied to a wide range of materials such as: carbon-manganese-silicon steel,4) Aermet100 steel,5) 42CrMo steel,6) 15Cr-15Ni-2.2Mo-0.3Ti austenitic stainless steel,7) 304L stainless steel,8) 2519 A aluminum alloy,9) commercial-purity aluminum,10) AZ31 magnesium alloy,11) extruded AZ magnesium alloys,12) Ti-10V-4.5Fe-1.5Al titanium alloy,13) Ti-6Al-4V titanium alloy,14) cobalt,15) zirconium alloy16) etc. It has been demonstrated that with the use of processing maps, it is possible to obtain optimum parameters for efficiently designing an effective metalworking processing route.17)
The strain rate sensitivity (m) is an important parameter since that has direct impact on the final results of the processing map. In most cases, materials exhibit positive values of m, i.e. the flow stress increase with the increase of strain rate, under which the deformation is stable. Nevertheless, m may become negative in a certain range of strain rate and temperature. This may lead to material instabilities during plastic deformation,18) whereby accumulation of local strains may lead to periodic serrated changes on the stress-strain curves.19) In this situation, the calculation of the processing map may fail since negative values do not satisfactorily enter in the solution due to the numerical approach of the model which accounts for the calculation of the natural logarithm of m. There are some papers18,19,20,21) that reflect on cases whereby m ≤ 0. Other studies4,5,6,7,8,9,11,12,13,14,15,16,17,22,23,24,25) which focus mainly on the development of processing maps, do not discuss about cases whereby m ≤ 0, even when significant oscillations have been identified in the stress-strain curves.8,12,23,25)
The aim of the current investigation is to determine the critical domains where plastic flow may be stable or “safe” during hot deformation of a DP steel by means of a dynamic processing map. This modeling approach may help us understanding the influence of microstructural changes and constitutive behavior on plastic deformation during processing. The study is done within the critical temperature range for hot processing (within 1173 and 1573 K). Experimental data from the isothermal hot tensile tests based on the flow stress curves were employed for developing the processing maps. A discussion is given for the cases whereby m ≤ 0, and where the corresponding area in the processing map had to be defined by means of microstructure and fracture analysis. Based on the calculated processing maps, the optimum “safe” domains for hot deformation of the DP steel is satisfactory suggested.
Steel ingots of 100×100×270 mm were produced in a vacuum induction furnace at Tata Steel, in IJmuiden. The chemical composition of the steel is shown in Table 1. This steel corresponds to an Advance High Strength Steels (AHSS), Dual Phase (DP) steel.
| Fe | C | Si | Mn | P | S | Ti | Al | N |
|---|---|---|---|---|---|---|---|---|
| Bal. | 0.22 | 1.0 | 2.1 | 0.003 | 0.013 | 0.001 | 0.03 | 0.0007 |
The isothermal hot tensile tests were performed on a Gleeble 1500 thermomechanical simulator at five different temperatures (1173, 1273, 1373, 1473 and 1573 K) and at four strain rates (10−3, 10−2, 10−1 and 1 s−1). The dimensions of the cylindrical specimens and the schematic diagram of the heating-cooling process for tensile testing are shown in Figs. 1(a) and 1(b), respectively. During the tests, each specimen was rapidly heated up to 1623 K at a heating rate of 20 K/s and then held for 300 seconds for homogenization. Afterwards, the specimens were cooled down at a cooling rate of 5 K/s until reaching the testing temperature, and then held again for 60 seconds prior to sample pulling. This procedure was repeated at different strain rates. The temperature of the specimen was monitored by using a R-type (Pt-Pt13%Rh) thermocouple welded to the mid-span surface of the specimen. After the tensile tests, the specimens were immediately quenched in water in order to “freeze” the microstructure. After the tests, the quenched samples were cut along the longitudinal axes. The cross-section of the samples was mechanically polished, and then etched in a mixture of saturation picric acid and absolute alcohol (volume ratio 1:1) for about 20–30 s. Subsequently, the microstructures were observed on a Zeiss Optical Microscope (OM). The microstructure images were used to validate the results obtained from the dynamic processing maps.
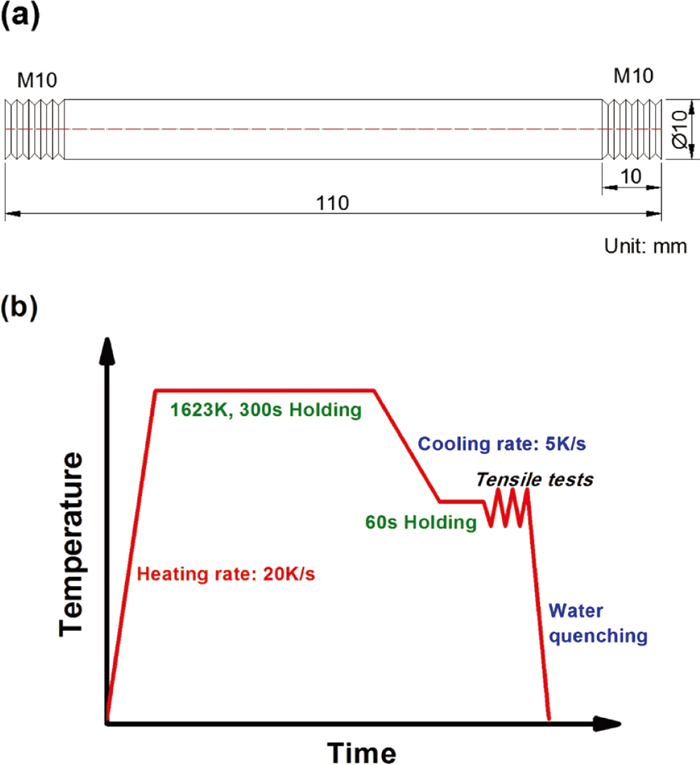
(a) Dimensions of the tensile specimens used in the Gleeble tests, and (b) schematic diagram of the heating-cooling process, sample pulling and quenching. (Online version in color.)
The Dynamic Materials Model approach (DMM) was first proposed by Gegel and Prasad26) to describe plastic deformation at high temperatures influenced by the microstructure and the constitutive behavior of the material. The construction of the dynamic processing maps based on the DMM approach consist of two parts: a) a power dissipation efficiency parameter η related to plastic work and microstructural changes, and b) an instability parameter ξ related to flow instabilities. The maps revealing stable “safe” and unstable “unsafe” domains for plastic flow can be made by superimposing the instability map over the power dissipation efficiency map.
a) Power dissipation efficiency η:
This parameter considers the dissipation of power during hot workability. The parameter called total power (P) can be represented as the sum of two dimensionless parameters named: power content (G) and power co-content (J)3)
| (1) |
Where σ and
The flow stress σ is related to strain rate
| (2) |
Where K is a constant and m is the strain rate sensitivity of flow stress. The strain rate sensitivity (m) can be related to the power contents G and J by the following formula:
| (3) |
For pure metals, m can be considered as independent of temperature and strain-rate, on the other hand, in alloy systems, m changes as a function of temperature and strain-rate.27)
At a given deformation temperature, J is determined by integrating Eq. (3):
| (4) |
This relationship indicates that the J co-content increases with m. The J content becomes a maximum when m is equal to 1, thus:
| (5) |
The relation of J over Jmax represents the efficiency of power dissipation (η):
| (6) |
The change of the η value with temperature and strain rate gives a power dissipation map. Microstructure related phenomena can be distinguished by the domains revealed within this map.
b) Instability parameter ξ:
The instability parameter
| (7) |
The instability parameter
| (8) |
The stable domains are related to regions whereby Dynamic Recrystallization (DRX) and Dynamic Recovery (DRV), leading to material softening, are dominant during plastic deformation.31) On the other hand, localized micro-defects such as: micro-cracks, voids, localized creep, deformation bands, etc. lead to microstructure anisotropy and therefore unstable plastic deformation.3) In order to have good plastic deformation in the material, the processing windows with the corresponding temperatures and strain rates whereby stable or “safe” domains are present should be selected while avoiding unstable or “unsafe” domains.5)
The true stress-strain curves (flow stress curves) of the DP steel obtained from the hot tensile tests at strain rates between 10−3 and 1 s−1 and deformation temperatures of between 1173 and 1573 K are shown in Fig. 2, respectively. It can be seen that the influence of temperature and strain rate on the flow stress is very significant. The flow stress increases with increasing strain rate and decreases with increasing temperature. These curves reflect the stages of plastic flow typically found on steels during hot deformation: Stage I (work hardening stage), Stage II (transition stage) and Stage III (softening stage).32) The three different stages of plastic flow can be distinguished by the plotting the hardening modulus, as shown in Fig. 3 (Using the flow stress-strain curve 1273 K/10−1 s−1 as an example). The value of hardening modulus can be calculated from the true strain and stress data obtained from the tensile tests by:
| (9) |

The true stress-strain curves of the DP steel at different strain rates: (a) 10−3 s−1, (b) 10−2 s−1, (c) 10−1 s−1 and (d) 1 s−1. (Online version in color.)
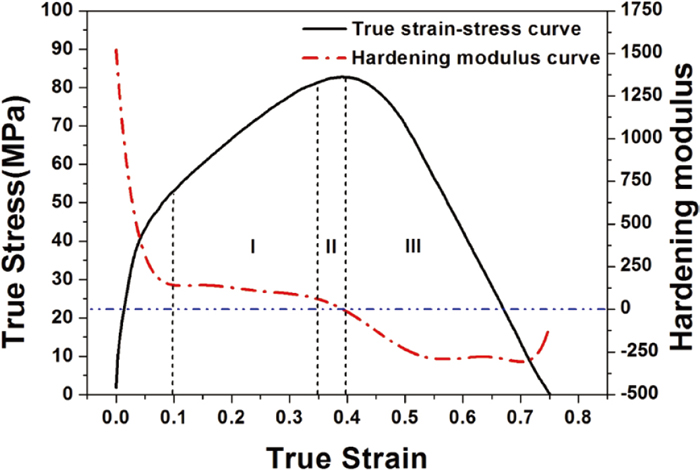
Variations of the work-hardening rate and true stress with true strain during the tensile test at 1273 K/10−1 s−1. (Online version in color.)
The hardening modulus reveals the deflection points within the stress-strain curves which reflect the three main deformation stages. These deformations stages are defined by the hardening and softening mechanisms competing during deformation as follows:
a) Stage I, work hardening stage due to generation and accumulation of dislocations which eventually restrict plastic flow leading to strain hardening;
b) Stage II, transition stage, at this stage the rate of hardening starts to diminish and the rate of softening induced by DRV and DRX starts to dominate.33,34) In this region, the dislocations rearrange and annihilate leading to the formation of sub-grains through DRV and eventually to the nucleation and growth of new finer grains through DRX.
c) Stage III, softening stage, at this stage DRX is the main mechanism influencing plastic flow. New finer grains facilitate further softening of the material.33,35,36,37)
When studying the constitutive behavior of materials, emphasis is given to the description of work-hardening behavior of materials under various deformation conditions,38) since it partly determines the peak value of flow stress,35) which is one of the main parameters for limiting the boundaries for plastic deformation. This study will focus on the processing maps at the true strains of 0.1 and 0.3 which are the critical strains attained in steel processing.
4.2. Dynamic Processing Maps 4.2.1. Strain Rate Sensitivity Parameter (m)For a given strain, the cubic spline interpolation is used to define the intervals of log(σ) and log(
| (10) |
Where, a, b, c, d are polynomial coefficients. By taking the partial derivative on Eq. (10), the following formula is obtained:
| (11) |
Strain rate sensitivity is small at the low deformation temperatures. Small values of m such as: m=0.001 to 0.06 have almost negligible impact on flow stress. On the other hand, the strain rate sensitivity can have a great impact on strain localization which may further enhance the probability for developing instabilities. Strain rate sensitivity values greater than 0.3 may lead to superplastic behavior of the material,39) whereby little increments in the strain rate may lead to a large increase in the flow stress. Under this condition strain localization can be delayed due to local strengthening of the material.40)
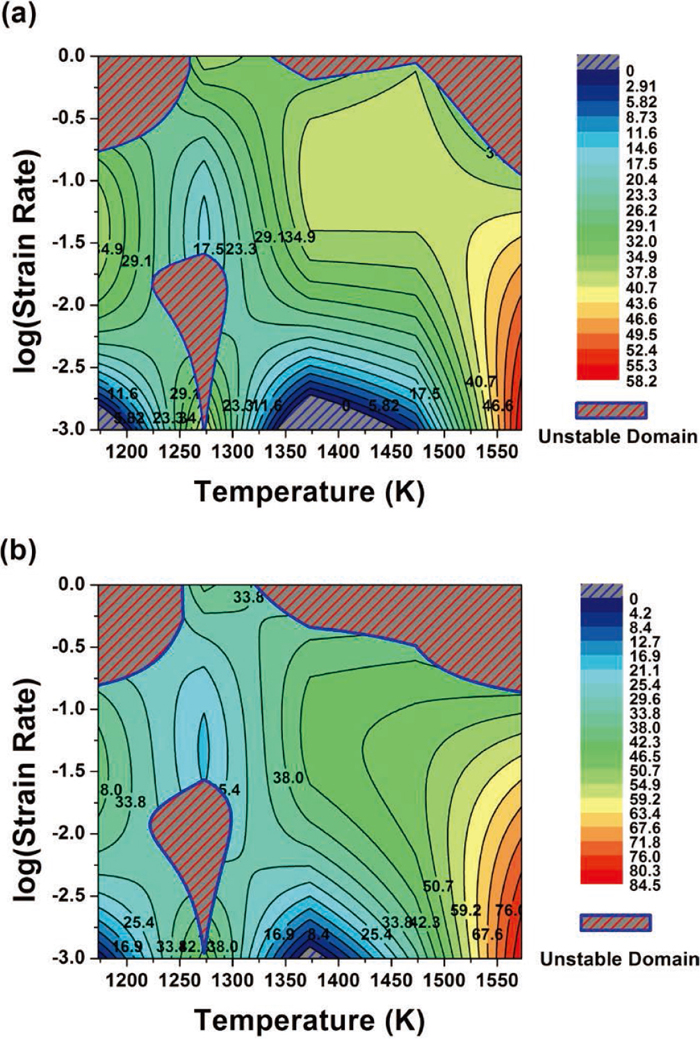
The strain rate sensitivity maps for the DP steel at the true strains of 0.1 and 0.3 are shown in Figs. 4(a) and 4(b), respectively. It can be seen that overall the strain sensitivity does not exceed the value of 0.2 over a wider extent within the map. On the other hand, at high temperatures, larger values of m can be observed, having maximum values from 0.4 to 0.73 as the strain increases from 0.1 to 0.3, respectively. Two characteristic zones appear at the bottom right corner of the strain rate sensitivity maps (labeled A in Fig. 4), which indicate that region whereby the material exhibits super-plasticity (i.e. m > 0.3) (shown in olive shaded areas). At these zones, softening, through DRV and DRX, is the main mechanism governing plastic deformation. The zones at the bottom mid-section of the maps (labeled B in Fig. 4) correspond to values of m < 0 (shown in blue shaded areas) which are labeled as abnormal calculations in many studies. According to Malas,20) negative values of the strain rate sensitivity parameter m, are obtained only under the conditions leading to localized dynamic strain aging due to the interaction of solute atoms with active dislocations. Bintu21) also proposed that the negative strain rate sensitivity is particularly pronounced at larger strains whereby strain localization may also occur. Thus, this phenomenon has been mainly related to dynamic strain aging and to the occurrence of localized Portevin-LeChatelier (PLC) deformation bands.41) This behavior results in the observation of the serrated stress-strain curves. However, according to the previous studies, the typical temperature range for dynamic strain aging is from 473 to 1073 K for austenitic stainless steels42) and 373 to 873 K for carbon steels (at carbon contents ranged from 0.07 to 0.34 wt.%).43,44) Thus, based on these studies, we may assume that the imposed temperatures in the current study are sufficiently high so that dynamic strain aging may be avoided.

Strain rate sensitivity maps for the DP steel at true strain of (a) 0.1 and (b) 0.3. (Online version in color.)
Normally, Zone B should not exist in the current study based on the fact that the stress should be increase within the strains of 0.1 and 0.3. According to the monotonicity of strain-stress, m should be greater than zero. The possible reason for the existence of Zone B may be due to instabilities during testing. The fluctuations of the true strain-stress curves at the strain rate of 10−3 s−1 (see Fig. 2(a)) may prove this observation. A close-up look at the true strain-stress curves at the strain rate of 10−3 s−1 is shown in Fig. 5. It can be seen that there are some minimal fluctuations within curves, and such fluctuations can be acceptable since the changes are relatively small. Zone C in Fig. 4(a) is another small area whereby m < 0, which is caused by the accumulative numerical errors produced during interpolation and fitting.

The fluctuation of true strain-stress curves at strain rate of 10−3 s−1. (Online version in color.)
For the power dissipation map, η can be easily obtained by Eq. (6). Similarly, for the instability map, with a quartic polynomial fitting between the data ln[m/(m+1)] and ln(
Dynamic processing maps for the DP steel at true strains of: (a) 0.1 and (b) 0.3. (Online version in color.)
By comparing Figs. 6(a) and 6(b), it can be seen that the type of deformation is very similar, which indicates that the hot deformation process under these conditions is in general very stable. In current study, the “safe” domain was further calculated based on the Alexander stability criterion,45) which can be expressed as follows:
| (12) |
The first condition of Alexander’s criterion is 0 < m ≤ 1. In current study, it is assumed that C1 is true in the entire computational domain. The second condition (C2) can be calculated based on the Eq. (11). Similar to the calculation method of m, the third condition (C3) can be obtained by cubic spline interpolation and cubic polynomial fitting. For the fourth condition (C4), the calculation is simplified in this study and its calculation steps are as follows:
| (13) |
To ensure the precision, piecewise fitting is applied during the calculation of C3 and C4. For C3, it should be noted that there are some differences between the Alexander stability criterion and the stability criteria proposed by Malas and Seetharaman and Venugopal et al. (i.e. Eq. (8)), which will further affect the calculation results of C4.
Based on Alexander stability criteria, the “safe” domain calculated for the DP steel at true strain of (a) 0.1 and (b) 0.3 are shown in Figs. 7(a) and 7(b), respectively. The calculation results show that the C3 is true in the entire calculation domain when strain rate is 0.1. It can be found that the “safe” domain becomes narrower as the strain is increased from 0.1 to 0.3. Combined with DMM model and Alexander’s criterion, the processing maps at true strain of (a) 0.1 and (b) 0.3 are shown in Figs. 7(c) and 7(d), respectively. It can be seen that generally speaking, the instability maps determined by the two methods have the similar distribution rule. The cumulative error caused by cubic spline interpolation and cubic polynomial fitting and the simplification during the calculation are the main reasons for the difference of the results. In previous studies, Samantaray et al.46) had calculated the instability regions of modified 9Cr-1Mo steel during hot deformation process using various instability criteria and DMM. It was found that Alexander’s criteria over-predict the instability domains and the instability map developed based on DMM can predict the instability domains more precisely. Because the DMM model is the focus of current study, the microstructure validation will be based on the results obtained from DMM, while the results calculated by Alexander’s criterion will only serve as a reference. For analyzing the predicted “safe” and “unsafe” domains, the obtained hot processing map can be divided into six prominent zones as indicated in Figs. 7(c) and 7(d), whereby Zone 4 corresponds to the “safe” domain for plastic deformation. The microstructures in the corresponding zones of the processing map are shown in Fig. 8.
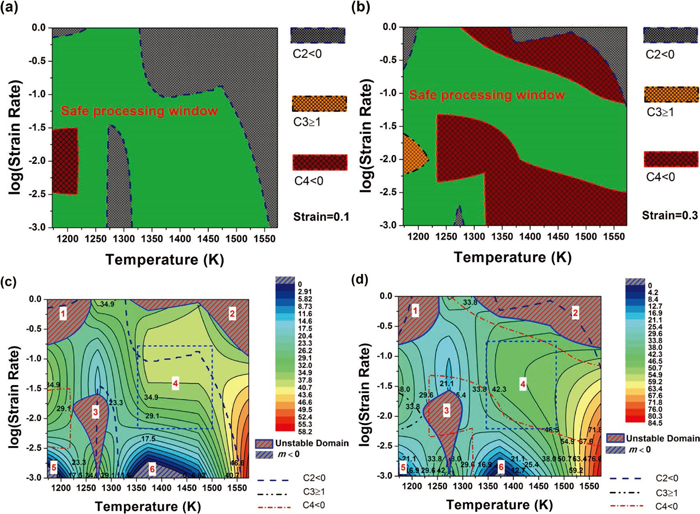
Calculated “safe” domain for the DP steel at true strain of (a) 0.1 and (b) 0.3; and the processing maps combined with Alexander’s criterion at true strain of (c) 0.1 and (d) 0.3. (Online version in color.)

Microstructures of the DP steel deformed at (a) Zone1, 1173 K/1 s−1; (b) Zone 2, 1473 K/1 s−1; (c) Zone 3, 1273 K/10−2 s−1; (d) Zone 4, 1473 K/10−2 s−1; (e) Zone 5, 1173 K/10−3 s−1 and (f) Zone 6, 1373 K/10−3 s−1. (Online version in color.)
Zone 1 and Zone 2, can occur at the testing temperature of 1173 K and 1373–1573 K, at high strain rates i.e. above 10−1 s−1, respectively. Void formation is the major instability phenomena encountered in the samples processed under those deformation conditions. The microstructure of the samples corresponding to these domains, i.e. Zone 1 and 2, are shown in Figs. 8(a) and 8(b), respectively. From Fig. 8(a), the inhomogeneous distribution of voids can be easily identified. The lower ductility at 1173 K is considered as the main reason leading to the instability during the hot deformation. Figure 8(a), show at the top-right of the image the surface fracture of the sample, which indeed indicates a type of fragile fracture having a wide area of detachment at the break-up location. Due to the lower ductility, stress concentration appears during the tests, leading to the oval shape of the voids. Comparing with Figs. 8(a) and 8(b), it can be seen that at the same strain rate, the formation of voids become finer and uniformly distributed within the microstructure when increasing temperature (at 1473 K). Also, the top-right image in Fig. 8(b) shows a ductile fracture as compared to the fragile fracture in Fig. 8(a), i.e. the ductile fracture is evidenced by the narrow area of local detachment (i.e. local point fracture of the sample). Zone 1 and 2 are labeled as an “unsafe” domains, a large number of voids are located at the grain boundaries which is indicative of instability. Theoretically, development of voids at the grain boundaries can be divided into three stages: nucleation, growth, and coalescence. The possible mechanisms for void formation are: (1) slip intersections along the grain boundaries whereby hard particles may cause local detachment, (2) sliding of grains along grain boundaries leading to local de-cohesion and (3) vacancy condensation at grain boundaries.45)
Zone 3 corresponds also to an “unsafe” domain in the processing map, which occurs at low strain rates (from 10−3 s−1 to 10−2 s−1) and around 1273 K. The microstructure at this zone (see Fig. 8(c)) is similar to that found in Zone 2 with a larger number of voids formed along the austenite grain boundaries. The main differences between Zone 2 and Zone 3 can be found when comparing the size and the distribution of voids within the microstructure. A striking feature is that the void distribution in Zone 3 is more dispersed, and the size of the void is generally larger than that in Zone 2. The main reasons for this phenomenon can be attributed to the larger grain size and lower strain rate in zone 3. Larger grain size makes voids distributed more dispersed along the grain boundaries, and lower strain rates provide longer time for the growth of voids.
In order to further distinguish between the “safe” and “unsafe” domains and to correlate these to the microstructure, Zone 4 was selected as one of an optimal processing condition for the analysis, which spreads over a wider range of temperatures, i.e. 1350–1500 K and strain rates, i.e. 10−2-10−1 s−1. The efficiency is varied from 26.2% to 40.7% at the strain of 0.1, and 33.8% to 50.7% at the strain of 0.3. Taking 1473 K/10−2 s−1 as an example, the microstructure corresponding to this condition is shown in Fig. 8(d). It can be clearly seen that the microstructure of the sample is composed of defect-free uniform equiaxed austenite grains. During the tests, the martensitic phase is formed due to quenching, so it is difficult to observe the corrugated/serrated former austenite grain boundaries.6) Based on flow behavior, the characteristics of the microstructure and the efficiency of power dissipation, it can be said that the selected optimal hot deformation condition is acceptable whereby DRV and DRX are the main softening mechanisms which dominate at this processing condition. Yet, the type of fracture in Fig. 8(d) indicates that the sample is less ductile as compared to the sample in Fig. 8(b), i.e. the sample at 1473 K/10−2 s−1 has a wider fracture surface as compared to the sample at 1473 K/1 s−1. This may be due to difference in austenite grain size, the sample in Fig. 8(b) is finer as compared to the sample in Fig. 8(d). A finer austenite grain size increases ductility due to the increase in sliding planes along the austenite grain boundaries and induces softening. The finer austenite grain size of the sample at 1473 K/1 s−1 may be due to the higher strain rate, as compared to the sample at 1473 K/10−2 s−1. An increase in strain rate leads to an acceleration on the generation of dislocations which induces grain refinement through the DRX mechanism while the DRV mechanism lowers. The sample at 1473 K/1 s−1 may have reached softening due to grain refinement followed by the formation of voids due to strain localization caused by high dislocation density regions. Thus the sample corresponding to Zone 2 may be more ductile but more unstable as compared to the sample corresponding to Zone 4.
Zone 5 and Zone 6 correspond to the undefined areas in the dynamic processing maps whereby m < 0, which are found at around 1173 K/10−3 s−1 and 1373 K/10−3 s−1, respectively. From the analysis of the microstructure in the corresponding zones, it can be seen that intergranular cracking is evident near the fracture found in the sample in Zone 5 (see Fig. 8(e)). From previous studies,47) the origin of such large cracks may be due to precipitation of carbides and/or nitrides. Another cause may be due to severe embrittlement caused by precipitation of sulphides and iron eutectics, having a low melting point, which subsequently melt leading to a local de-cohesion.48) This is often observed at the high strain rates after reheating and at high temperatures. Moreover, Fig. 8(e) shows that the sample has large austenite grains which lead to anisotropy of the microstructure. Under such conditions, the rate of entropy in the material will differ significantly with the rate of entropy imposed over the system, thus the instability will be significantly high leading to the formation of large cracks. This indicates that Zone 5 is significantly a “very unsafe” domain for processing the material. On the other hand, uniformly distributed equiaxed fine austenite grains and no evident flow instabilities were found in the sample corresponding to Zone 6 (see Fig. 8(f)). In this case the microstructure is similar to Zone 4 having a slightly larger austenite grain size in the sample in Zone 6 as compared to the sample in Zone 4. Based on the microstructure of the sample corresponding to Zone 6 (Fig. 8(f)), it can be said that Zone 6 is a “safe” domain. Moreover, a ductile surface fracture can be seen in this sample, i.e. top-right image in Fig. 8(f), similar to that found in the sample corresponding to the “unsafe” Zone 2 (Fig. 8(a)). However, the grains of the sample in Zone 6 are larger and defect free as compared to the sample in Zone 2.
The current analysis shows that the dynamic processing maps are useful for determining the “safe” domains for plastic deformation. The corresponding Zones within the maps have been successfully correlated to the microstructure and fracture surface of the samples tested. Void formation is the main cause of instability during processing, whereby it is influenced by the competing softening mechanism during hot deformation i.e. through DRV and DRX. Temperature and strain rate influence the grain size and the mechanical properties of the samples which in turn influence the formation and distribution of voids. Moreover, the undefined Zones within the maps (due to the systematic error caused when m < 0 in the DMM approach) have been further correlated with the microstructure analysis. This correlation allowed us to labeled Zone 5 as “very unsafe”, while Zone 6 has been labeled as a “safe” domain for the current DP steel. Furthermore, it seems that the sample in Zone 6 is more ductile as compared to the sample in Zone 4 which is the Zone that indicates a fully “safe” processing condition. The high ductility (based on the surface fracture) of the sample in Zone 6, at high temperature and low strain rates, may be due to local creep. The creep softening mechanism may also be the reason for the fluctuations found on the flow stress curves leading the values of m < 0.
Based on the DMM approach, the dynamic processing maps were determined for evaluating the optimum thermomechanical processing conditions, i.e. “safe” and “unsafe” zones, based on the instability criteria for flow behavior. Based on this analysis and correlation with the microstructure and fracture analysis of the samples we have reached the following conclusions:
(1) The strain sensitivity parameter m < 0 is caused by fluctuation during the experimental testing and the accumulative error during the calculation. The dynamic processing maps in the areas where m < 0 were redefined by correlating the processing conditions with the microstructure and fracture of the tested samples. The formation and distribution of voids are the main instabilities found on the samples that are within the “unsafe” domains of the dynamic processing maps.
(2) A successful correlation of the correponding Zones within the processing maps with the microstructure was achieved. In the case of undefinied Zones within the maps we have determined, based on the microstructure correlation, that the Zone 5 can be defined as a very “unsafe” processing window due to the formation of large cracks which may eventually induce failure of the work piece. On the other hand, Zone 6 has been regarded as a “safe” processing window whereby creep facilitates ductility due to high temperature and low strain rates. Also, the sample in Zone 6 showed a uniform microstructure with no visible instabilities such as voids.
(3) Finally, Zone 4 was found to be the optimum domain for hot deformation for the DP steel, which is processed within the temperature range of 1350–1500 K and strain rate range of 10−2–10−1 s−1. Defect-free equiaxed austenite grains can be observed in the samples deformed within this region and does correlate well with the “safe” domain of the calculated dynamic processing map. The main softening mechanisms which control plastic flow in this “safe” domain are DRV and DRX. Zone 4 has been suggested as the “safe” domain for hot deformation for the DP steel.
This work was supported by the international cooperative project between the University of Science and Technology Beijing (USTB) and Tata Steel, Research & Development (R&D). The authors also would like to thank the support from the Chinese government “111” project (B07003) and for the mutual international communication. The support from Ms. Yan Zhang, during the hot tensile tests performed at the Gleeble machine, is deeply appreciated.