Surface Treatment and Corrosion
Effect of Annealing Time on Oxides Phases and Morphology along Oxidized Depth of Fe-3%Si Steel during Decarburization
2019 年 59 巻 1 号 p. 152-160

詳細
2019 年 59 巻 1 号 p. 152-160
The decarburization experiments were carried out at different annealing temperatures, PH2O/PH2 and times. Under the annealing conditions in present work, the optimum annealing condition of decarburization was that annealing temperature was 1108 K under PH2O/PH2=0.317. The oxides morphology in oxidized layer was studied. The concentration distribution of silicon and oxygen along the oxidized depth was analyzed. The relationship between oxides phases, oxides morphology and concentration distribution of silicon and oxygen was established. Results showed four zones presented in oxidized layer from the atmosphere/steel interface to the steel matrix, which were enriched zone of oxides, depleted zone of oxides, spherical zone of oxides and lamellar zone of oxides in sequence. The oxidized layer of Fe-3%Si steel was composed of iron oxide, fayalite and silica. With the increase of oxidized depth, there was still some unreacted silicon atoms remained in the oxidized layer.
Silicon steel is an important functional material for energy conversion. The performance of silicon steel directly determines the efficiency of energy conversion.1,2) The magnetic properties of silicon steel will be deteriorated with time during service process, which phenomenon is known as magnetic aging. The main purpose of decarburization annealing is to decrease carbon content from 0.02–0.08% to less than 30 ppm in silicon steel and reduce its magnetic aging.3) In addition, there are many factors that affect the performance of insulating film. The most important factor is quality control of oxidized layer formed on the steel surface during decarburization annealing. It directly affects the quality of glass film formed during high temperature annealing, which in turn affects the coating quality of insulating film. Decarburization annealing also control grain size, and prevent the formation of excessive oxides to guarantee the magnetic properties of silicon steel.4)
Carbon atoms existed in the steel matrix could diffuse to steel surface and react with water vapor in annealing atmosphere to complete decarburization. Soenen et al. have shown that a slight increase of dew point can accelerate decarburization.5) Marques et al. have found increasing water vapor partial pressure in mixed atmosphere may promote decarburization in the initial stage of reaction.6) But adding more water vapor continuously will decelerate the reaction. A possible explanation of this observation is a dense oxidized layer has formed during decarburization process, which hinders decarburization reaction. Lyudkovsky et al. verify that decarburization reaction occurs faster compared with oxidation reaction between carbon, silicon and iron.7) Stephenson confirms that the internal oxides begin to form when carbon content has reduced to 0.005%.8)
Accompanied with the decarburization annealing, the oxidized layer formed on the silicon steel surface.9,10,11) The selective oxidation kinetics of silicon steel is controlled by the diffusion rate of oxygen atoms.12,13,14) and its oxidation kinetics follows the parabolic laws. From previous investigations of Geiger and Jung, there are external oxides (FeO) and internal oxides (SiO2 and Fe2SiO4) could be found on steel surface during decarburization annealing.15,16) Yamazaki et al. find the oxides morphologies of Fe-3%Si alloys are filamentary or needle-like shapes, and these morphologies affects the thickness of oxidized layer in different PH2O/PH2 atmosphere.17) Lobanov et al. consider spherical silica forms inside the grains, and lamellar silica forms around the grain boundary.18) Cesar et al. present an optimum structure of oxidized layer and a proper fayalite/silica ratio in oxidized layer of Fe-3%Si steel.19) Jung et al. have indicated that the Fourier transform infrared (FTIR) spectrometry and glow discharge optical emission spectrometry (GD-OES) may be used for the rapid quantitative analysis of fayalite and silica in surface oxide layers.20)
In this paper, the optimum annealing condition of decarburization was studied by carbon-sulfur infrared analyzer under different annealing temperature and PH2O/PH2. The evolution of oxides morphology in oxidized layer and the concentration distribution trend of silicon and oxygen in oxidized layer were observed by Scanning Electron Microscopy and Glow Discharge Spectrometer at different annealing time. The oxides phases at different oxidized depth were analyzed by X-ray Photoelectron Spectroscopy. The relationship between the structure of oxidized layer, the oxides phases and their morphology was established with a view to guiding the industrial production.
Experimental materials were cut from a cold-rolled coil to the size of 100 mm × 15 mm, the thickness of which was 0.23 mm. Its chemical composition was shown in Table 1.
| Composition | Si | Al | Mn | C | O |
|---|---|---|---|---|---|
| Content (%) | 3.0–3.1 | 0.03–0.05 | 0.009–0.01 | 0.07–0.09 | 0.002 |
In order to simulate the decarburization annealing of silicon steel, the experimental platform was designed and constructed according to the decarburization annealing furnace of silicon steel at production site, which was shown in Fig. 1. The flow of hydrogen and nitrogen in annealing atmosphere was controlled by their mass flowmeter. The moisture content contained in annealing atmosphere was controlled by dew point after humidifier. Then, the partial pressure ratio could be calculated. When annealing conditions in furnace were stable, the sample was cleaned in ultrasonic vibrator with acetone, ethanol and saturated solution of sodium hydroxide, and dried by hairdryer. Then, the sample was sent from preparation zone into soaking zone. After decarburization annealing, the sample was sent to cooling zone and cooled by pure N2.
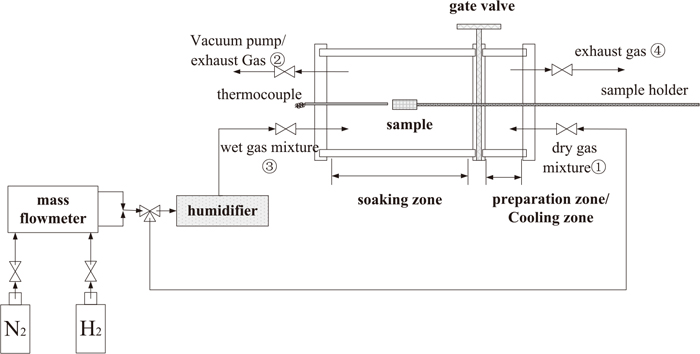
Schematic diagram of experimental platform.
Decarburization annealing experiments were carried out at different annealing temperatures, PH2O/PH2 and times. The specific conditions of annealing experiment were shown in Table 2. Under the annealing conditions in present work, the optimum annealing condition of decarburization was that annealing temperature was 1108 K under PH2O/PH2=0.317. The experimental results were shown in Fig. 2.
| Temperature (K) | H2:N2 | PH2O/PH2 | Annealing time (min) |
|---|---|---|---|
| 1098 | 3:7 | 0.317 | 1, 1.5, 2, 2.5, 3, 3.5 |
| 1108 | 3:7 | 0.317 | 1, 1.5, 2, 2.5, 3, 3.5, 4 |
| 1108 | 3:7 | 0.184, 0.242, 0.317, 0.409, 0.521 | 2.5 |
| 1108 | 2:8 | 0.184, 0.242, 0.317, 0.409, 0.521 | 2.5 |
| 1118 | 3:7 | 0.317 | 1, 1.5, 2, 2.5, 3, 3.5 |

Residual carbon concentration in the steel after decarburization (a) at different annealing temperature under PH2O/PH2=0.317; (b) in different PH2O/PH2 environment at 1108 K.
After annealing, the cross - section morphology of oxidized layer with different annealing time were observed by Nova 400 Nano SEM. The concentration distribution of silicon and oxygen within a few microns strip surface was inspected by Glow Discharge Spectrometer (GDS850), which values were only used to qualitatively analysis their tendency. The emission spectra of gas elements such as oxygen was inferior to other elements. Therefore, the sample for the same annealing condition was repeatedly inspected in order to ensure the accuracy and repeatability of silicon and oxygen analysis in GDS method. In order to investigate the morphology variation of oxides with oxidized depth, the samples were sputtered by GDS. The diameter of sputtered surface with Ar+ -ion in GDS was 5 mm. The morphology evolution of oxides on different sputtered surface was observed by Nova 400 Nano SEM. The oxides phases on different sputtered surface were analyzed by X-ray Photoelectron Spectroscopy (VG Multilab2000). The peak intensity of the sample in XPS results was affected by various factors such as the surface quality and the surface contamination. Therefore, the peak intensity could not accurately quantify their content. The spectrometer utilized monochromatic Al Ka radiation source. In order to avoid the impact of airborne molecular contamination on detection of sputtered surface, the sample was sputtered again by XPS using Ar+ -ion with 3 kV and 2 μA. The sputtering time was 8 min. The sputtering rate was 1 nm/min. The sputtering area was 5 × 5 mm2. The spectra of XPS were calibrated using C1s (284.6 eV).
Figure 3 was the cross-section morphology of Fe-3% Si steel at different annealing time. It indicated that when annealing time unchanged, the distribution of spherical oxides was uniform. Part of spherical oxides particles were dispersed in the zone of lamellar oxides particles with the increase of oxidized depth. The morphology of lamellar oxides was thin. When annealing time increased from 1 min to 4 min, the oxidized layer increased from 1.15 μm to 3.24 μm and the spacing between lamellar oxides reduced gradually.
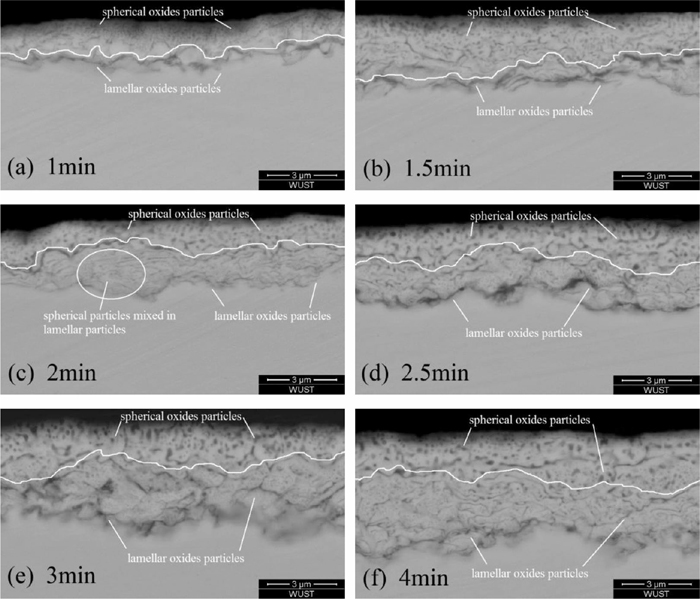
Cross - section morphology of oxidized layer in Fe-3%Si steel with annealing time 1–4 min.
In order to explore the distribution of silicon and oxygen along the thickness direction of silicon steel under different annealing times, the steel surface was analyzed by Glow Discharge Spectrometer when annealing temperature was 1108 K under PH2O/PH2=0.317. Figure 4 showed the contents of silicon and oxygen were highest at steel/atmosphere interface [position (a)] when annealing time was a constant. With the increase of oxidized depth, the silicon content reached its peak again [position (e)] after a low value [position (c)] and the oxygen content decreased after a small crest at position (e) corresponding to the peak of silicon curve.

Concentration distribution of silicon and oxygen in the oxidized layer with annealing time 1–2.5 min.
Figure 4 also showed the variation of silicon content could be divided into three zones when annealing time increased. Firstly, the silicon content remained unchanged in the oxidized zone (a)–(c). Secondly, the silicon content increased continually in the oxidized zone (e)–(h). Lastly, the silicon content was basically the same at oxidized depth (i). With the increase of annealing time, the oxygen content increased at the same oxidized depth. The oxidized depth where oxygen content nearly approached zero increased, which was consistent with the SEM results.
In order to investigate the morphology variation of oxides with oxidized depth, the samples were sputtered by GDS. The relationship between sputtered depth and oxidized position (a)–(i) was shown in Fig. 5. Figure 6 was the results of image analysis for Figs. 7, 8 and 9 by ImageJ freeware, which indicates the variation of oxides morphology, oxides content and oxides sizes distribution with sputtered depth (a)–(i) at annealing time 1 min, 2.5 min and 4 min. The area percentage of all oxides in the oxidized layer was the sum of spherical oxides area percentage and lamellar oxides area percentage.
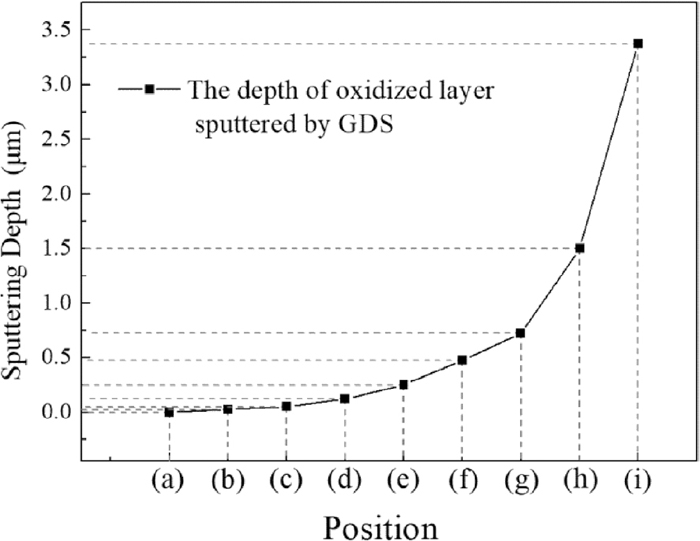
Relationship between sputtering depth and sputtering position.
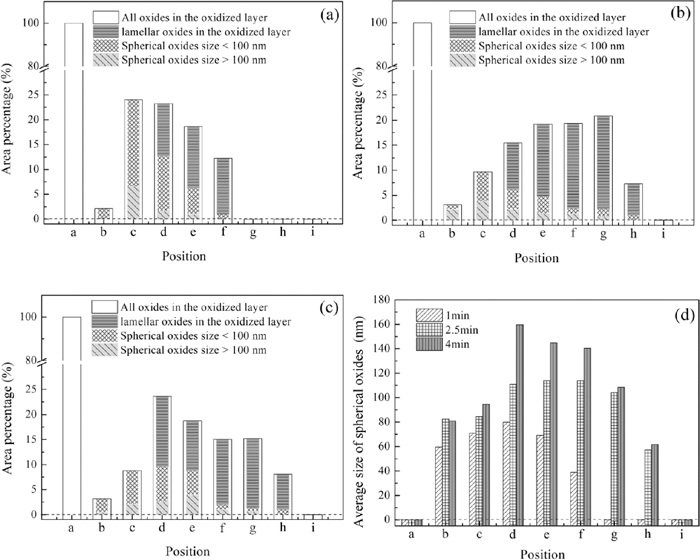
Dependence of area percentage of oxides and particles size distribution on oxidized depth (a) 1 min; (b) 2.5 min; (c) 4 min; (d) Average size of spherical oxides.
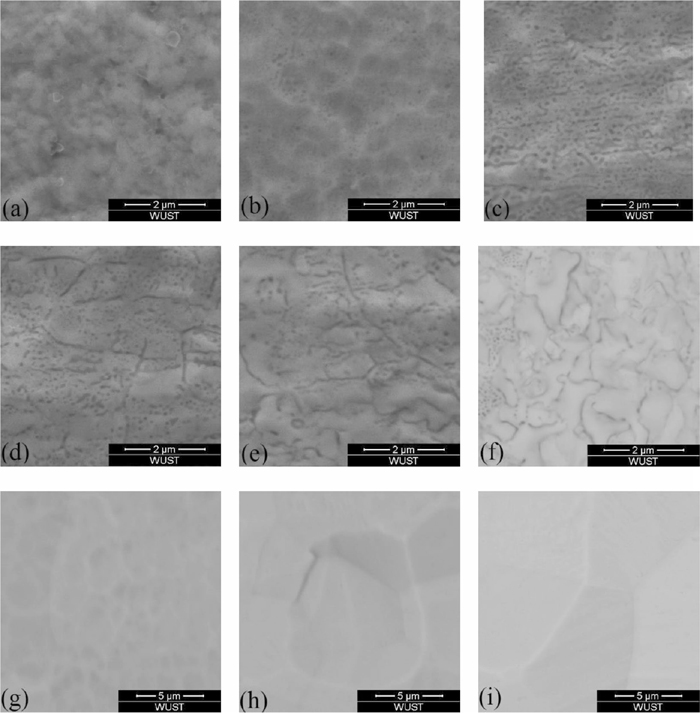
Evolution of oxides morphology at different oxidized depth of Fe-3%Si steel at annealing time 1 min.
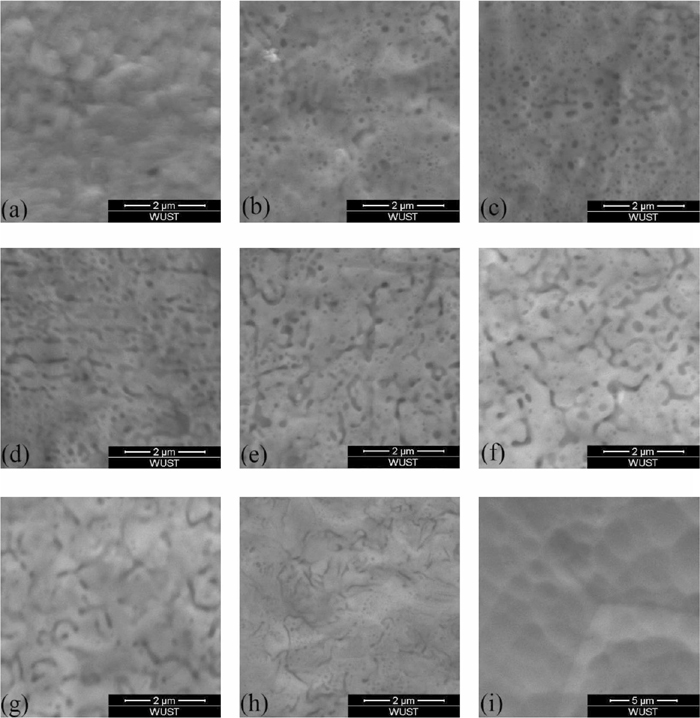
Evolution of oxides morphology at different oxidized depth of Fe-3%Si steel at annealing time 2.5 min.
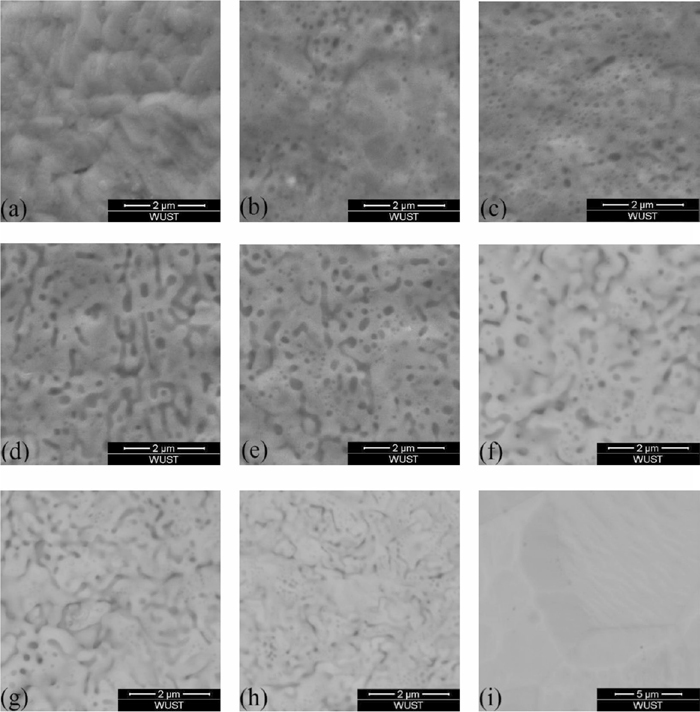
Evolution of oxides morphology at different oxidized depth of Fe-3%Si steel at annealing time 4 min.
Figure 6 showed the variation of oxides content was similar to the concentration distribution of silicon. Position (a) was the enriched zone of oxides, where the area percentage of oxides was highest and there was almost no steel matrix could be seen in Figs. 7(a), 8(a) and 9(a). Position (b) was the depleted zone of oxides, where the area percentage of oxides was less than 3%. Figure 5 showed the thicknesses of enriched zone and depleted zone were very thin. The total thickness of enriched zone and depleted zone was only 0.025 μm. With the increase of sputtered depth (c)–(i), the area percentage of oxides firstly increased, then they decreased until disappeared.
The morphology variation of oxides showed in Fig. 6 indicated that oxidized zone (c)–(e) was spherical zone of oxides, where the area percentage of spherical oxides was higher than 5%. Oxidized zone (f)–(h) was lamellar zone of oxides, where the area percentage of spherical oxides was lower than 2.5% and the area percentage of lamellar oxides was more than that of spherical oxides.
Figure 6(d) showed the main sizes of spherical oxides were lower than 100 nm at annealing time 1 min, 2.5 min and 4 min. It also could be seen that with the increase of annealing time, the spherical oxides sizes increased at the same oxidized depth.
In order to establish the relationship between oxides phases and oxidized depth, the oxides phases on the sputtered surface shown in Fig. 4 were analyzed by XPS.
Figure 10 showed the XPS results of Fe-3% Si steel after decarburization when annealing temperature was 1108 K under PH2O/PH2=0.317 at 2.5 min. Figure 10(a) was the wide range XPS survey spectrum. Figures 10(b), 10(c) and 10(d) were the XPS spectra for Fe2p, O1s and Si2p, respectively, which showed the chemical shift of Fe, O and Si on sputtered surface (a)–(i). With the increase of sputtered depth, the binding energy of Fe gradually shifted from 710.7 eV to 707.1 eV, that is, Fe converted from iron oxides to iron atoms. The binding energy of O gradually shifted from 530.68 eV to 533 eV, that is, O converted from iron oxides and fayalite to silica. The binding energy of Si gradually shifted from 102.5 eV to 103.2 eV, that is, Si converted from fayalite to silica. The silicon atoms started to appear at the sputtered depth (e). Figure 11 was the spectral fit of high - resolution spectra for O1s and Si2p at different oxidized depth.
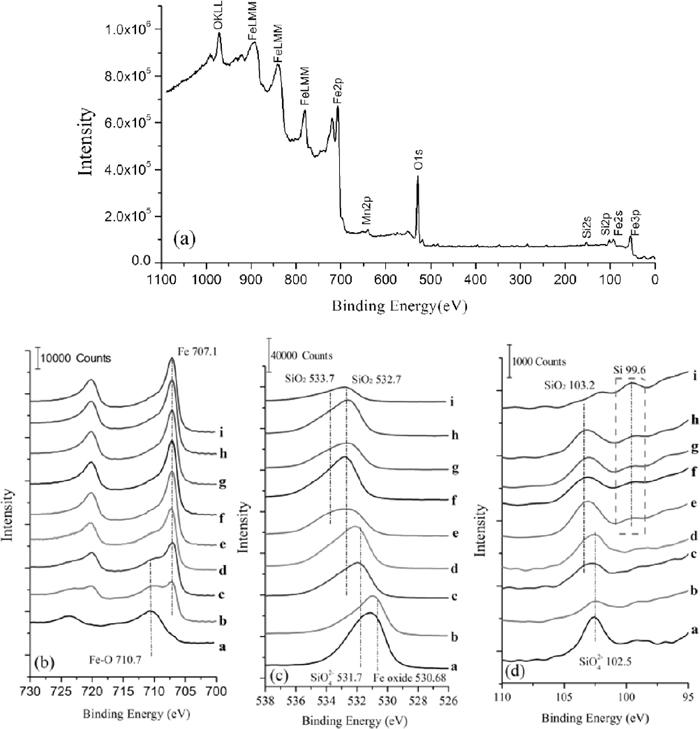
XPS spectra for specific depth (a)–(i) in oxidized layer on Fe-3%Si steel surface (a) Wide range XPS survey spectrum; (b) XPS spectra for Fe2p; (c) XPS spectra for O1s; (d) XPS spectra for Si2p.
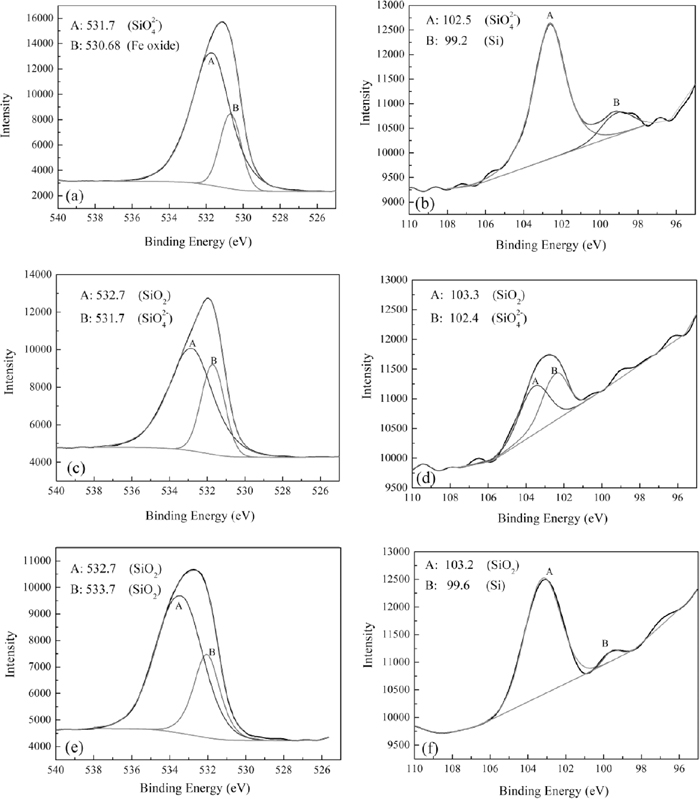
Spectral fit of high - resolution spectra for O1s and Si2p (a) O1s peak at sputtered depth a; (b) Si2p peak at sputtered depth a; (c) O1s peak at sputtered depth c; (d) Si2p peak at sputtered depth c; (e) O1s peak at sputtered depth e; (f) Si2p peak at sputtered depth e.
In order to study the enrichment degree of silicon in oxidized layer, the enrichment factor α in oxidized layer was defined as follow:17)
| (1) |
Meanwhile, in order to study the distribution trend of oxides in oxidized layer, the atomic ratio (O/Si) of oxygen atom to silicon atom was defined:
| (2) |
The results of enrichment factor α and atom ratio O/Si in oxidized layer at different annealing time were shown in Fig. 12. It could be seen that the enrichment degree of silicon changed with the increase of oxidized depth when annealing time was a constant. The enrichment factor at steel/atmosphere interface was highest. Then, after a low value of enrichment factor, α reached the peak value again. Finally, α returned to 1. Enrichment thickness of silicon dα was defined as the depth from steel surface to α≈1. When annealing time increased from 1 min to 2.5 min, dα increased which indicated the silicon atoms gradually diffused from steel matrix into oxidized layer as annealing time increased.
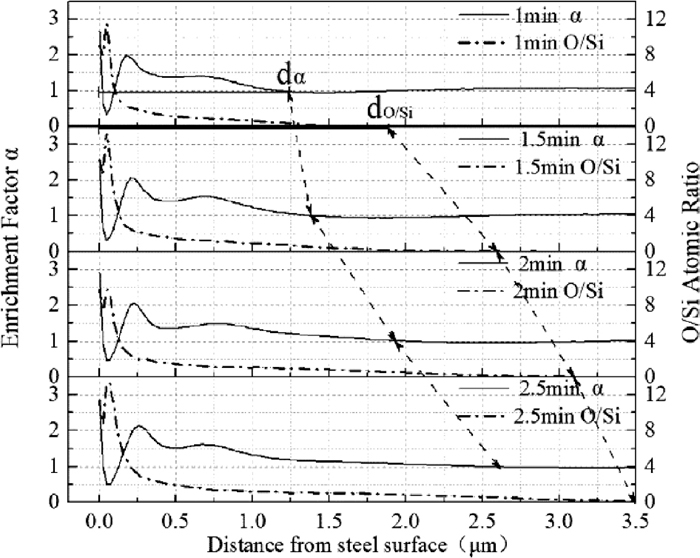
Enrichment factor of silicon and atom ratio O/Si.
From the composition of Fe-3%Si steel in Table 1, it could be seen that the silicon content in steel was the highest, which was far higher than that of other alloying elements. Therefore, the oxidation products of other alloying elements could be neglected during decarburization annealing. The atomic ratio O/Si of chemical formula Fe2SiO4 and SiO2 was 4 and 2, respectively. Figure 12 showed when annealing time was a constant, the atomic ratio O/Si was much greater than 8 at the steel/atmosphere interface where the oxidation products were iron oxides and fayalite from XPS results. With the increase of oxidized depth, the atomic ratio O/Si was between 8 and 4 where the oxidation products were fayalite and silica. When the atomic ratio O/Si was lower than 4 where the oxidation products were silica. When annealing time increased, the atomic ratio O/Si increased at the same oxidized depth and the oxidized zone do/Si increased continuously.
4.2. Solid Solution Silicon Existed in the Oxidized LayerIn order to study the phase composition with oxidized depth during decarburization annealing, the unreacted solid silicon in oxidized layer was studied. In this experiment, Fig. 10(d) showed the peak of solute Si at the oxidized depth (e)–(i). Although this peak value was very low, it also indicated that a certain amount of solute silicon existed in the inner oxidized layer. And, Fig. 4 showed the GDS curve of Si constantly changed as the annealing time increased. This means the silicon content at different oxidized depth constantly changed as the annealing time increased. If there was no solute Si in the IOZ and the silicon content in the IOZ was all from silica, then the movement of silica molecules with large sizes were difficult in such a short annealing time 1–2.5 min. So the reason for this movement was more likely the movement of unreacted solute silicon in IOZ. When the annealing time increased, the unreacted solute silicon reacted with the oxygen diffused into the matrix, then the GDS curve of Si changed.
Figures 10(c) and 10(d) showed oxides were only silica in the oxidized zone (e)–(i). The solubility product of silica in the steel was only about 10−4 ppm3.21) According to conservation of mass, the oxygen in Fe-3%Si steel at this oxidized zone was that in silica. Therefore, the unreacted solid silicon ζ (%) in oxidized layer was calculated by Eq. (3), which was only used to indicate the change trend of unreacted silicon content with annealing time and oxidized depth. The result was shown in Fig. 13.
| (3) |

Dependence of ζ on annealing time and oxidized depth.
Figure 13 showed the ζ gradually decreased as the oxidation time increased when the oxidized depth was same. Meanwhile the ζ gradually increased with the increase of oxidized depth when annealing time was a constant. Solid solution silicon started to appear at oxidized depth (e), which was consistent with XPS results in Fig. 10(d). Figure 14 was the schematic diagram of diffusion behavior and chemical reaction between silicon and oxygen atoms. As shown in Fig. 14, the reason for the unreacted solid silicon existed in the oxidized layer maybe that during the diffusion process of oxygen atoms from steel surface to steel matrix, only part of the silicon atoms encountered oxygen atoms at position (e). The others silicon could not encountered oxygen and was left in the steel. When the residual silicon content in the steel was multiplied by the square of oxygen content which was almost zero, its solubility product was still very low. Certainly, a small amount of oxygen still existed in the local of steel at position (e), but the solid silicon content at this position was almost zero. That is, its solubility product at this position was also very low. Meanwhile unreacted oxygen atoms continued to diffuse and reacted with silicon atoms at position (e + 1). With the increase of oxidized depth, the oxygen content gradually decreased and the silicon atoms participated in the oxidation reaction gradually decreased when annealing time was a constant. So the content of solid solution silicon gradually increased.

Schematic diagram of diffusion behavior and chemical reaction between silicon and oxygen atoms.
The unreacted silicon atoms existed in oxidized layer, which may be closely related to the diffusion coefficient of oxygen and silicon atoms. The diffusion coefficients of silicon and oxygen atoms in steel matrix were shown in Eq. (4):22,23)
| (4) |
| (5) |
Another explanation was that when oxygen atoms was meeting with silicon atoms, the reaction between them was very slow owing to the low contents of silicon and oxygen atoms in oxidized layer. When reaction rate was much lower than diffusion rate of oxygen atoms in steel matrix, the silicon atoms and oxygen atoms could not react with each other. Therefore, there was solid solution silicon existed in the oxidized zone. However, there was no exact data to show the change of reaction rate between silicon atoms and oxygen atoms. So this interpretation was only a hypothesis.
4.3. Oxides MorphologyThe oxides morphology was also closely related to the diffusion of oxygen and silicon atoms and the reaction between them. As shown in Fig. 3, it was assumed that the oxides particles nucleated at oxidation front which was the oxidized layer/steel matrix interface. When the silicon atoms reacted with oxygen atoms were depleted, the oxidation front moved toward steel matrix. The moving rate of oxidation front was closely related to the thickness of oxidized layer, which was shown in Eq. (6):
| (6) |
When annealing temperature was 1108 K, the diffusion coefficient of oxygen in the amorphous silica was 3.69×10⁻¹⁴ μm2s−1, which was much lower than its diffusion coefficient in steel matrix 83.177 μm2s−1. That is, silica hindered the diffusion of oxygen atoms, which slowed the forward movement of oxidation front. Meanwhile the barrier effect of lamellar oxides on oxygen diffusion was heavier than that of spherical oxides as shown in Fig. 14. When lamellar oxides formed, the moving rate of oxidation front was lower and the growth time of the oxides was longer based on Eq. (6). The lamellar oxides were more likely to be formed, which mainly formed in the zone near oxidized layer/steel interface.
(1) Oxidized layer was divided into enriched zone, depleted zone, spherical zone and lamellar zone based on oxides content and morphology. The thicknesses of enriched zone and depleted zone were very thin. Spherical oxides mainly formed above oxidized depth (e) in GDS curve.
(2) Silicon atoms diffused from steel matrix to the steel/atmosphere interface gradually. Silicon atoms enriched in the surface of steel. The thickness of oxidized layer was a little less than that of enriched Si layer.
(3) Oxidized layer in the surface of steel was composed of iron oxides, fayalite, silica and a few silicon atoms in sequence.
(4) With the increase of annealing time, the thickness of oxidized layer and enriched Si layer increased, and spherical oxides sizes increased at the same oxidized depth.