Abstract
The time-temperature-precipitation (TTP) diagram called as C-curve of the sigma phase in duplex stainless steel was investigated to clarify the effect of each amount of alloying elements. Because of the trade-off between the improvement for corrosion resistance and avoiding the sigma phase precipitation regarding the increase of Cr and Mo, it is important to clarify the effect of each alloying elements on the nose temperature and time of the TTP curve which indicates the critical heating condition to be free from harmful phase precipitation.
By using 25/28%Cr duplex stainless steel containing various levels of Cr, Mo and W, the TTP curve was obtained experimentally via the microstructure observation test with an optical microscope after heating at various temperatures. The calculated TTP curves were also obtained from the physical model of sigma phase growth rate which has been proposed in the previous work by the authors of this work. Those calculated TTP curves almost agreed with the experimental results. It was possible to explain the influence of alloying elements of Cr, Mo and W on the TTP curve from the effect on the parameters in the kinetic model proposed.
1. Introduction
Duplex stainless steels are widely applied to various structures because they exhibit high cost performance with regard to high corrosion resistance, high strength and high toughness though containing low nickel content comparing with that in other high corrosion materials. In later years superduplex stainless steels improved in terms of corrosion resistance due to the increase the amount of chromium, molybdenum, tungsten1) and nitrogen were developed. The increase of the amount of these elements promotes the harmful intermetallic phase such as the sigma phase, therefore the prevention of this phase formation is an important subject in the welding process as well as in the manufacturing process.
Many research works focused on the sigma phase precipitation in duplex stainless steel applicable to the heat treatment process, hot work process or welding process. In many research works including those on precipitation kinetics of the sigma phase, the growth properties have been determined by using an experimental method and in steels of various chemistries. In the application of duplex stainless steel in practical industries, the time-temperature-precipitation (TTP) diagram is useful for the prediction of sigma phase precipitation. Therefore many works2,3,4,5,6,7,8,9) regarding the TTP diagram have been presented, however, regarding the effects of alloying elements on the TTP diagram most of those works rarely go beyond comparing between the some kinds of duplex stainless steels. The influence mechanism of alloying elements on the TTP curves is not always investigated sufficiently. So far the effects of molybdenum and nickel on the TTP curve the systematic investigation for each alloying element has already been reported by the suthors.10) In previous work11) a new kinetic model was proposed and the quantified parameters to describe the effects of alloying elements on isothermal growth rate constant of the sigma phase in duplex steels were obtained. In this work using those findings the TTP diagram called as C-curve of the sigma phase in duplex stainless steel was investigated to clarify the effect of chromium and tungsten and its mechanism.
2. Experimental Procedure
The experimental data obtained in previous work11) were employed herein. The materials used are duplex stainless steels consisting of 23% to 28.5% Cr, 2% to 4% Mo,7% Ni and 0.3% N and the evaluation test involved the measurement of the sigma phase fraction in specimens heated at a constant temperature as already shown in previous work.11)
3. TTP Curve of Sigma Phase Precipitation in Steels with Various Chemistries
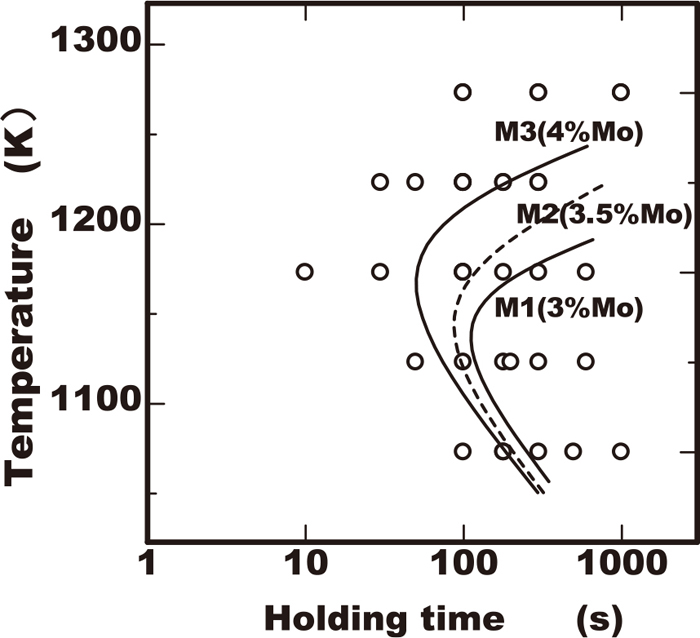
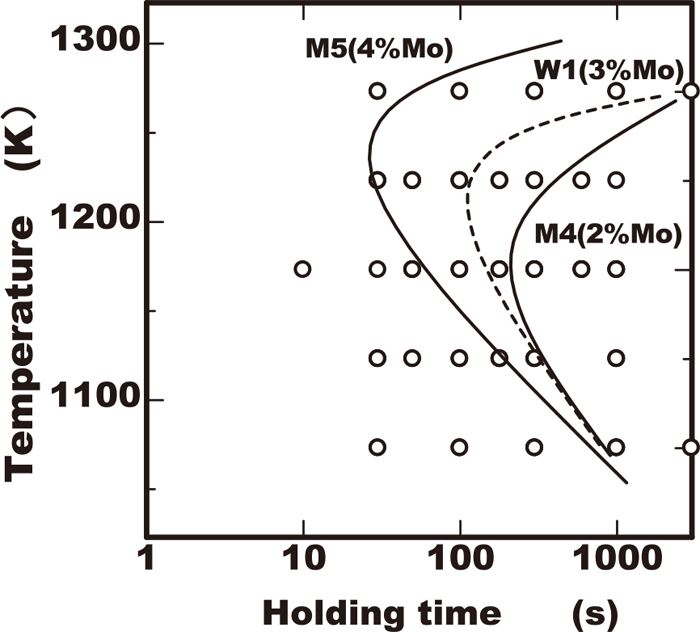
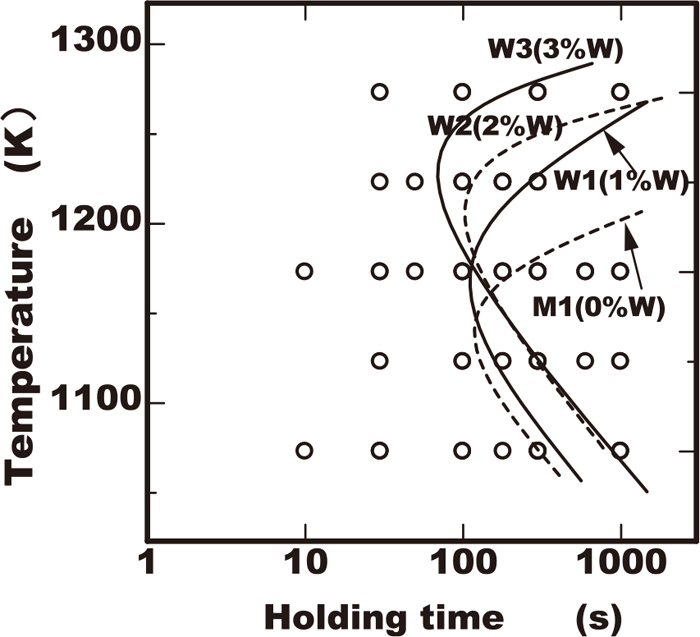
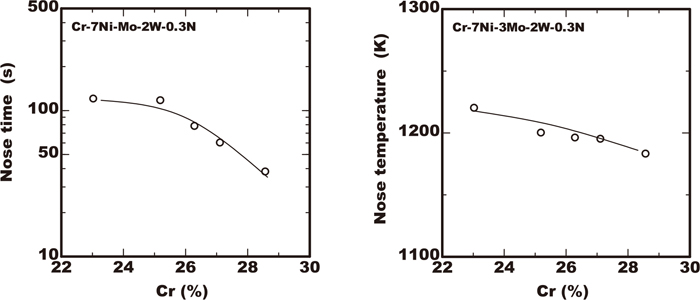
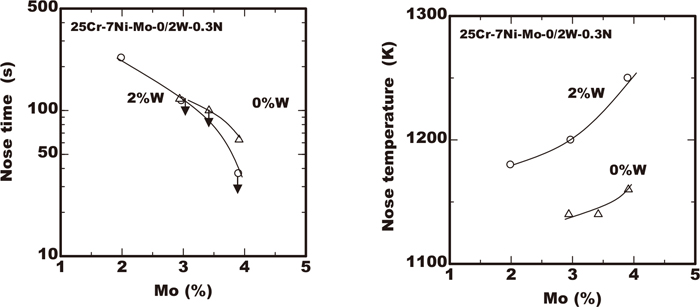
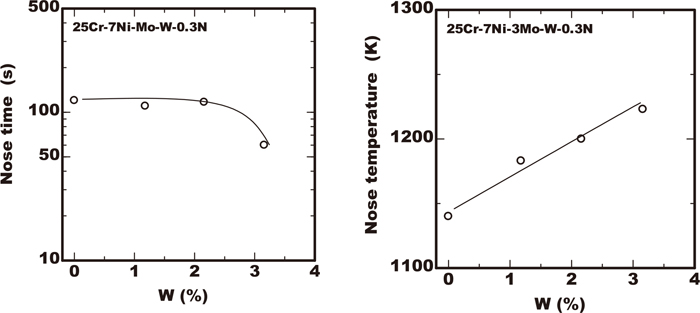
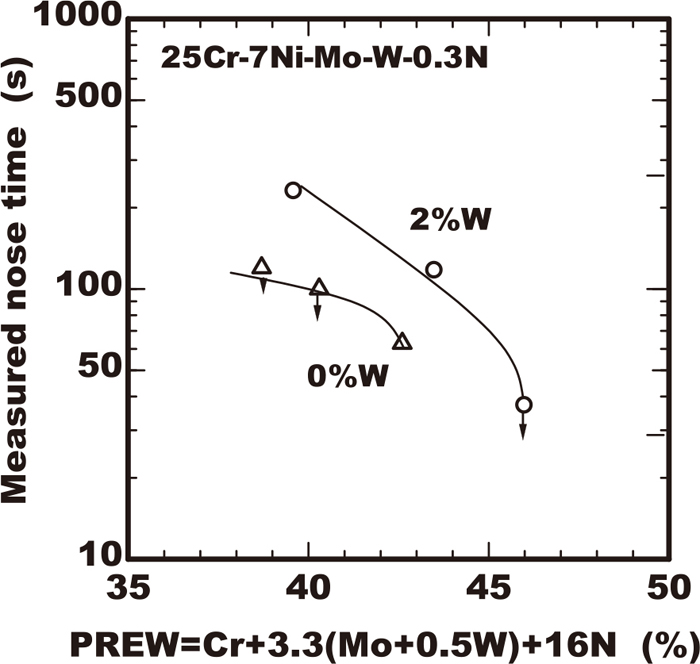
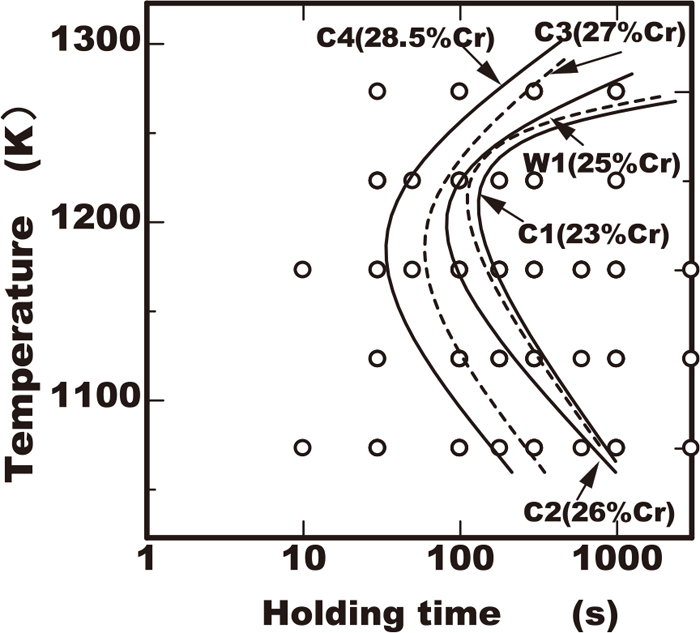
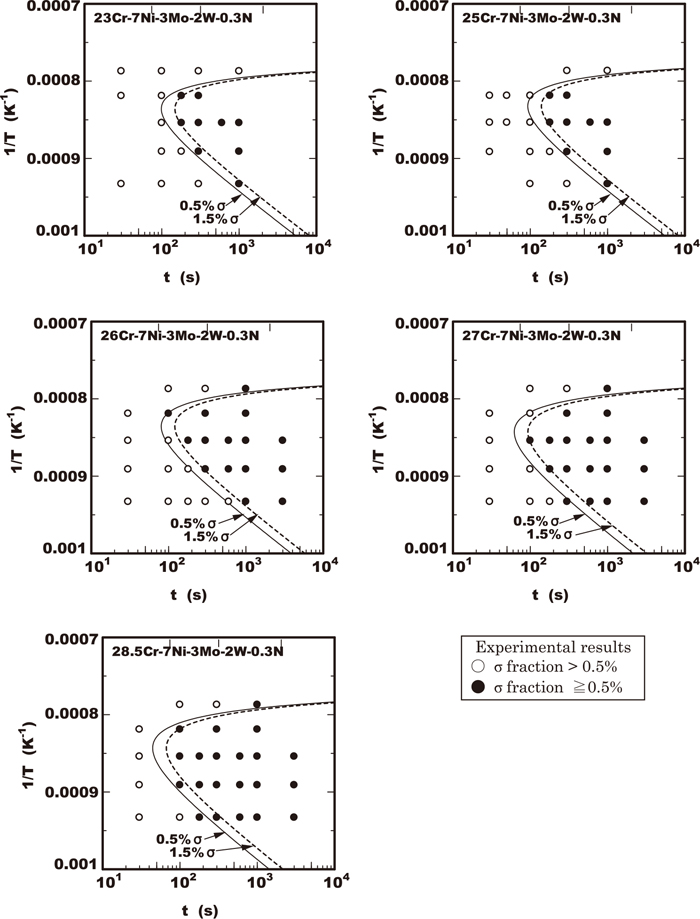
Figures 1, 2, 3, 4 show the TTP curves obtained from experimental data of 23/28.5%Cr-7%Ni-2/4%Mo-0/3%W-0.3%N duplex stainless steels containing various amount of chromium, molybdenum and tungsten using the data obtained in the previous work.11) In these figures, the initiation curves of precipitation were determined with the temperature and time excess being 0.5% in the area fraction. From the point of view of the industrial application, the time and temperature at the nose of the TTP curves with the minimum time in precipitation is important. The time and temperature at the nose were obtained from experimental TTP curves. The results of the effects of alloying elements on each nose time or nose temperature were plotted as shown in Figs. 5, 6, 7. The increase of chromium in steels reduced the nose time and lowered the nose temperature marginally as shown Fig. 5, extending the width of C curves to the direction of temperature axis as shown in Fig. 1. As shown in Fig. 6 in comparison with chromium, the increase of the amount of molybdenum in steels reduced the nose time and raised the nose temperature more remarkably. On the contrary the increase of tungsten of less than 3% gave the rare influence on the nose time though that raised the nose temperature. As Fig. 8 shows those nose times were plotted for the pitting corrosion resistance index PREW of Cr+3.3(Mo+0.5W)+16N. In case of the same PREW value the nose time in steels containing tungsten of 2% was longer than those without tungsten. The experimental results indicated that using tungsten to improve the pitting corrosion resistance of duplex stainless steels is more preferable rather than adding molybdenum from the point of view of avoiding the increase in the sigma phase precipitation risk.
4. Modelling of TTP Curve
The kinetic model proposed in our previous work11) was used to conduct the modelling of TTP curve. The TTP curve is considered as the contour line of precipitation fraction, therefore the TTP curves corresponding to a progress ratio of precipitation X0 are calculated in the following way from Eqs. (1) and (2) suggested in our previous work.11)
|
X
0
=1-exp[-
(
k
p
t)
m
] (m=5/2)
| (1) |
|
k
p
=
K
oo
(
T
eq
/ΔT)
4/5
D
eff
exp[-Δ
G
h
/RT]
| (2) |
where ΔG
h=
ϕ(T
eq/ΔT)
2, T
eq is equilibrium solvus temperature of intermetallic phase, ΔT is the degree of undercooling (=T
eq−T), D
eff is D
cr in case of nucleation as sigma phase or is (D
cr3/2D
w)
2/5 in case of nucleation as chi phase, and
ϕ and K
oo are as follows.
|
ϕ=32π/15
V
2
N⋅
σ
3
/
(
C
p
ΔH)
2
| (3) |
|
K
oo
=
[
(
16
2
⋅
π
2
/15V⋅
C
o
N
x
ω
o
1
/
2
σ
2
/
(
C
p
ΔH)
2
/
r
a
4
)
]
2/5
| (4) |
where N
x is number of atom to determine growth rate, V is molar volume, r
a is a lattice constant,
σ is interface energy, ΔH is enthalpy of transformation, C
p is concentration in intermetallic phase of dominant atom to determine the growth rate and C
o is concentration in steel of dominant atom to determine growth rate.
The time tc reaching each progress ratio of precipitation X0 is calculated by the Eq. (5) obtained from the above Eqs. (1) and (2).
|
t
c
=
K
oo
-1
[-ln(1-
X
0
)]
2/5
(
T
eq
/ΔT)
-4/5
/
D
eff
⋅exp[Δ
G
h
/RT]
| (5) |
The temperature at the nose of TTP curve is obtained as the solution giving the value of 0 to the Eq. (6), which is the derivative of Eq. (5).
The values of ϕ, Koo and Teq listed in Tables 2 to 4 of previous paper were applied for the calculation.
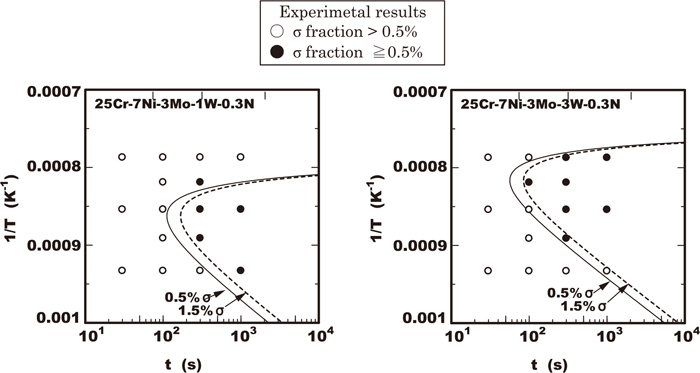
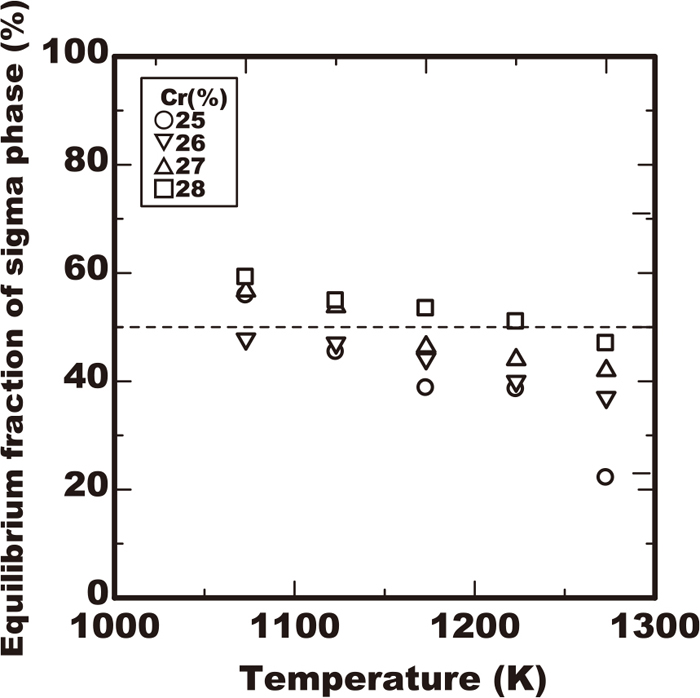
The experimental TTP curve for the industrial use is determined as a contour curve of volume fraction of sigma phase fs0 and not as that of the progress ratio of precipitation X0. The value of X0 is considered as approximately twice of the volume fraction so far regarding the sigma phase in the vicinity of nose temperature. Because the fraction of the sigma phase in the equilibrium fseq is assumed to be as at most 50% in vicinity of the nose temperature as shown in Fig. 9 and the value X0 corresponds to fs0/fseq. Therefore the calculation of TTP curves was conducted upon this assumption.
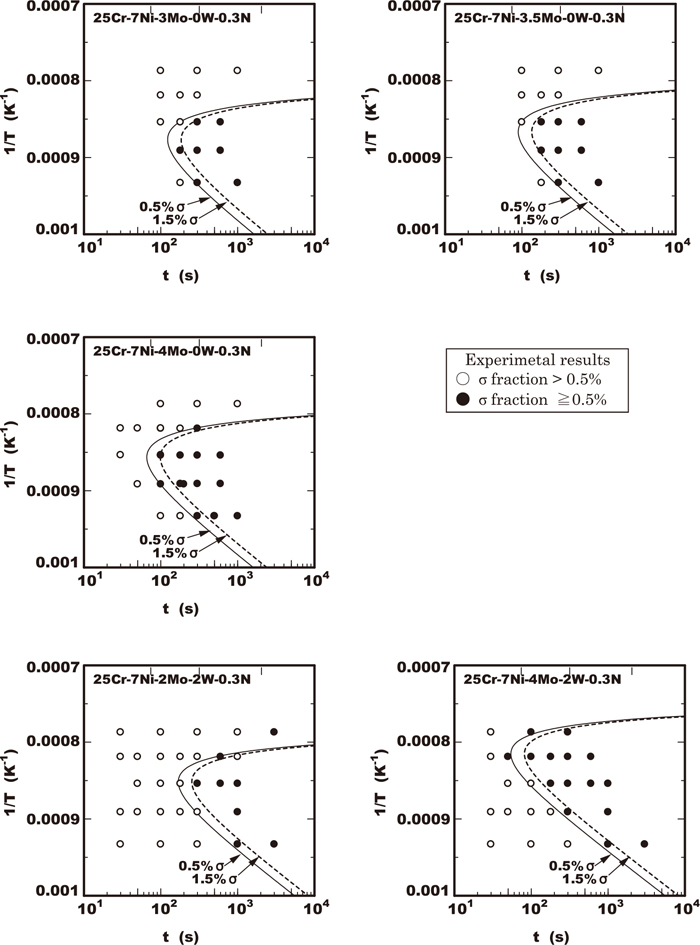
The calculated TTP curves reaching the sigma phase volume fraction of 0.5% and 1.5% in the 23/28.5%Cr-7%Ni-2/4%Mo-0/3%W-0.3%N steel by using the Eq. (5) were drawn as a solid line and dot line respectively in Figs. 10, 11, 12. The vertical axis of those figures is the inverse of absolute temperature as Arrhenius’ plot. In the vertical axis the upper direction corresponds to higher temperature due to the description upside down. The calculated TTP curves of 0.5% and 1.5% sigma phase fraction almost agreed with the experimental results of excess of 0.5% in sigma phase fraction plotted with solid marks in the TTP diagrams. It was confirmed that the kinetic model proposed as Eq. (5) is applicable to the analysis of the TTP curves in the early stage of sigma phase precipitation about 1% fraction.
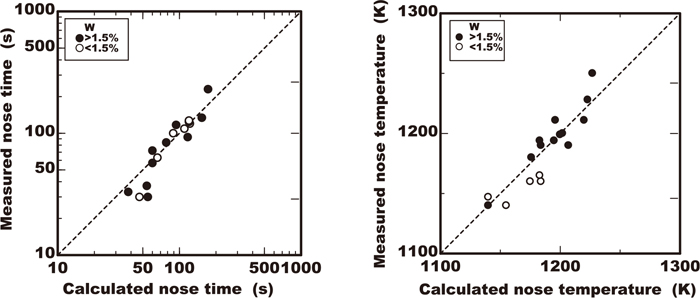
The calculated nose time and nose temperature of 0.5% sigma phase fraction were also obtained with Eqs. (5) and (6). Figure 13 shows a comparison of results with the experimental results. They were both confirmed to be a sufficient fit. that the applicability of this kinetic model to the prediction of nose time and temperature was confirmed.
5. Discussion
The kinetic model was proposed from a point of simplifying as possible though dominant factors are based on the physical principle. Therefore in simplified modeling process there are two important points to be considered in the practical application. One is that the dependence of super saturation ω0 on temperature is assumed to be negligible. The super saturation ω0 in the Eq. (4) was defined as constant therefore K00 had no dependence on temperature. The other is that the fraction of the sigma phase in the equilibrium fseq is simplified as a constant value in all the calculated temperature range. In the vicinity of the nose temperature both of these simplifications are considered not to be so problematic because the dependence of ω and fseq on the temperature is very small and did not cause disagreement with the experimental facts as already explained in Fig. 13. However in the vicinity of the solvus temperature Teq, these assumptions are not always valid. Therefore in Figs. of 10, 11, 12, the disagreement of the calculated curves with the experimental results was more remarkable in the higher temperature range. Consequently the kinetic model proposed is applicable in the vicinity of the nose temperature which is important in practical industrial, for example during welding or heat treatment process.
The effects of the alloying elements of chromium, molybdenum and tungsten on the TTP curves are discussed with reference to the parameters K00, ϕ and Teq given in Tables of 2 to 4 of a previous work.11) The TTP curve was shifted to the short time direction by the increase of chromium content but that slightly extended in the direction of the high temperature. This is explained by the increase of the parameter K00, ϕ and the solvus temperature Teq with the increase of chromium content. By the increase of K00 the time tc is reduced from the Eq. (5) resulting in the shift of nose time to shorter. The effect of elevating the TTP curve to the high temperature side by the increase of Teq is partially cancelled by the increase of the parameter ϕ which relates to the energy barrier for the nucleation of precipitates. Consequently the shift of TTP curve to the high temperature becomes slight. By the increase of molybdenum the TTP curve was remarkably shifted to both of the shorter time and the higher temperature direction. This is explained by the elevating of Teq. Because the parameters of Koo and ϕ were not influenced by the molybdenum content among the steels tested with the same tungsten content. As shown in Fig. 11 the TTP curve calculated by just varying Teq in Eq. (5) agreed with the experimental results. This supports the fact that the influence of molybdenum is dominated by the increase of Teq. Regarding the tungsten, the TTP curve was shifted to the high temperature direction but the shift to the short time direction did not occur through the increase of the content. This is explained by the decrease of the parameter K00, ϕ and the increase of solvus of Teq with the increase of the tungsten content. By the increase of tungsten the TTP curve was shifted to the high temperature direction as well as molybdenum. This is explained by the elevating of Teq and the decrease of ϕ. However the effect to accelerate the precipitation is partially cancelled by the decrease of K00. It is considered that is why the shift of the TTP curve to the short time did not occur.
The effects of the alloying elements of chromium, molybdenum and tungsten on the nose time in the TTP curve are explained in the same way as those regarding the shift of the curves to the time direction mentioned above.
The influence mechanism of the alloying elements of chromium, molybdenum and tungsten on the parameters of K00 and ϕ had already been described in our previous work.11)
6. Conclusion
The following conclusions were obtained from the investigation regarding the TTP curve of the sigma phase precipitation of 23/28.5%Cr-7%Ni-2/4%Mo-0/3%W-0.3%N duplex stainless steels in this work.
(1) The minimum initiation time of precipitation in TTP curve is reduced by the increase of chromium and molybdenum due to the increase in the equilibrium solvus of sigma phase.
(2) The minimum initiation time of precipitation in TTP curve is not changed by the increase of tungsten less than 2% although the nose temperature is raised.
(3) TTP curve of sigma phase precipitation is described by using the kinetic model proposed. It was confirmed that the calculated TTP curves have good fit to the experimental results in the vicinity of the nose of the curves.
(4) It is possible to explain the influence of alloying elements of chromium, molybdenum and tungsten on TTP curve by considering the effect on the parameters in the kinetic model proposed.
References
- 1) K. Ogawa, H. Okamoto, M. Igarashi, M. Ueda, T. Mori and T. Kobayashi: Weld. Int., 11 (1997), 14.
- 2) P. Ferro and F. Bonollo: Metall. Mater. Trans. A, 43 (2012), 1109.
- 3) X. Li, A. P. Miodownik and N. Saunders: Mater. Sci. Technol., 18 (2002), 861.
- 4) J. O. Nilsson, P. Kangas, T. Karlsson and A. Wilson: Metall. Mater. Trans. A, 31 (2000), 35.
- 5) K. Nishimoto, K. Saida and O. Katsuyama: Weld. World, 50 (2006), No. 3–4, 13.
- 6) J. O. Nilsson, T. Huhtala, P. Jonsson, L. Karlsson and A. Wilson: Metall. Mater. Trans. A, 27 (1996), 2196.
- 7) S. Hertzman, T. Huhtala, L. Karlsson, J. O. Nilsson, M. Nilsson, R. Jargelius-Pettersson and A. Wilson: Mater. Sci. Technol., 13 (1997), 604.
- 8) K. Kondo, M. Ueda, K. Ogawa, H. Okamoto and M. Igarashi: Proc. Innovation Stainless Steel, Associazione Italiana di Metallurgia, Milano, (1993), 2-191.
- 9) Y. S. Ahn and J. P. Kang: Mater. Sci. Technol., 16 (2000), 382.
- 10) K. Ogawa and T. Osuki: Q. J. Jpn. Weld. Soc., 33 (2015), 62 (in Japanese).
- 11) K. Ogawa and T. Osuki: ISIJ Int., 59 (2019), 122.