Abstract
The melt flow and bubble motion in a 230×1300 mm2 continuous casting slab mold were investigated under different inclination angle, divergent angles and immersion depth of the submerged entry nozzle (SEN) and different argon gas injection rates using a volume of fluid (VOF) and discrete phase model (DPM) to avoid slag entrapment and enhance the removal rate of nonmetallic inclusions. Water-model experiments were conducted to validate the numerical models. Moreover, the optimized conditions were applied in a manufacturing plant. The results showed that the simulated steel/slag level fluctuation and argon bubble trajectories are consistent with the experimental results. The optimized SEN structure has an inclination angle of 20° and a divergent angle of 9°, which can improve the flow pattern in the steel/slag interface, alleviate the level fluctuations, decrease the chance of slag entrapment, and optimize the movement of inclusions. The immersion depth of SEN should be 150 mm, which is beneficial to the floating removal of non-metallic inclusions and reduce the level fluctuation at steel/slag interface. The optimal argon gas blowing rate to avoid slag entrapment near the SEN is 10 L/min. Furthermore, the rate of edge defects (ED) in the hot roll strip induced by slag entrapment is apparently reduced by applying the above conditions.
1. Introduction
Metallurgical behavior in the mold affects most defects in the continuous casting (CC) of steel and is determined by the steel flow pattern and mainly affected by the submerged entry nozzle (SEN) and argon blowing.1,2) The flow pattern of the steel/slag interface controls slag entrapment, bubble motion, and inclusion removal behavior in the mold.3) Many previous studies regarding the effects of SEN4,5,6,7) and argon gas injection8,9,10,11) on the turbulent flow and level fluctuations in the CC mold have been reported. Morales et al.5,7) physically investigated the effect of the nozzle port shape on the turbulent flow in a slab mold by applying particle image velocimetry and concluded that flows using a special bottom design with a square-port nozzle yield less significant effects with regard to the secondary phase. In the CC process, argon is usually blown to prevent nozzle clogging and reduce the impact of melt flow, significantly affecting the flow behavior in the upper recirculation zone.8) Liu et al.9) numerically analyzed the effect of argon bubbles on the melt flow in a CC mold and found that large bubbles attack the meniscus and induce upward-directed steel flows in the free surface near the SEN, while small bubbles are trapped by the solidification front. Srinivas et al.10) investigated the multiphase vortex flow in the CC slab mold under different SEN and air flow rates by water-model experiments and concluded that the increase in the air flow rates decreases not only the number of vortices but also their depths. The investigations described above focused on the inclination angle (IA), immersion depth, and port shape of SEN, with no consideration of the divergent angle (DA) of SEN being widely applied in the previous studies of the pouring process of rectangular billet to reduce the impact effect of jetting flow on the mold and to control the slag entrapment.1,12) Then, the DA was innovatively proposed for slab casting to further improve the flow pattern. Moreover, there has been no comparison of the practical applications before and after optimization based on the above-described research outcomes.
To reduce edge defects (ED) in hot roll strips induced by slag entrapment in a slab mold poured by the original SEN (with IA, DA and immersion depth values of 15°, 0°, and 150 mm, respectively), the molten steel flow in a 230×1300 mm2 slab mold with blowing argon was calculated using the volume of fluid (VOF) and discrete phase model (DPM). Water-model experiments were conducted to intuitively observe basic flow behavior and validate the numerical model. Moreover, the effects of the IA, DA and immersion depth of SEN and the argon blowing rate on the turbulent flow and level fluctuations in the slab mold were investigated. Furthermore, ED distribution before and after SEN and argon blowing optimizations were statistically measured and compared to demonstrate the benefits of the optimized SEN and argon blowing.
2. Model Descriptions
2.1. Basic Assumptions
A multiphase coupled with DPM was established based on the following assumptions:
(1) The liquid steel is assumed to be an unsteady-impressible viscous fluid.
(2) The solidified shell in the mold is ignored.
(3) The effects of oscillation, arc, and taper of the mold on the flow pattern are ignored.
(4) The interaction between the bubbles is ignored, the diameter of the bubbles is assumed to be constant (0.5 mm), and the temperature of the argon is equal to that of the steel.
2.2. Governing Equations
2.2.1. Turbulence
The continuity and momentum equations are as follows:
|
∂(
ρ
u
i
u
j
)
∂
x
j
=
∂
∂
x
j
[
μ
eff
(
∂
u
i
∂
x
j
+
∂
u
j
∂
x
i
)
-
∂P
∂
x
i
+ρ
g
i
+
F
T
| (2) |
where
ui is the velocity in the
i direction,
P is the pressure,
ρ is the density of the fluid, and
μeff represents the effective viscosity. The low-Reynolds number k-
ε turbulent model
13) was chosen to simulate the turbulence in the mold.
2.2.2. Multiphase Model
The steel/slag interface fluctuation in the mold is tracked by the VOF method, which can track the shape of the fluctuating steel/slag interface. The detailed information and equations related to the VOF model used for representing the movement of the mold slag layer can be found elsewhere.14) The FT in Eq. (2) is the surface tension source term:
|
F
T
=2
σ
t
ρ
m
∇
α
i
/
∑
i=1
n
ρ
i
| (3) |
where
σt=1.4 is the surface tension coefficient.
2.2.3. Discrete Phase Model
The DPM is applied to simulate the movements of the bubbles during the casting process with argon blowing. The equilibrium equation is as follows:
|
d
u
p
d
t
=
F
D
(
u
→
-
u
→
p
)
+
g
→
ρ
p
(
ρ
p
-ρ
)
+
F
→
| (4) |
where
F
→
is an additional acceleration term,
F
D
(
u
→
-
u
→
p
)
is the drag force per unit particle mass, and
|
F
D
=
18μ
ρ
p
d
p
⋅
C
D
R
e
p
24
d
p
| (5) |
Here,
u
→
and
u
→
p
are the fluid phase and argon velocity, respectively,
μ is the molecular viscosity of the fluid,
ρp and
dp are the density and diameter of argon, respectively, and
Re is the relative Reynolds number.
2.3. Initial and Boundary Conditions
For the inlet, vz = vin = vcast×
S
mold
S
SEN
= 1.469 m/s, vx =vy = 0, in which vcast = 1.5 m/min is the casting speed, Smold and SSEN are the cross section areas of mold and SEN, respectively. The turbulent kinetics energy (TKE) kin = 0.01
v
in
2
, and turbulent dissipation rate
ε=
k
in
1.5
/D
. For the outlet, the fully developed flow condition is adopted where the normal gradients of all variables are set to zero. For the free surface, the adiabatic condition is chosen.
For the argon phase, the injection position is located at the mold inlet, and the escape boundary condition is applied for the inlet and the outlet while the reflecting boundary condition is used for the mold wall.
2.4. Model Building and Parameters
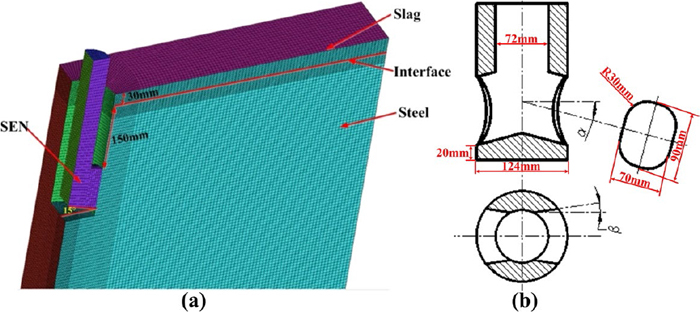
A quarter of the three-dimensional (3D) schematic sketch of the top part of the meshed mold is shown in Fig. 1, where the length of the computational domain is 1200 mm, IA (α in Fig. 1) and DA (β in Fig. 1) are 15° and 0°, respectively, and the slag layer thickness is 30 mm. For a more accurate simulation of the behavior of the steel/slag interface, the local grid refinement technique is applied in which the mesh size on and below the domain of the steel/slag interface is 30 mm, which is considerably smaller than that at the other sites.
The governing equations are solved using the FLUENT commercial software package, where the PISO algorithm is chosen for the velocity iterations and the PRESTO algorithm is chosen for the pressure. Moreover, the under-relaxation factors were 0.2, 0.3, 0.4, and 0.4 for the pressure, moment, k, and ε, respectively. The criterion for convergence was set based on the residuals for all of the abovementioned variables such that they must be less than 10−4. In the calculations, the density of steel, slag and argon are 7000 kg·m−3, 2700 kg·m−3, and 0.27 kg·m−3, and the viscosity are 0.0065 Pa·s, 0.2 Pa·s, and 7.42×10⁻⁵ Pa·s, respectively.
3. Results and Discussions
3.1. Model Verifications
The simulation results of the multiphase flow field are verified by the 1:2 water model experiments. The detailed information about equipment of water model experiments can be found elsewhere.15) In which the 36% vacuum pump oil combined with 64% kerosene in yellow region on the top of the water model is used to represent the slag film. The Froude (Fr) and Weber (We) criterion are proper for investigations of surface waves and interaction of interfaces, in which the real Froude and Weber numbers are equal to the Froude and Weber numbers of water model, respectively. Figure 2 presents comparisons of the level fluctuation and bubble trajectories between the 1:2 water-model experiment and simulated results under the SEN conditions of IA, DA and immersion depth as 15°, 0° and 150 mm respectively. Then, the immersion depth of SEN and flow rate in the water model experiments are 75 mm and 4.76 m3/h based on the principle of similitude. The argon blowing rates for the results shown in Figs. 2(a) and 2(b) are 10 L/min and 15 L/min, respectively. It can be seen that the simulated steel/slag level fluctuation and argon bubble trajectories are consistent with the experimental results. The thickness of the slag layer around the meniscus is thinner than the area around the SEN. When the argon blowing rate increases from 10 L/min to 15 L/min, the impact depth of the argon bubbles is decreased, most of the bubbles float upward around the SEN, and the degree of bubble dispersal is reduced.

Figure 3 shows the three-dimensional views of the level fluctuations and velocity vectors at the steel/slag interface under different SEN structures with the SEN immersion depth of 150 mm, where IA12°, IA15°, IA20°, and IA25° represent the IA of 12°, 15°, 20°, and 25°, respectively, while DA9° means that DA is equal to 9° with the IA value of 15°. It can be seen from Figs. 3(a)–3(d) that when the IA is equal to 12°, the level fluctuation is large, and the maximum value is observed around the SEN. A sharp corner formed at the meniscus around the wide faces, where the impact depth of the argon bubbles is shallow and most of the bubbles are floating up near the SEN, which will lead to an increase in the upper velocity distributed around the SEN and an enhanced probability of slag entrapment in that vicinity. When IA increases to 15°, the TKE near the SEN is decreased, the sharp corner turns into a trapezoid, and the slag entrapment rate is reduced. When the IA is increased to 20° and then 25°, the level fluctuation is further reduced and is more stable near the SEN, with the sharp corner nearly disappearing for the IA of 20°.
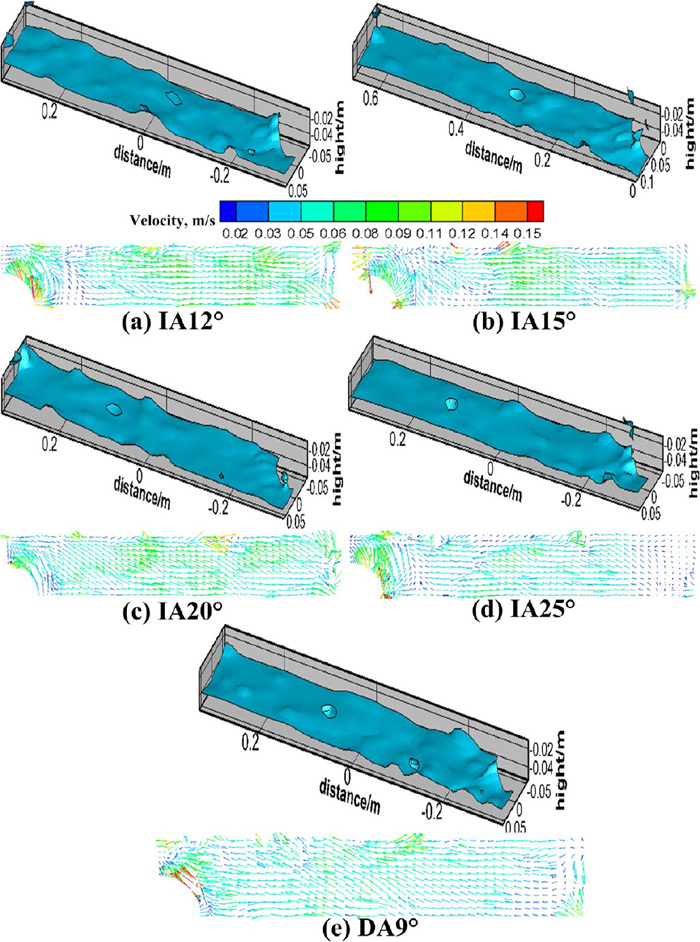
When the IA is 12°, the overall interfacial velocity is relatively high and is chaotically distributed. A small vortex near the SEN and the wide face of the mold is formed with the velocity of 0.1 m/s, while the interfacial velocity is decreased and relatively well-distributed when the IA increases to 15°, and the vortex area shrinks with the velocity of 0.07 m/s. If the IA is increased to 20° and then 25°, the maximum velocity at the interface decreases from 0.15 m/s to 0.13 m/s, and the interfacial velocity is obviously decreased. The interfacial velocity is aggravated near the SEN but is decreased elsewhere, and the thickness of the slag layer near the nozzle decreases when the IA increases from 20° and then to 25°.
Comparison to Fig. 3(a), which presents the results for the DA increased to 9°, shows there is little change in the level fluctuation in the vicinity of the meniscus, while a slight increase in the fluctuation occurs around the SEN, and a significant increase occurs near the SEN at the mold wide faces. As the DA is increased, the washing effects of the injected flow on the wide faces of the mold is enhanced, leading to the higher degree of turbulence in the section parallel to the narrow faces and improvement in the melting of the slag. Meanwhile, the velocity is not well-distributed at the steel/slag interface when the DA is 0°, which will lead to a high level of fluctuations near the SEN and around the middle of the interface. For a DA of 9°, the maximum interfacial velocity is observed in the vicinity of the SEN as well, although it is uniformly distributed elsewhere at the steel/slag interface, which can also promote the uniform melting of the slag.
Figure 4 presents the TKE and argon bubble distributions for different SEN structures, in which the IA value in Fig. 4(e) is 15°. It can be seen from Figs. 4(a)–4(d) that for the IA of 12°, the turbulent energy in the upper recirculation zone of the slab mold is nonuniformly distributed with a relatively higher average value, implying the higher likelihood of turbulent flow in this region, lower stability of the free surface, and a lower floating removal rate of nonmetallic inclusions. When the IA increases to 15°, the turbulent energy in the impact zone is reduced, and the high turbulent energy region moves downward. When the angle increases to 20°, the TKE in the upper recirculation region is obviously decreased, the maximum TKE occurs only at the SEN outlets, and the entire TKE is well-distributed. It can be seen that a small change in the IA can reduce the TKE in the upper recirculation zone to alleviate the fluctuations. When the IA increases to 25°, the TKE near the meniscus is further decreased, and the flow in the upper zone of mold grows more stable, while the turbulence in the deeper part of the mold is aggravated and may reduce the floating removal rate of nonmetallic inclusions. Regarding the behavior of the argon bubbles, the bubbles show similar distributions for the IA values of 12° or 15°, while the impact depth is enhanced and the bubbles in the upper recirculation zone are more uniformly distributed when the IA increases to 20°. Compared to that in Fig. 4(c), the distance that the argon bubbles float up to the free surface is significantly enlarged and the bubbles move to the nozzle due to the effect of the steel flow in the upper recirculation zone and at the free surface; a further increase in the IA to 25° leads to an increase in the bubble amount near the nozzle, which will cause higher level fluctuations. Moreover, the impact depth is large enough to bring the bubbles into the lower recirculation region, which may lead to the capture of the bubbles by the solidification front and cause the bubble defects of the slab.
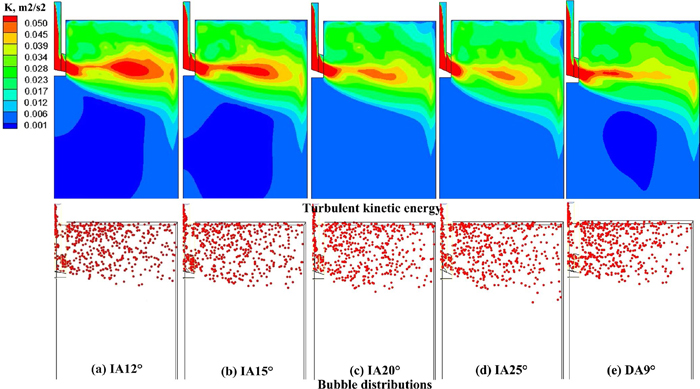
In contrast to Fig. 4(a), for the DA of 9°, the maximum TKE appears inside the SEN and near the SEN outlets, and the TKE in the upper recirculation region is relatively uniform. The TKE in the upper recirculation region is less than 0.028 m2/s2, which is apparently lower than the TKE in Fig. 4(a). Therefore, the DA can improve the flow pattern of molten steel in the upper recirculation zone, reduce the likelihood of turbulence, and contribute to the floating removal rate of nonmetallic inclusions.
It can be seen from the interfacial velocity shown in Figs. 4(a) and 4(e) that compared to those of the SEN with no DA, the impact depth and the floating area of the argon bubbles is smaller when the DA is 9°, the floating trajectory of the argon bubbles moves to the SEN, and the amount of the bubbles near the SEN is significantly greater than elsewhere. The escaping area of the argon bubbles at the free surface slightly decreases but tends to be more uniform overall. Due to the increase in the DA, the area of SEN port outlet increases as well and the velocity of the melt injected to the mold and the impact force of the melt on the argon gas decrease, leading to the decrease of the argon gas floating area and the argon bubbles move toward the SEN.
By comprehensively considering the level fluctuations and bubble behavior in the slab mold for different SEN structures, it is found that the SEN with IA and DA values of 20° and 9°, respectively, can significantly reduce the steel/slag interfacial fluctuations and improve the argon bubble movements, which can reduce the likelihood of slag entrapment and enhance the floating removal rate of nonmetallic inclusions in the slab mold.
3.3. Effect of Immersion Depth
Figure 5 presents the level fluctuations and velocity vectors at the steel/slag interface under different SEN immersion depth, in which the SEN adoption is equal to the case in Fig. 3(b). When the immersion depth is 130 mm below the free surface, the level fluctuation is relatively stable, and the value of fluctuations difference at different positions are small. While the fluctuations near the SEN is stronger than elsewhere as the immersion depth increasing to 150 mm. Then, the range of fluctuations shrinks, the fluctuation near the SEN deteriorates and decreases around the meniscus when the immersion depth increases to 170 mm, which can increase the chance of slag entrapment near the SEN and hinder the uniform distribution of slag melting.
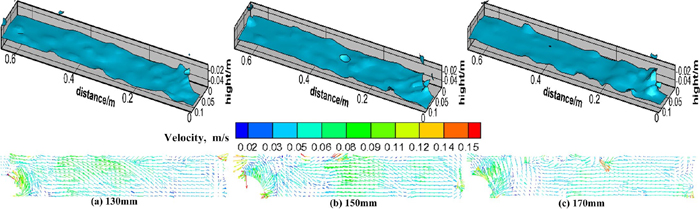
For the velocity at steel/slag interface, the velocity at the middle of interface to the position near the SEN is larger than elsewhere, and is relatively small near the meniscus when the immersion depth is 130 mm. While the velocity at center of steel/slag interface is relatively smaller than elsewhere when the immersion depth increases to 150 mm. The entire interfacial velocity is smaller than the case with SEN immersion depth are 130 mm and 150 mm, when the immersion depth is 170 mm, while is much bigger near the SEN. The distribution of interfacial velocity changes as the increase SEN immersion depth, by which the average velocity at whole interface is decreased, while the area of interface with high velocity is enlarged, leading to the increase of level fluctuation near the SEN.
Figure 6 shows the TKE and argon bubble distributions for different SEN immersion depth. As the increase of SEN immersion depth, the TKE in the impact zone is basically remain unchanged, and shows little change in the area of maximum TKE. When the SEN immersion depth is 130 mm, a small area near the SEN reaches 0.05 m2/s2, while the average TKE is relatively larger than the cases with immersion depth of 150 mm and 170 mm due to the smaller area of upper recirculation zone. When the immersion depth increases to 150 mm, the averaged TKE is obviously decreased. While the TKE in the upper recirculation zone can be apparently weakened, and the TKE is increased near the SEN, which can cause the non-uniform distribution of TKE at the whole steel/slag interface, lead to the huge turbulence near the SEN and aggravate the level fluctuation at the region near the SEN.
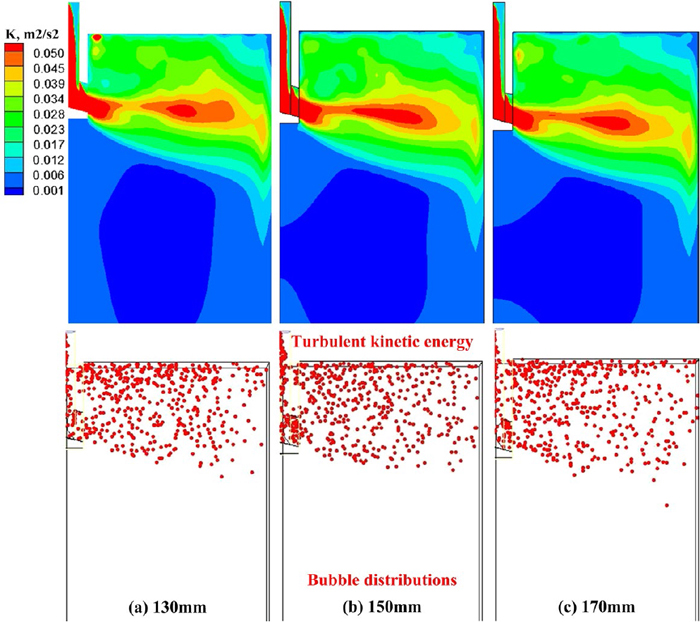
For the distribution of argon bubbles in the slab mold under different SEN immersion depth, compared to the cases with 130 mm and 170 mm’s immersion depth, the escape range of argon bubbles at mold free surface is relatively small. When the SEN immersion depth is 130 mm, the distance of argon bubbles floating from mold to the free surface is short, leading to the least impacting depth of argon bubbles under the same SEN structure, and causing the decrease of floating bubbles near the SEN. When the immersion depth is 170 mm, the impacting depth of argon bubbles is relatively deep and the floating distance of argon bubbles is enlarged. The floating trajectories of argon bubbles are skewed due to the effect of upper recirculation flow of molten steel. Moreover, the hydrostatic pressure of steel is large, and the argon bubbles have a tendency to flow into the lower recirculation zone when the immersion depth is 170 mm, which may cause the bubble defects and deteriorate the quality of continuous casting slab.
According to the results under different SEN immersion depth, the level fluctuation of steel/slag interface is relatively uniform, the averaged TKE is small, and the escape area of argon bubbles at mold free surface is large when the immersion depth is 150 mm, which is beneficial to the floating removal of non-metallic inclusions and reduce the level fluctuation at steel/slag interface.
3.4. Effect of Argon Blowing Rate
Figure 7 shows the level fluctuations and velocity vectors at the steel/slag interface under different argon blowing rates. When the argon blowing rate increases from 10 L/min to 15 L/min, the area of level fluctuations moves to the positions around the SEN, while the level fluctuations around the meniscus decrease, and the amount of fragments above the SEN with the same composition as the steel/slag interface increases, implying that the slag layer fluctuation increases substantially and more steel enters into the slag layer. Moreover, the high level fluctuation occurring at several regions of the slag layer near the wide faces can easily cause slag entrapment. When the blowing rate increases to 20 L/min, half of the steel/slag interface is mild, while the fluctuation reaches its maximum value near the SEN and leads to breaking of the slag layer in that location. Overall, the level fluctuation is enhanced and is nonuniformly distributed with the increase in the argon blowing rate.
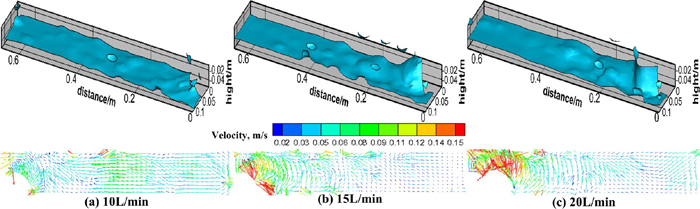
As the argon blowing rate is increased, the variation range of the interfacial velocity is significantly decreased, while the region with the high velocity moves to the SEN and will enhance the nonuniform distribution of the interfacial velocity. When the blowing rate increases from 10 L/min to 15 L/min, the interfacial velocity decreases around the meniscus, even as it increases near the SEN, and a small fraction of the velocity distribution changes from horizontal to upward. When the blowing rate increases to 20 L/min, the interfacial velocities near the SEN are considerably enhanced and point nearly upward, which leads to the significant decrease in the thickness of the slag layer near the SEN and can obviously enhance the probability of slag entrapment.
Figure 8 shows the TKE and bubble distributions in the x-z plane under different argon blowing rates. As the blowing rate is increased, the turbulent energy in the impact zone and around the SEN is significantly enhanced. When the blowing rate increases from 10 L/min to 15 L/min, the high turbulent energy zone throughout the majority of the area of the impact zone increases, and the turbulent energy in the small area of the free surface near the SEN increases to 0.05 m2/s2. When the blowing rate increases to 20 L/min, the turbulent energy near the SEN increases significantly, and the injection impact zone moves upward slightly, leading to the shrinkage of the upper recirculating flow region and deterioration of the nonuniform TKE distribution. As a result, the likelihood of turbulence increases, which hinders the floating of nonmetallic inclusions.

It can be seen from the results of the argon distribution under different blowing rates that when the blowing rate increases from 10 L/min to 15 L/min, the injection depth of the argon bubbles decreased significantly due to the stronger buoyancy effect of the argon bubbles in the mold. The amount of argon bubbles near the SEN increases, while the amount of bubbles decreases in the floating zone of the free surface. When the blowing rate increases to 20 L/min, the bubbles almost begin to float upward around the nozzle outlets, and the dispersion rate of argon bubbles in the slab mold decreases substantially, which can degrade the behavior of the steel/slag interface near the SEN, especially the level fluctuations and the interfacial velocity.
According to the results described above, the argon blowing rate should be as low as possible to obtain a smooth casting. In this case, the blowing rate should be 10 L/min.
4. Application Effects
Based on the simulated and experimental results described above, the conditions of the optimized SEN should be the inclination and DA values of 20° and 9°, respectively, with the argon blowing rate of 10 L/min. The effects of the application of the original and the optimized SENs were investigated in the two-strand slab caster, and the two kinds of SENs were applied in each strand during the casting process. The general casting conditions and SEN parameters in the industrial trials are presented in Table 1. A comparison of hot roll strips in the industrial productions before and after the SEN optimizations is presented in Table 2.
Table 1. General casting conditions and SEN parameters in the industrial trials.
| Parameters | Values |
|---|
| Steel grade | SPHC |
| Steel compositions, wt% | C≤0.12, Si≤0.05, Mn≤0.50,
P≤0.020, S≤0.020, Alt≥0.010 |
| Slab cross section, mm2 | 230×1300 |
| Casting temperature, °C | 1545–1560 |
| Casting speed, m/min | 1.5 |
| Computational length, mm | 1200 |
| Original SEN | IA: 15°, DA: 0° |
| Optimized SEN | IA: 20°, DA: 9° |
| Argon blowing rate, L/min | 10 |
| Internal diameter of SENs, mm | 72 |
| External diameter of SENs, mm | 124 |
Table 2. Comparison of hot roll strips in the industrial productions before and after SEN optimizations.
| Castings | SEN conditions | Strands | No. of strips | Sum of ED occurrence | Rate of ED,/piece |
|---|
| 1st | Optimized | 1st | 31 | 3 | 0.097 |
| Original | 2nd | 32 | 7 | 0.219 |
| 2nd | Optimized | 2nd | 27 | 2 | 0.074 |
| Original | 1st | 27 | 11 | 0.407 |
It can be seen that the rate of ED is significantly reduced after applying the optimized SEN, decreasing from 0.219 and 0.407 per piece of hot roll strip to 0.097 and 0.074 per piece, respectively. The optimized conditions can substantially alleviate slag entrapment during the CC of a 230×1300 mm2 slab of low carbon steel.
5. Conclusions
(1) When the IA increases from 12° to 20°, the level fluctuation and TKE in the upper recirculation zone are decreased. The level fluctuation is slightly alleviated, the interfacial velocity is uniformly distributed, the average TKE in the upper recirculation zone is decreased, and the likelihood of slag entrapment is reduced for the DA of 9°.
(2) The level fluctuation and velocity at steel/slag interface alleviate with the increase of SEN immersion depth, while the amount of argon bubbles near the SEN increases and the level fluctuation aggravates as the large increase of immersion depth.
(3) The level fluctuation deteriorates with the increase in the argon gas blowing rate and can even cause the slag layer to break when the blowing rate is 20 L/min. The argon gas blowing rate should be controlled at a relatively low level for smooth casting.
(4) The rate of ED induced by slag entrapment in the hot roll strip is apparently reduced by applying the casting condition of an IA of 20°, a DA of 9°, and an argon blowing rate of 10 L/min.
Acknowledgment
The authors would like to express their gratitude for the financial support provided by the National Natural Science Foundation of China (51774217) and (51604201), and the Research Project of Hubei Provincial Department of Education (D20171104).
References
- 1) Q. Fang, H. Ni, B. Wang, H. Zhang and F. Ye: Metals, 7 (2017), 72.
- 2) T. Zhang, Z. Luo, H. Zhou, B. Ni and Z. Zou: ISIJ Int., 56 (2016), 116.
- 3) Z. Liu, F. Qi, B. Li and M. Jiang: J. Iron Steel Res. Int., 21 (2014), 1081.
- 4) M. Xu and M. Zhu: ISIJ Int., 55 (2015), 791.
- 5) I. Calderón-Ramos and R. D. Morales: Metall. Mater. Trans. B, 46 (2015), 1314.
- 6) S. Garcia-Hernandez, R. D. Morales, J. D. J. Barreto and K. Morales-Higa: ISIJ Int., 53 (2013), 1794.
- 7) I. Calderón-Ramos, R. D. Morales and M. Salazar-Campoy: Steel Res. Int., 86 (2015), 1610.
- 8) K. Jin, B. G. Thomas and X. Ruan: Metall. Mater. Trans. B, 47 (2016), 548.
- 9) C. Liu, Z. Luo, T. Zhang, D. Shen, W. Nan and Z. Zou: J. Iron Steel Res. Int., 21 (2014), 403.
- 10) P. S. Srinivas, A. Singh, J. M. Korath and A. K. Jana: ISIJ Int., 57 (2017), 1553.
- 11) T. Zhang, Z. Luo, H. Zhou, B. Ni and Z. Zou: ISIJ Int., 56 (2016), 116.
- 12) Q. Fang, H. Ni, H. Zhang, B. Wang, X. Song and C. Liu: JOM, 70 (2018), 719.
- 13) W. P. Jones and B. E. Launder: Int. J. Heat Mass Transf., 16 (1973), 1119.
- 14) C. R. Ismael, B. J. D. Jesus and G. H. Saul: ISIJ Int., 53 (2013), 802.
- 15) B. Li and F. Tsukihashi: ISIJ Int., 45 (2005), 30.