Abstract
Fatigue crack initiation and propagation behavior of a water-quenched fully ferritic nitrogen steel were investigated by means of tension-compression fatigue tests. The Fe–0.011 mass% N steel showed no serrated flow associated with dynamic strain aging, and showed a fatigue limit of 150 MPa alongside a non-propagating fatigue crack. The major mode of crack initiation was at the grain boundaries, and the cracks propagated along the grain boundaries and interiors at and above the fatigue limit. The Fe–N steel did not exhibit a significant level of coaxing effect. The results were compared with our previous findings in Fe–0.006 and 0.017C steels, and the similarity and difference were discussed.
1. Introduction
Interstitial solute atoms play crucial roles in both the deterioration and improvement of fatigue resistance in steels. For instance, hydrogen has been shown to worsen fatigue crack resistance because of localized plasticity at the crack tip.1) In contrast, interstitial carbon enhanced transgranular fatigue crack resistance and improved the fatigue limit of steels.2,3) The dramatic effects of interstitial atoms in steels are believed to be a key for enabling safe mechanical design and the development of next-generation fatigue-resistant materials.
From the viewpoint of the carbon effect, the kinetic effect is important for understanding the underlying mechanism of fatigue resistance improvement, i.e., dynamic strain-age (DSA) hardening. In this context, nitrogen is expected to be another candidate as a solute element improving fatigue resistance because nitrogen is an interstitial element that shows significant potential to cause strain aging in steels.4) However, in comparison with the carbon effect, the solute nitrogen effect has not been examined well in terms of fatigue crack resistance. Therefore, we were interested in investigating the nitrogen effect on fatigue crack behavior in a simple compositional steel, i.e., an Fe–N binary fully ferritic steel.
To be specific, we note that fatigue damage evolution is divided into two parts: fatigue crack initiation and propagation. Fatigue crack propagation is further divided into small and long crack regions. Commonly, the term “small crack” in fatigue phenomena is understood from different viewpoints, such as microstructurally small cracks,5) mechanically small cracks,6) physically small cracks,7) and chemically small cracks.8) According to the previous studies,2,3) the kinetic effect of solute atoms effectively contributes to the regimes of fatigue crack initiation and mechanically or microstructurally small crack growth. In this study, we therefore focused on the fatigue damage evolution from crack initiation to mechanically or microstructurally small crack growth that covers 70% of fatigue life in steels.9)
In our previous studies2,3,10,11) regarding Fe–C binary steels with supersaturated solute carbon, we clarified certain points in terms of fatigue crack initiation and small crack growth behavior. Therefore, we can interpret the fatigue behavior of an Fe–N alloy by comparison with that of the Fe–C alloys. Our findings in the Fe–C alloys were as follows:
(1) The presence of solute carbon causes DSA hardening, resulting in fatigue crack non-propagation.3,10,11)
(2) The failure mechanism in smooth specimens is intergranular crack initiation and subsequent propagation along grain boundaries; this is perhaps due to the presence of solute poor zones near grain boundaries.3,11)
(3) Crack coalescence was frequently observed at stress amplitudes higher than the fatigue limit, which can decrease fatigue life and strength.2,3)
(4) When the carbon content was increased from 0.006 to 0.017 mass%, the Fe–C alloy displayed a high level of coaxing effect due to suppression of intergranular fatigue crack initiation and propagation by strain age hardening at the crack tip.2)
Hence, this study was performed on a single-ferrite-phase Fe–N binary steel, to clarify the underlying effects of solute nitrogen on the fatigue properties and its correlation to small fatigue crack growth. We compared the nitrogen effects with those of the solute carbon in an Fe–C binary system.
2. Experimental Procedure
2.1. Material and Tensile Testing
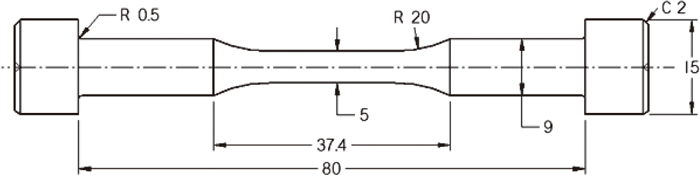
In this study, for simplicity, we prepared a binary Fe–N ferritic steel that did not contain a cementite or pearlite phase. The chemical composition of the steel is given in Table 1. The specimens were solution treated at 700°C for 3.6 ks and subsequently water quenched to suppress cementite formation and nitrogen segregation at the grain boundaries. The specimens were preserved in a refrigeration unit at −87°C except during sample preparation. The tensile tests were conducted on three identical pieces with specimen gauge length of 30 mm, width of 4 mm, and thickness of 1 mm at initial strain rates of 10−3 s−1, 10−4 s−1, and 10−5 s−1. The fatigue test specimens were cut on a lathe machine, as shown in Fig. 1. The specimens were mechanically polished and subsequently etched with a mixture of 3% nitric acid and 97% ethanol (vol%).
Table 1. Chemical compositions of materials used in this study (mass%).
| Steel | N% | C% | Si% | Mn% | P% | S% | Ni% | Ti% | Al% | O* |
|---|
| Fe–0.0113N | 0.0113 | 0.0011 | <0.003 | <0.003 | <0.002 | <0.0003 | <0.003 | <0.002 | <0.002 | 29 |
| Fe–0.017C [2] | 0.0009 | 0.017 | <0.003 | <0.003 | <0.002 | <0.0003 | <0.003 | <0.002 | 0.052 | 15 |
| Fe–0.0063C [2] | 0.0007 | 0.0063 | 0.005 | <0.004 | 0.0003 | 0.0011 | – | – | 0.048 | <10 |
| IF steel [2] | 0.0008 | 0.0019 | 0.009 | <0.003 | <0.002 | <0.0003 | – | 0.029 | 0.028 | 15 |
Tension–compression fatigue tests were performed at room temperature (RT) at a frequency of 30 Hz. The stress ratio (R) was −1, and a sinusoidal waveform was employed. The fatigue limit was assumed to be the highest stress amplitude at which the specimen did not fracture at 1 × 10⁷ cycles. The coaxing effect was also studied for the Fe–0.011N steel. The fatigue test was stopped when the specimen reached the fatigue limit of 107 cycles, and then the stress amplitude was increased by 5 MPa after a constant number of 107 cycles, to examine the degree of coaxing effect. Normally, through the coaxing effect, the fatigue strength is increased by prior cyclic deformation at a lower stress level. The coaxing effect has been effectively studied by some researchers,12,13) and was observed in materials where strain-age hardening occurs.14) The replica technique was used to observe the fatigue cracks with the help of an optical microscope. The replica was immersed in methyl acetate before being placed on the specimen surface. The fracture surfaces were observed with a scanning electron microscope (SEM) at an accelerating voltage of 15 kV.
3. Results
3.1. Initial Microstructure and Tensile Properties, and Observation of Serrated Flow
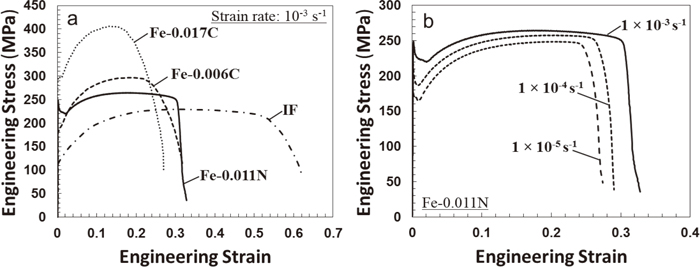
Figure 2 shows the initial microstructure of the Fe–0.011N steel, consisting of a single ferrite phase. The average grain size was measured to be 180 μm. With this initial microstructure, the engineering stress-strain (SS) curve of the Fe–0.011N steel was obtained at an initial strain rate of 10−4 s−1 as shown in Fig. 3(a). For comparison with the effect of carbon, SS curves of the Fe–0.017C, Fe–0.006C, and IF steels were also plotted from our previous paper.11) The 0.2% proof stress, tensile strength, and elongation are listed in Table 2. Figure 3(b) shows the SS curves of the Fe–0.011N steel obtained at different strain rates. Here, the important difference from the carbon steels is that serrations did not appear in the SS curves at any strain rate. Therefore, it is evident that solute nitrogen does not cause DSA hardening in the binary ferritic steel at RT, unlike Fe–C steels.
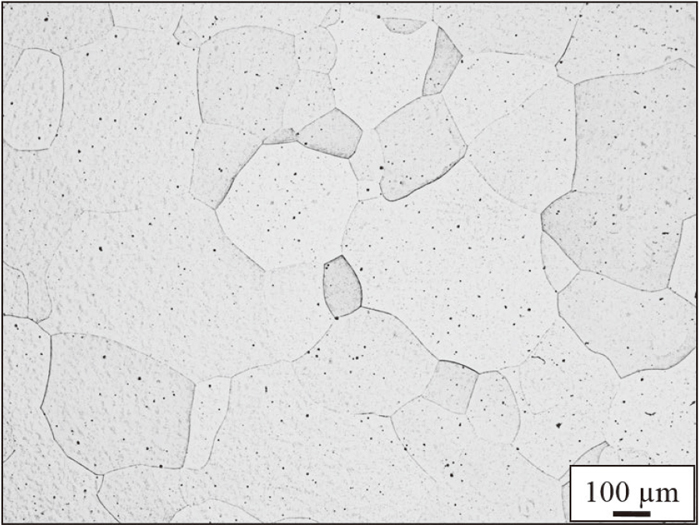
Table 2. The 0.2% proof strength, tensile strength, elongation, and Vickers hardness values of the Fe–0.011N, Fe–0.017C, Fe–0.006C, and IF steels. The unit of the Vickers hardness values was converted from kgf/mm
2 to MPa to obtain non-dimensional values in
Fig. 4(b).
| Steel | 0.2% Proof Stress (MPa) | Tensile Strength (MPa) | Elongation (%) | Vickers hardness (MPa) |
|---|
| Fe–0.011N | 220 | 265 | 29 | 941 |
| Fe–0.017C11) | 300 | 400 | 31 | 1235 |
| Fe–0.006C11) | 185 | 300 | 28 | 823 |
| IF steel11) | 115 | 235 | 62 | 598 |
Figure 4(a) shows the diagram of stress amplitude–number of cycles to failure (SN) for the Fe–0.011N steel. For comparison, results of the Fe–0.017C, Fe–0.006C, and IF steels are also plotted from our previous paper.2) The fatigue limit of the nitrogen steel was shown as 150 MPa. Normally, the differences in fatigue limit and life are derived from the tensile strength or hardness. Since tensile strength of steels with DSA hardening show significant strain rate dependence, we selected Vickers hardness to normalize fatigue strength. Accordingly, the number of cycles to failure was plotted against the stress amplitude normalized by the Vickers hardness (MPa), as shown in Fig. 4(b). It is clear that the fatigue limit of the Fe–0.011N steel is lower than that of the Fe–0.017C, Fe–0.006C and IF steels. The stepwise lines indicate the results of the coaxing effects test after 107 cycles. The Fe–0.011N steel did not show a significant coaxing effect like the Fe–0.017C, and it was similar to the Fe–0.006C steel and higher than the IF steel.

Figure 5 shows the replica images of the Fe–0.011N steel at the fatigue limit (150 MPa). A fatigue crack initiated at the grain boundary (Fig. 5(b)) and propagated to the grain interior in both the upward and downward grains (Fig. 5(c)). A sub-crack also initiated along the grain boundary indicated by a blue arrow in the inset of Fig. 5(c), and it propagated as shown in Fig. 5(d). The sub-crack coalesced with the main crack, as shown in Fig. 5(e), but the crack subsequently stopped propagating between 7 × 10⁶ and 1 × 10⁷ cycles, as shown in Figs. 5(e)–5(f). Hence, non-propagating fatigue crack occurred at the fatigue limit, which is similar to the behavior of Fe–C steels.3)

Figures 6(a)–6(b) show the replica images of Fe–0.011N steel with intergranular fatigue crack initiation at a stress amplitude of 220 MPa (70 MPa higher than the fatigue limit). Two cracks initiated at the grain boundary at 3 × 10⁴ cycles, as shown by the red and blue arrows in Fig. 6(a). The cracks then propagated predominantly along the grain boundary during cyclic loading until 6 × 10⁴ cycles, as shown by the blue arrow in Fig. 6(b). Another region also showed intergranular crack initiation and propagation as shown by the red arrow in Fig. 7(a), and the intergranular crack propagated along the grain boundary when the crack length is short, but also propagated into the grain interior when the crack length increased, as shown in Figs. 7(b)–7(d). Here, slip lines were formed at the vicinity of the intergranular fatigue crack, as shown in the inset of Fig. 7(b). It is also noteworthy that crack propagation accelerated due to crack coalescence, as indicated in Fig. 7(d).
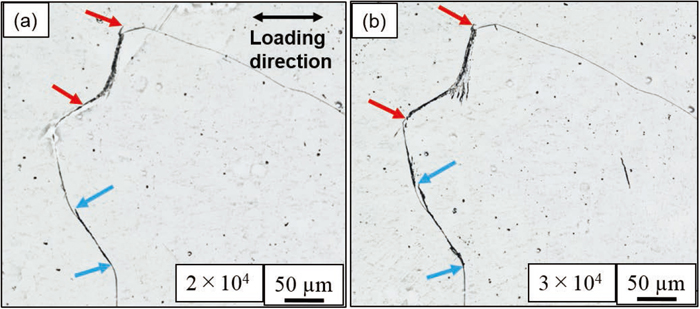
Figure 8 shows the SEM fractographs of the Fe–0.011N steel tested at 220 MPa. Figures 8(a)–8(b) show an overview of the fracture surface. Figure 8(c) shows the crack initiation site from the top surface; an intergranular fracture surface was observed. Striation-like features were observed near the center of the fracture surface, as shown in Fig. 8(d). The appearance of intergranular feature and striation-like patterns was also observed in Fe–0.017C steel.3)
4. Discussion: Nitrogen Effects on Fatigue and Comparison with Carbon
We comparatively present the fatigue-related behaviors of Fe–C and Fe–N steels in Table 3. We will discuss the reasons for the similarity and difference between the carbon and nitrogen.
Table 3. Similarity and difference in fatigue-related behaviors between the Fe–0.017C and Fe–0.011N steels.
| Behavior | Carbon steel | Nitrogen steel |
|---|
| DSA at RT | Yes11,15) | No |
| Coaxing effect | High2,3) | Low |
| Preferential intergranular crack initiation | Yes3) | Yes |
| Crack coalescence at fatigue limit | No2) | Yes |
| Crack coalescence at high stress amplitudes | Yes2) | Yes |
| Crack non-propagation at grain interior | Yes2,11) | Yes |
First note that fatigue crack initiation occurred at the grain boundaries in the Fe–0.011N steel at the fatigue limit and the high stress amplitude as shown in Fig. 6(a). The fractograph shown in Fig. 8(c) supports the occurrence of the intergranular crack initiation. It has been reported that the Fe–0.017C steel also shows a similar phenomenon.3) In general, grain boundaries can be a preferential fatigue crack initiation site because of the strain incompatibility, dislocation accumulation, and associated surface reliefs.16) Moreover, in the Fe–0.017C steel, the localization of strain at grain boundaries can be enhanced perhaps due to the presence of a solute poor zone,11,17) which assists the intergranular crack initiation. In this context, the fact that the Fe–0.011N steel also showed the similar intergranular fatigue crack initiation (Figs. 5(b), 5(c) and 6(a)) implies the likely existence of plastic strain localization near the grain boundaries where solute-poor zone may exist. Conclusively, neither solute carbon nor nitrogen has a significant suppression effect on the preferential occurrence of intergranular fatigue crack initiation in water-quenched steels during the cyclic loading up to 107 cycles with the frequency of 30 Hz. In other words, solute carbon and nitrogen can increase average tensile and fatigue strengths as shown in Figs. 3(a) and 4(a) but does not change the relative fatigue strength near grain boundaries as compared to the strength of the grain interior.
4.2. Fatigue Crack Propagation and Non-propagation
From the viewpoint of crack propagation, the crack propagation path was observed to depend on the crack length. When the crack length is short, as the number of cycles increased, the crack propagated along the grain boundaries as shown in Fig. 7(a). Since slip lines were observed near the intergranular cracks in Fig. 7(b), the intergranular short crack propagation occurs via repetition of slip localization and crack growth near the grain boundaries. Subsequently, the transgranular crack propagation occurred as shown in Figs. 7(b) and 7(c). Since striation-like patterns were observed in Fig. 8(d), the transgranular crack propagation is attributed to crack blunting and the re-sharpening mechanism.18,19) In fact, these propagation behaviors are same as those of the Fe–0.017C steels.3) The ease of the intergranular short crack propagation in the Fe–C steel was reported as the reason why the fatigue limit normalized by hardness cannot be improved with the introduction of solute carbon.3,10,11) Correspondingly, the fatigue limit normalized by hardness in the Fe–N steel is lower than that of the other steels shown in Fig. 4(b).
Since both of the Fe–0.017C and Fe–0.011N steels showed fatigue crack non-propagation at the fatigue limit (as indicated in Figs. 5(e) and 5(f) and supported by previous research3)), the fatigue limits are controlled by fatigue crack non-propagation limits. To understand the difference in fatigue limit normalized by hardness, we must discuss differences in fatigue crack propagation. Here, we can present two significant factors affecting the fatigue crack non-propagation behavior. The first is being that the Fe–N steel did not show DSA hardening, unlike the Fe–C steel, as shown in Fig. 3. This is perhaps because of the low diffusivity of nitrogen at RT in the Fe–0.011N steel. For instance, Baird et al.20) determined an activation energy of 63–84 kJ mol−1 for the onset of serrations in Fe–N steel, and strain aging occurred at temperatures above 373 K. Since DSA-driven hardening at a crack tip is a key factor causing fatigue crack non-propagation, no DSA hardening at RT in the Fe–0.011N steel can be a definitive reason for the lower fatigue limit normalized by hardness compared with that of the Fe–0.017C steel. Another difference between Fe–N and Fe–C binary alloy systems is the probability of crack coalescence. Crack coalescence was observed in the Fe–0.017C steel at high stress amplitudes, but not at the fatigue limit.3) The Fe–0.011N steel, however, showed the crack coalescence even at the fatigue limit (Fig. 5(e)). More specifically, fatigue cracks in the Fe–0.011N steel tend to initiate near propagating crack tips as shown in Figs. 5(c) and 6(a), although the reason for the preferential crack initiation near the crack tip is unclear. Therefore, the ease of the crack coalescence in the Fe–0.011N steel can be the second factor responsible for decreasing the fatigue limit.
4.3. Coaxing Effect
The Fe–0.011N steel did not show high levels of the coaxing effect and fractured at the third incremental stage of stress amplitude (Fig. 4(a)). In contrast, the Fe–0.017C steel showed a high level of coaxing effect: nine increments were required for fracture (Fig. 4(a)). It has been reported that the superior coaxing effect is attributed to strain-age hardening14) that suppresses both the intergranular fatigue crack initiation and propagation during the coaxing test of the Fe–0.017C steel.2) The aging time corresponding to over 107 cycles enables dislocation pinning by carbon, increasing resistance to fatigue crack initiation and propagation. In this context, this difference in the degree of coaxing effect between carbon and nitrogen can be also interpreted by the DSA-driven hardenability of carbon and nitrogen. That is, nitrogen does not cause DSA hardening at RT; accordingly, the Fe–0.011N steel could not show a significant coaxing effect unlike the Fe–0.017C steel. In addition, the ease of intergranular crack initiation and subsequent coalescence discussed in the previous section may also be another factor diminishing the degree of coaxing effect.
5. Conclusions
In this study, the effect of solute nitrogen on the fatigue crack initiation and small fatigue crack propagation was studied in a water-quenched Fe–0.011 mass%N single-phase ferritic steel, and the results were compared with those from our previous studies on Fe–C steels.2,3) The following conclusions are derived from the results:
(1) Fatigue limit normalized by hardness of the Fe–0.011N steel was lower than those of Fe–0.006C and Fe–0.017C steels.
(2) Intergranular fatigue crack initiation and propagation were commonly observed in the Fe–C and Fe–N steels.
(3) Both fatigue limits of the Fe–C and Fe–N steels were controlled by fatigue crack non-propagation limit.
(4) The Fe–0.0011N steel did not show DSA hardening at RT unlike the Fe–C steels, which can decrease the fatigue crack non-propagation limit and associated fatigue limit compared with the Fe–C steels.
(5) Since DSA hardening did not occur in the Fe–N steel, coaxing effect did not appear significantly unlike the Fe–C steels.
Acknowledgment
This work was financially supported by JSPS KAKENHI (JP16H06365).
References
- 1) Y. Murakami and S. Matsuoka: Eng. Fract. Mech., 77 (2010), 1926.
- 2) M. Koyama, B. Ren, N. Yoshimura, E. Sakurada, K. Ushioda and H. Noguchi: ISIJ Int., 57 (2017), 358.
- 3) M. Koyama, Z.-J. Xi, Y. Yoshida, N. Yoshimura, K. Ushioda and H. Noguchi: ISIJ Int., 55 (2015), 2463.
- 4) D. W. Kim, W.-S. Ryu, J. H. Hong and S.-K. Choi: J. Mater. Sci., 33 (1998), 675.
- 5) K. Tokaji, T. Ogawa, Y. Harada and Z. Ando: Fatigue Fract. Eng. Mater. Struct., 9 (1986), 1.
- 6) R. Ritchie and J. Lankford: Mater. Sci. Eng., 84 (1986), 11.
- 7) K. Tanaka, Y. Nakai and M. Yamashita: Int. J. Fract., 17 (1981), 519.
- 8) R. Gangloff: Metall. Trans. A, 16 (1985), 953.
- 9) N. Hironobu, G. Masahiro and K. Norio: Eng. Fract. Mech., 41 (1992), 499.
- 10) B. Li, M. Koyama, E. Sakurada, N. Yoshimura, K. Ushioda and H. Noguchi: Int. J. Fatigue, 87 (2016), 1.
- 11) B. Li, M. Koyama, E. Sakurada, N. Yoshimura, K. Ushioda and H. Noguchi: Int. J. Fatigue, 98 (2017), 101.
- 12) J. Bennett: J. Res. Natel. Bur. Stand., 37 (1946), 133.
- 13) J. B. Kommers: Proc. ASTM, 38 (1938), 249.
- 14) G. M. Sinclair: Proc. ASTM, 52 (1952), 743.
- 15) N. Yoshimura, K. Ushioda, M. Yonemura, M. Koyama, M. Tanaka and H. Noguchi: Mater. Sci. Eng. A, 701 (2017), 120.
- 16) K. Tanaka and T. Mura: J. Appl. Mech., 48 (1981), 97.
- 17) N. Yoshimura, K. Ushioda, Y. Yoshida, E. Sakurada, M. Yonemura, M. Koyama, H. Noguchi and C. Watanabe: Mater. Sci. Eng. A, 732 (2018), 212, http://doi.org/10.1016/j.msea.2018.06.082.
- 18) C. Laird and G. Smith: Philos. Mag., 7 (1962), 847.
- 19) C. Laird and R. de La Veaux: Metall. Trans. A, 8 (1977), 657.
- 20) J. Baird and A. Jamieson: J. Iron Steel Inst., 204 (1966), 793.