Casting and Solidification
Solidification Behavior of Ti-6Al-4V Alloy
2020 年 60 巻 11 号 p. 2455-2461
詳細
2020 年 60 巻 11 号 p. 2455-2461
It is important to understand the solidification behavior of titanium alloys for optimizing the casting conditions. In this study, to evaluate the solidification behavior of the Ti-6Al-4V alloy, an experiment was conducted using a lab-scale electron beam furnace. After melting the surface layer of the ingot through electron beam heating, the surface layer was allowed to solidify. Based on the measurement results of the cooling curve of the surface of the ingots, it was observed that the solid was subject to undercooling during its formation. The cooling rate of the ingot could be predicted through numerical simulation, for the melting and solidification of the ingot. The primary and the secondary dendrite arm spacing were examined with respect to the cooling rate. The concentrations of Al and V in the dendritic region were analyzed using electron probe microanalysis (EPMA). It is clarified that the Al is segregated into the dendrite core during solidification, and that V is segregated into the interdendritic region.
It is necessary to avoid the ripple mark on the surface and the internal freckle segregation1) of titanium alloy ingots and castings. Therefore, it is important to understand the solidification behavior of titanium alloys for optimizing the thermal conditions in both ingots and castings.2,3,4,5) Experimental techniques such as unidirectional solidification are difficult to perform in Ti-base alloys, because both the high melting temperatures of the alloys and their extreme reactivity with refractory materials. Moreover, the solidification microstructure of the titanium alloy ingots is difficult to observe metallographically due to the transformation behavior, and accordingly, there are few studies on the analysis of the solidification behavior. Nurminen et al.6) prepared several binary titanium alloy ingots with different local solidification times and the secondary dendrite arm spacing was determined with respect to the type as well as concentration of the solute elements. The results indicated that the secondary dendrite arm spacing decreased with the increase in cooling rate, when the solute content of the ingot was fixed. When the cooling rate was fixed, the secondary arm spacing decreased with the increase in the concentration of the solute element. Moreover, it was clarified that the relationship between the secondary dendrite arm spacing and local solidification time varied with the solute content of the ingot. The relationships determined in this work show a strong similarity to those observed in other systems, for example in steels and indicate that the solidification behavior of titanium alloys should follow conventionally-established rules.
The relationship between the size of the β grain and the cooling rate during the solidification of Ti-6Al-4V alloy, (the most generally-used titanium alloy) has been studied.7,8) However, the relationship between the dendrite arm spacing and cooling rate has not been previously investigated and reported.
In this study, the relationship between the dendrite arm spacing and cooling rate during the solidification of Ti-6Al-4V alloy is examined using a lab-scale electron beam melting furnace. Further, the segregation behavior of this alloy during solidification has been examined using electron probe microanalysis (EPMA) on the solid structure.
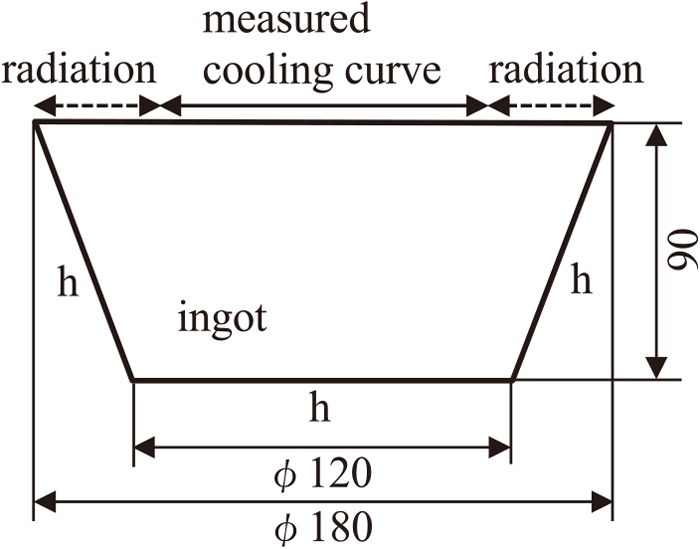
Figure 1 shows the schematic diagram of the experimental apparatus used for measuring the cooling curve of the ingot surface. The experimental apparatus comprises a vacuum vessel, electron beam generator, water cooled copper mold, and a two-color optical pyrometer. The surface temperature of the ingot was measured using the two-color optical pyrometer, located outside the vacuum vessel focusing through a window. A 5 kg ingot was premelted from a block of Ti-4Al-4V alloy (Ti-6.4 mass%Al-4.2 mass%V-0.18 mass%Fe-0.18 mass%O). The ingot was melted into to the cavity of the water-cooled copper mold whose temperature was constant, then the heat transfer condition from the ingot to the mold was retained constant. The shape of the ingot was a truncated cone with an upper diameter of 1.8 × 10⁻¹ m, lower diameter of 1.2 × 10⁻¹ m, and height of 9.0 × 10⁻² m.
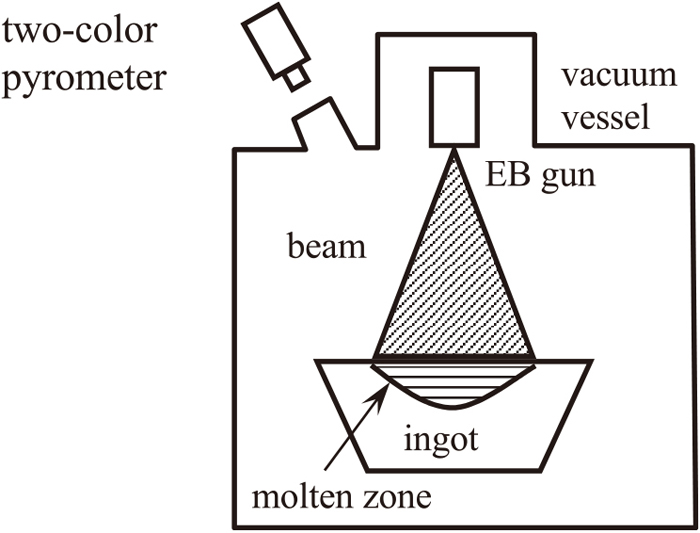
Experimental apparatus for melting and solidification of the surface of Ti-6Al-4V alloy ingot using electron beam.
An electron beam with a maximum power of 20 kW was irradiated on to the surface of the ingot, preheating to 1273 K for 60 s. The temperature of the liquid top surface of the ingot was then adjusted to 2273 K for 60–480 s by controlling the power of the electron beam. Considerable time was required to increase the temperature of ingot, because its bottom and side surfaces were in good contact with the water cooled copper mold. To suppress the evaporation loss of Al from the molten metal and expand the molten region from the surface to within the inside of the ingot, a suitable temperature increase pattern was adopted.
After melting the upper region of the ingot for a prescribed time, the electron beam was discontinued and the system cooled through radiation cooling as well as through heat transfer to the mold. The temperature of the central region of the upper surface of the ingot was measured during solidification using the optical pyrometer.
After the experiment, the ingot was cut longitudinally at the center position of the upper surface, and the solidification microstructure of this section was studied. In order to predict the temperature changes in the ingot, the melting and solidification of the ingot were numerically simulated considering the measurement results of the cooling curve at the upper surface as the boundary condition.
To calibrate the values of the two-color optical pyrometer,9) the temperature of the alloy melt was also measured using a thermocouple (W-5 mass%Re/W-26 mass%Re) with a diameter of 5.0 × 10⁻³ m.
In this study, the temperature of the upper surface of the ingot was measured. To predict the solidification behavior of the molten region of the ingot, it is necessary to evaluate the temperature changes within the ingot. Therefore, a three-dimensional unsteady state numerical simulation of the melting and solidification of the ingot was performed taking into account the measurement results of the cooling curve.
Figure 2 shows the analytical model of the numerical simulation. The upper surface region of the ingot irradiated by the electron beam was related to the measured cooling curve. The other regions of the upper surface of the ingot were assumed to be cooled by radiation heat transfer. The values of the interfacial heat transfer coefficients on the bottom and side faces of the ingot which were in contact with the mold surface were predicted according to the boundary line observed in the microstructure of the longitudinal cross section of the ingot which corresponded to the calculated liquidus line.
Calculation model for melting and solidification of ingot.
Numerical simulation was conducted using an Eq. (1) that was considered with the term of latent heat of fusion.10) Fraction of solid11) was assumed to change in proportion to the temperature difference between liquidus and solidus temperature.
| (1) |
| (2) |
| parameter | value | ref. |
|---|---|---|
| liquid temperature (K) | 1978 | 22) |
| solidus temperature (K) | 1923 | 22) |
| β/α transformation temperature (K) | 1209 | 22) |
| thermal conductivity (Wm−1K−1) | 27 | 23) |
| specific heat (Jkg−3K−1) | 7.5×10² | 23) |
| density (kgm−3) | 4.2×10³ | 23) |
| latent heat (Jm−3) | 2.9×10⁵ | 23) |
| heat transfer coefficient (Wm−2K−1) | 4.2×10³ | – |
| temperature of mold (K) | 323 | – |
Figure 3(a) shows the microstructure of the longitudinal cross section at the center of the upper face of the ingot. The microstructure was etched using 5 vol% nitric/hydrofluoric acid solution. The microstructure of the cross section of the ingot was divided by the boundaries of two semicircles. The inner side of the upper semicircle of the ingot was the solidified region after remelting. The region between the upper and lower semicircles corresponded to the heat affected zone.

Solidification microstructures of ingot of which surface region was melted for 60 s. (a) longitudinal cross section of ingot, (b) etching with hydrofluoric acid and (c) EPMA mapping. (Online version in color.)
Figure 4(a) shows the changes in the surface temperature of the ingot when the irradiation time of the electron beam was 60 s, after the surface temperature of the ingot reached 2273 K. In this figure, the equilibrium liquidus temperature and solidus temperature are indicated. When the electron beam was turned off, the surface temperature of the ingot decreased linearly with time. The cooling rate was 60 Ks−1, predicted from the gradient of the cooling curve as it passed through the liquidus temperature. The cooling rate decreased between the liquidus and solidus temperatures, because of latent heat generation during solidification, after which the surface temperature decreased again, following the normal pattern for alloy cooling.
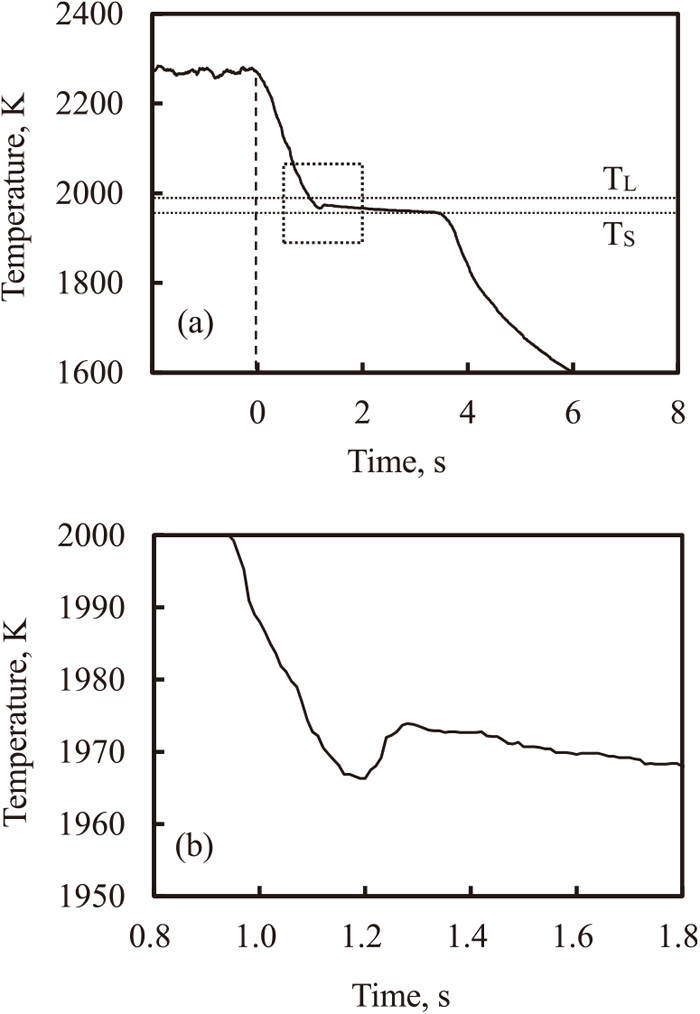
Measured cooling curve during solidification of the surface of the ingot of which surface region was melted for 60 s. Square in (a) is magnified in (b).
Figure 4(b) shows the magnified view of the square in Fig. 4(a), near the liquidus temperature. The surface temperature showed a minimum value below the liquidus temperature and then increased to reach a maximum value, after which it decreased again. The undercooling phenomenon has been observed in case of carbon steels and stainless steels.11) Here it was clarified that undercooling can also occur in the solidification of Ti-6Al-4V alloy.
4.3. Temperature Changes in the IngotFigures 5(a)–5(c) show the calculated results of the liquidus temperature in the longitudinal cross section of the ingot.
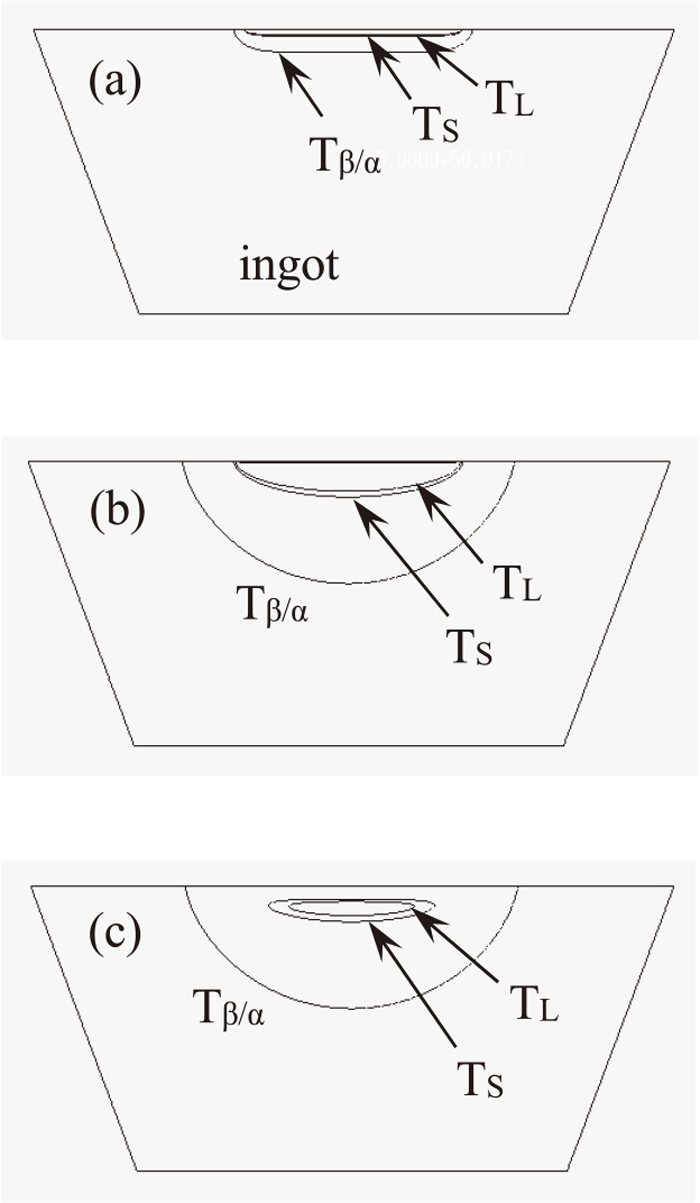
Calculated results of the isothermal line of the liquidus temperature during melting and solidification. TL is liquidus, TS is solidus and Tβ/α is β/α transformation temperature. (a) just after melting, (b) just after solidification and (c) before complete solidification.
Figure 5(a) shows the isothermal line of the liquidus temperature reaching 2273 K of the surface temperature of the ingot after 5 s. The molten region, above the liquidus temperature, was formed below the surface of the ingot.
Figure 5(b) shows the isothermal line of the liquidus temperature at the start of cooling, when the electron beam was turned off. This isothermal line corresponds to the boundary of the upper semicircle shown in Fig. 3(a). The molten region is cooled by radiation from the upper face of the ingot and by heat transfer from the bottom and side faces of the ingot to the water-cooled copper mold, subsequently the isothermal line of the liquidus temperature forms a closed loop within the ingot as shown in Fig. 5(c).
Figure 6 shows the relationship between the calculated temperature and the time when the distance from the surface is within 2.0 × 10⁻² m in the longitudinal section of the ingot. At 0 m from the surface, the temperature corresponds to the measured cooling curve. The temperature increases from the surface side in order when the surface of the ingot is heated by the electron beam. At 1.5 × 10⁻² m from the surface of ingot, the temperature does not increase to the solidus temperature within the prescribed time, and melting does not occur.

Calculated cooling curve at several position in the ingot of which surface region was melted for 60 s.
When the electron beam was turned off, the temperatures decreased progressively from the surface to within the region which was dominantly influenced by radiation cooling. In this study, the ingots were not all completely melted. Therefore, it appears that significant heat conduction occurred from the melted to unmelted region in the ingot, in addition to heat loss by radiation from the surface of the ingot.
To examine the relationship between the solidification microstructure and cooling rate, it is necessary to predict the temperature changes in the ingot. Hence, the cooling rate at the longitudinal cross section of the ingot was obtained through numerical simulation.
Figure 7 shows the relationship between the cooling rate and distance from the surface of the ingot. Here, the cooling rate was the value at which the cooling curve passed the liquidus temperature at each position in the ingot. The cooling rate decreases monotonically with the increase in distance from the surface.
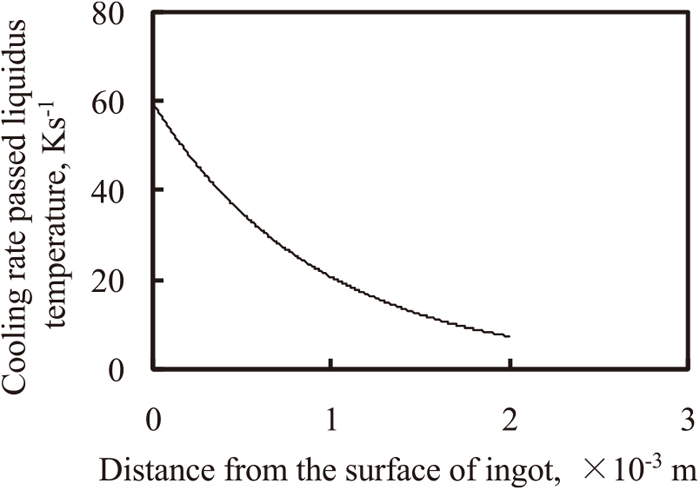
Calculated cooling rate in the ingot at the time passed liquidus temperature.
When Ti-6Al-4V alloy is melted, Al evaporates from the melt.13,14) Evaporation loss of Al was of concern in this study because the upper region of the ingot was melted for a significant period. Therefore, to evaluate the concentration of the melted region in the ingot, samples were obtained within 2.5 × 10⁻³ - 2.25 × 10⁻² m from the surface of the ingot, and the concentrations of Al and V were measured using an inductivity coupled plasma (ICP) emission spectrophotometer.
Figure 8 shows the relationship between the concentrations of Al and V, and the distance from the surface of the ingot for a melting time of 60 s; the standard ranges of Al and V for Ti-6Al-4V alloy was shown. The melted region below the surface of the ingot was determined by observing the solidification microstructure. Although the concentration of Al after melting was lower than that before melting, it was almost constant in the melted region. On the other hand, the concentrations of V in the melted and ummelted regions were almost the same value. The concentration of Al in the melted region decreased because of the high vapor pressure of Al and its evaporation rate from the molten alloy.

Measurement result of concentration in the ingot of which surface region was melted for 60 s.
Figure 9 shows the relationship between the concentrations of Al and V, and the melting time at 2.5 × 10⁻³ m from the surface of the ingot. The longer the melting time, the lower is the concentration of Al. The concentration of V does not change, even when the melting time is varied. The dashed lines in this figure indicate the standard higher and lower limits of the concentration for Ti-6Al-4V alloy. In this study, the concentration of Al was within this standard range when the melting time was 60 s. Other ingots with different Al concentrations in the initial state were used to examine the influence of Al concentration on the dendrite arm spacing, as described below.

Minimal concentration in the melted region of the ingot.
To examine the dendrite solidification microstructure, a sample for observation was cut from the upper part of the ingot.
Figure 3(b) shows the microstructure observed using an optical microscope. The microstructure was revealed using nitric hydrofluoric acid solution. However, this technique does not fully expose the primary dendritic microstructure due to the phase change in the solid state upon cooling.
Dendrites of the alloy grew accompanying the solute redistribution during solidification and either the dendrite core or inter dendritic region experienced composition changes due to segregation of the solute elements. Therefore, by measuring the concentration of the solute element within the sample using EPMA, the dendritic morphology could be determined.
Figure 3(c) shows the measurement results of the concentration mapping of V which is a constituent element of Ti-6Al-4V alloy. The V segregation profile can be considered to correspond to the dendritic structure because V segregates in the interdendritic region. From the measurement results of the dendritic structure, it was confirmed that the dendrite grew in two directions: one from the surface to within the ingot and the other from the bottom to upper side. These dendrites collided mutually within the ingot, arresting solid growth. Thus, the final position of the solidification front in the ingot was determined was determined by the balance of heat extraction from the ingot/mold surfaces and radiation from the top surface.
4.6. Dendrite Arm SpacingThe primary dendrite and secondary dendrite arm spacing are fundamental characteristics of a solidification microstructure; they vary with the cooling rate in all alloy systems. In this work we have determined the relationship between the primary and secondary dendrite arm spacing of Ti-6Al-4V alloy and the cooling rate. The cooling rate varied with the distance from the surface of the ingot as shown by the result of the numerical simulation (Fig. 7) and was adopted for the determination of the cooling rate.
Figure 10(a) shows the variation in the primary dendrite arm spacing with the cooling rate. The logarithm of this spacing is proportional to that of the cooling rate.
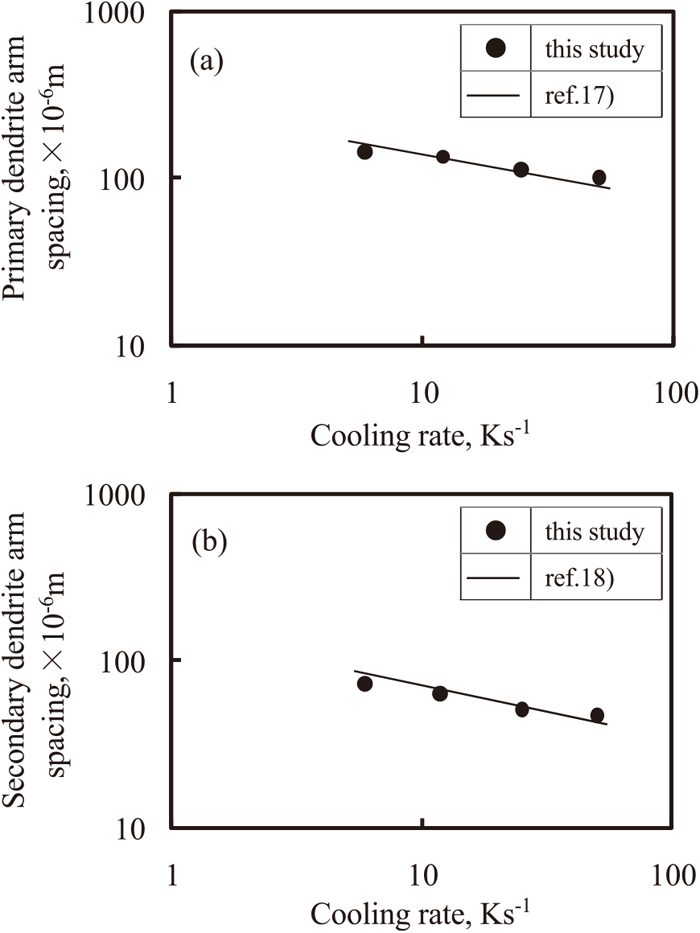
Relationship between dendrite arm spacing and cooling rate of the ingot of which surface region was melted for 60 s. (a) primary arm spacing and (b) secondary arm spacing.
Figure 10(b) shows the variation in the secondary dendrite arm spacing with the cooling rate. This spacing depends on the cooling rate as well as the primary dendrite arm spacing. The higher the cooling rate, the smaller is the secondary dendrite arm spacing.
In case of carbon steel15) and stainless steel,16) the relationship between the primary and secondary dendrite arm spacing, and the cooling rate have been extensively studied. The relationship between the dendrite arm spacing and cooling rate of Ti-6Al-4V alloy was compared with that of 18Cr-8Ni stainless steel.17,18) In this study, this relationship in Ti-6Al-4V alloy almost corresponds to that in 18Cr-8Ni stainless steel. This relation may be due to the fact that the primary phases of both Ti-6Al-4V alloy and 18Cr-8Ni stainless steel both have a body-centered cubic structure.
If the relationship between the dendrite arm spacing and the cooling rate is clarified, the cooling rate of large Ti-6Al-4V alloy ingots which is difficult to measure directly can be predicted, and the casting conditions of large ingots can hence be optimized.
4.7. Dependence of the Al Concentration on the Dendrite Arm SpacingThe dendrite arm spacing varies not only with the cooling rate but also with the alloy solute content.5,19) In this study, when the melting time of the upper region of the ingot was considerable, the melting region spread within the ingot, and the concentration of Al in this region decreased because of evaporation from the surface. The dendrite arm spacing of each ingot was then examined with respect to the cooling rate and Al concentration. When the melted region widened with considerable heating the cooling rate decreased during solidification as expected.
Figure 11(a) shows the relationship between the primary dendrite arm spacing and the cooling rate. This spacing decreased with the increase in cooling rate, when the concentration of Al was varied. At the same cooling rate, the higher the Al concentration, the smaller was the primary dendrite arm spacing.
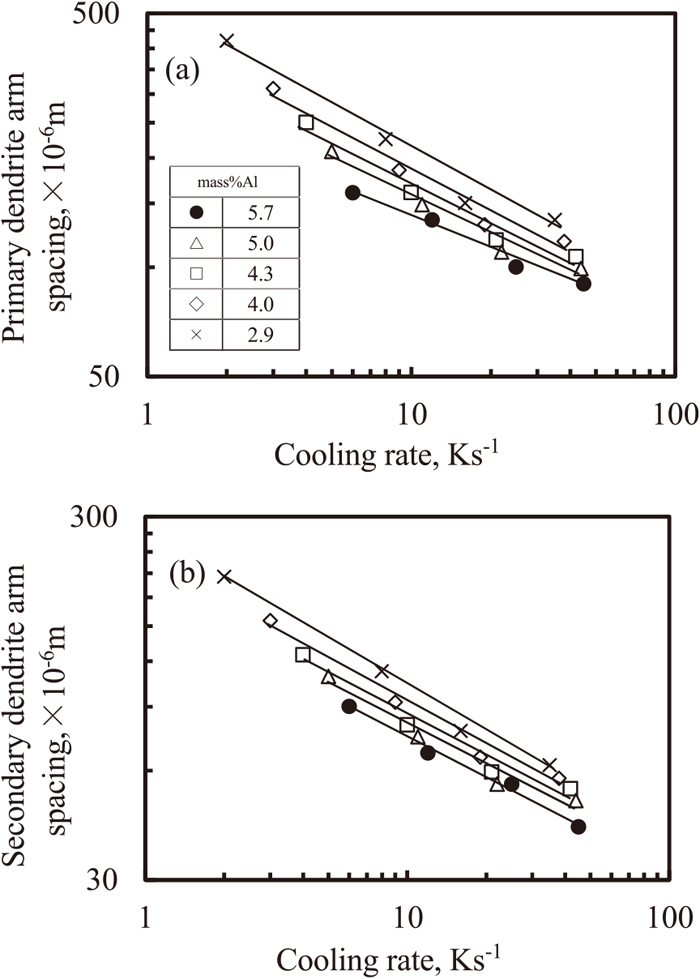
Relationship between dendrite arm spacing and cooling rate under various concentration of Al. (a) primary arm spacing and (b) secondary arm spacing.
Figure 11(b) shows the relationship between the secondary dendrite arm spacing and cooling rate. This spacing decreased with increase in cooling rate, when the Al concentration was varied. At the same cooling rate, the higher the Al concentration, the smaller was the secondary dendrite arm spacing.
Thus, it was clarified that the primary and secondary dendrite arm spacing in titanium alloys containing with Al are dependent on both the cooling rate and Al concentration. On determining the dependence of the Al concentration on parameter C, the cooling rate can be predicted from the measurement results of the primary or secondary dendrite arm spacing. The relationship between the primary and secondary dendrite arm spacing, and the cooling rate is described using the following equation.
| (3) |
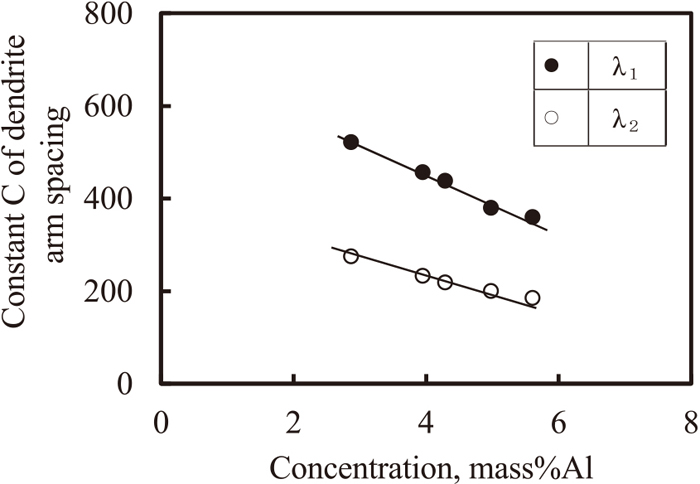
Figure 12 shows the relationship between parameter C of the primary and secondary dendrite arm spacing and the Al concentration. Parameter C changes linearly with the Al concentration, decreases with the increase in Al concentration for the primary as well as secondary dendrite arm spacing. Moreover, it was observed that the value of C for the primary dendrite arm spacing was twice that of the secondary. The relationship between the dendrite arm spacing and cooling rate, and the concentration of Al were determined according Eq. (3); the results are represented by the following equations.
| (4) |
| (5) |
Change of constant C of primary and secondary den.
It was confirmed that the solidification microstructure of Ti-6Al-4V alloy was dendrite. The solute elements of alloys are redistributed to either the dendrite core or inter dendritic region during solidification. In order to clarify the solute redistribution of Ti-6Al-4V alloy, the concentration of both Al and V were measured across the dendrites using EPMA. These measurement results included the influence of redistribution during solidification, and diffusion during cooling to room temperature after solidification. However, the cooling rate of the ingot after solidification was high because the ingot was in contact with the water cooled copper mold, and diffusion after solidification was considered negligible.
Figure 13(a) shows the measurement results of the EPMA mapping of Al. The Al concentration was high at the core of the primary dendrite arm spacing and low in the inter dendritic region.
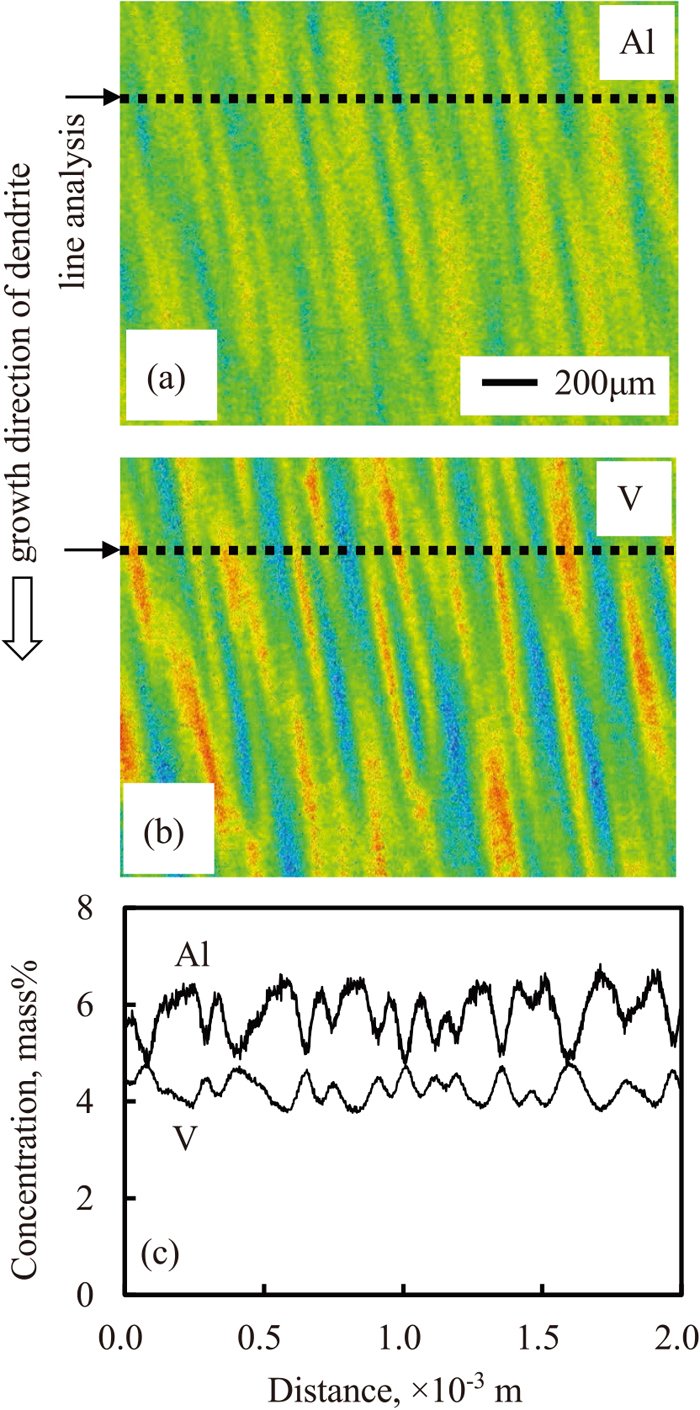
Microsegregation of Al and V in the dendrite region of the ingot of which surface region was melted for 60 s. (a) mapping of Al by EPMA, (b) mapping of V and (c) concentration profiles by line analysis. (Online version in color.)
Figure 13(b) shows the measurement results of the EPMA mapping of V. The concentration of V was low at the core of the primary dendrite arm spacing and high in the inter dendritic region.
Figure 13(c) shows the concentration profiles of Al and V at the positions indicated by the dashed lines in Figs. 13(a) and 13(b), respectively. The positions of the maximum Al values correspond to the positions of the minimum V value, and vice versa.
Thus, it was clarified that the opposite redistribution of solute elements was caused simultaneously during the solidification of Ti-6Al-4V alloy.
Many studies20,21) have measured the equilibrium partition coefficient during solidification. In this study, the elemental concentration in the dendrites was clearly defined. The partition coefficients of Al and V in this work can be evaluated as the ratio of the concentration in the dendrite core to that in the inter dendritic region. When the experimental partition coefficients were calculated from the EPMA measurement results, the values for Al and V were 1.2 and 0.8, respectively. The intensity of X-ray measured using EPMA was converted to the concentration with the calibration curve made with the standard samples. The accuracy of the calibration curve was ±5%. Using a thermodynamic database,22) the calculated values of the equilibrium partition coefficients of Al and V were 1.2 and 0.9, respectively.
Thus, it was demonstrated that the solidification microstructure of Ti-6Al-4V alloy was dendritic within the range of freezing rates experience in these experiments, and that solute redistribution occurred during solidification in close approximation to that predicted from equilibrium data.
In this study, the dendritic microstructure and microsegregation of Ti-6Al-4V alloy were examined through the solidification experiments using a lab-scale electron beam melting furnace. The following results were obtained.
(1) Ti-6Al-4V alloy was solidified by undercooling, and the solidification microstructure was dendritic. The primary and secondary dendrite arm spacing which are the basic characteristics of dendrites were examined with respect to the cooling rate.
(2) The primary and secondary dendrite arm spacing varied with the Al concentration. At the same cooling rate during solidification, the higher the Al concentration, the smaller were the primary and secondary dendrite arm spacings.
(3) The Al segregates negatively and was found to be at high concentration in the dendrite core and low in the inter dendritic region. On the contrary, V segregated negatively, hence was low in the dendrite core and high in the inter dendritic region. These findings are in accord with practical experience on the melting and casting of industrial alloys.