Abstract
The softening and melting (SM) under load test is routinely conducted to assess the quality of ferrous burden materials and to predict their possible performance in blast furnace. Due to complex phase interactions coupled with chemical reactions at an elevated temperature range (~973 to 1873 K), the flow dynamics in the test system are quite complex. This study systematically investigates the contraction behaviour and associated pressure drop in a SM test bed for sinter, lump (NBLL, Newman Blend Lump) and a mixture of these two types of ore (21 wt% NBLL + 79 wt% sinter). To quantify the structural changes in a sample bed, interrupted tests at various temperatures were conducted and analysed using both synchrotron X-ray computed tomography (CT) at a lower temperature range (1273 to 1473 K) and neutron CT at a higher temperature (1723 K). It was noted that existing packed bed pressure drop models (Ergun model, 1952, fused bed model, Sugiyama et al., 1980, orifice model, Sugiyama et al., 1980) and modified orifice model, Ichikawa et al., 2015) exhibited divergence in their predictions at higher temperature when the porosity parameter was computed directly from the bed contraction data. To avoid this modelling failure, a growth-decay type porosity-temperature relationship based on extensive SM test data was incorporated in the well-known Ergun equation which estimated reasonable bed pressure drops. Furthermore, a simplified ore specific friction factor model was empirically derived which was also shown to produce reasonable pressure drop predictions for all types of ferrous burden samples.
1. Introduction
Despite many advances in the ironmaking technology, the blast furnace remains the workhorse for iron production worldwide1,2) including the Asia-Pacific regions. It is a complex multiphase counter-current moving bed reactor with alternate layers of ferrous and coke stacked vertically. During operation, it comprises four phases, i.e., solids, gases, powders and liquids, and includes temperature regions spanning from normal temperature to temperatures exceeding 2273 K.
Due to reduction reactions at high operating temperature, significant variation in the melting point of ore phases occurs as it is reduced from hematite to magnetite, then to wüstite and finally to metallic iron. Such transformations in ore structure first result in softening of ore particles aided by the burden load followed by melting of ore particles along with generation of a slag phase primarily containing stable metallic oxides (SiO2, CaO, MgO, and Al2O3) present in ore and a relatively smaller quantity of coke ash. The widely referred temperature range between which softening (~1173 to 1473 K) and final melt down (~1673 to 1873 K) of the ferrous burden is thought to occur is often defined as the cohesive zone (CZ).3,4,5)
Due to softening and melting, permeability of ferrous burden in the CZ decreases significantly and consequently, gas is forced to pass through the relatively more permeable coke layers.6) The temperature range of the CZ critically governs the overall bed permeability and associated flow dynamics, and therefore has a direct impact on the performance and stability of a blast furnace.1,4,7) A narrow width of the CZ usually reflects steep transformation from solid to liquid phase and ultimately, a higher bed permeability. Bed permeability however also depends on the burden composition i.e. a lump ore-nut coke mixture of same CZ thickness to that of lump ore alone will have better permeability.5) Subsequently, distribution of gas and liquid phases in the system becomes more uniform which in turn controls the reduction degree of the ore burden. Appropriate reduction degree is critical in BF operation to ensure productivity. Inefficient reduction degree affects phase chemistry i.e. amount of flux addition, slag production, and associated solid phase microstructures.
With a requirement to gain more fundamental understanding of the bed flow dynamics, several numerical investigations of the BF system have been reported in recent years utilising computational fluid dynamics (CFD),8) particle-based discrete element method (DEM),7) Extended DEM (XDEM) with enhanced thermodynamic state for each particle6) and most comprehensive coupled computational fluid dynamics and discrete element method (CFD-DEM)9) for simulating fluid and particle phase, respectively. Good reviews of the available computational approaches for simulation of a BF system can be found in Dong et al. (2007)10) and Ariyama et al. (2014).11) Despite these developments, it is important to acknowledge that even with the currently available computational resources, it is still unachievable to simulate a full-scale BF system using a numerical approach and many simplifying assumptions such as use of larger than actual particle diameter and partial computational domain using periodic boundary condition, are indeed necessary.
Although an insightful understanding of the BF flow dynamics is critical, it is acknowledged that any direct measurements of bed morphology in an operating blast furnace are challenging and consequently validation of such numerical models becomes difficult. As an alternative, the softening and melting (SM) under load test1,3,5,12,13,14) as a BF operation analogue, is routinely carried out in the laboratory to characterise the possible performance of a ferrous burden in actual operation. This test measures several important features such as bed contraction behaviour, SM temperatures of the ore burden, bed permeability, pressure drop, and ore reducibility. For detailed information on the SM test, readers are directed to a recent work of the authors (Liu et al., 2018)12) which provides a comprehensive review of this topic.
An expectation from the SM test data is to provide an insight into the complex BF operational process, which would aid in developing a reliable pressure drop model for the CZ. Additionally, flow dynamics data obtained from SM test are crucial for validating and developing more rigorous numerical models in this area which should provide opportunity to better understanding of the bed behaviour.
Modelling pressure drop in the SM test has been largely reported based on fewer approaches. Available models for predicting pressure drop in packed beds are largely based on the well-known Ergun equation (Ergun, 1952),15) with certain modifications. Sugiyama (1980)16) conducted comprehensive work to develop empirical models to describe the pressure drop in a fused bed akin to a SM test. Two models originated from this work, namely: 1) a fused bed model, which incorporates an additional resistance due to partial melting (fusion) of the bed; and 2) an orifice model, which accounts for flow through a partially open bed using an orifice like discharge coefficient. Ichikawa et al. (2015)17) later reported good agreement with their experiment by introducing a liquid volume fraction (estimated from thermodynamic calculations) into Sugiyama’s orifice model to account for a decrease in the available bed porosity.
For realistic predictions, it is important to include a temperature-dependent ore specific bed porosity variation in a pressure drop model which accounts for both bed deformation and generation of liquid melt fraction contributing to reduction in the bed porosity. Intuitively, it is expected that at a given temperature, bed porosity will vary spatially, however, this information is not directly available from a routine SM test. With this motivation, this study aimed to investigate the morphological change of different ferrous burden samples in a SM test apparatus quenched at different temperatures, by utilising high-energy synchrotron X-ray scanning and neutron scattering tomography techniques. Using the temperature-porosity data obtained from the tomography measurements, the pressure drop across the SM test bed was quantified theoretically.
In a previous work of the authors,18) a power law type temperature dependent porosity profile was utilised based on tomography measurements for an Australian porous hematite lump ore. Use of the Ergun equation incorporating this temperature dependent porosity resulted in an improved pressure drop prediction compared to the Sugiyama and Ichikawa equations, however, it is thought that this approach can be improved further using a population growth-decay model having a better physical basis for temperature dependent porosity variation.
In tune with the above-stated aim, the rest of the paper is organised as follows: Section 2 provides a brief description of the SM experiment; Section 3 summarises the computed tomography approach; Section 4 describes various pressure drop modelling approaches and derivation of a temperature-porosity relationship. The results of the new modelling approaches applied to Australian lump ore (NBLL), sinter, and a mixed burden of NBLL and sinter are presented in Section 5.2. Finally, the findings of this study are summarised in Section 6.
2. Experimental
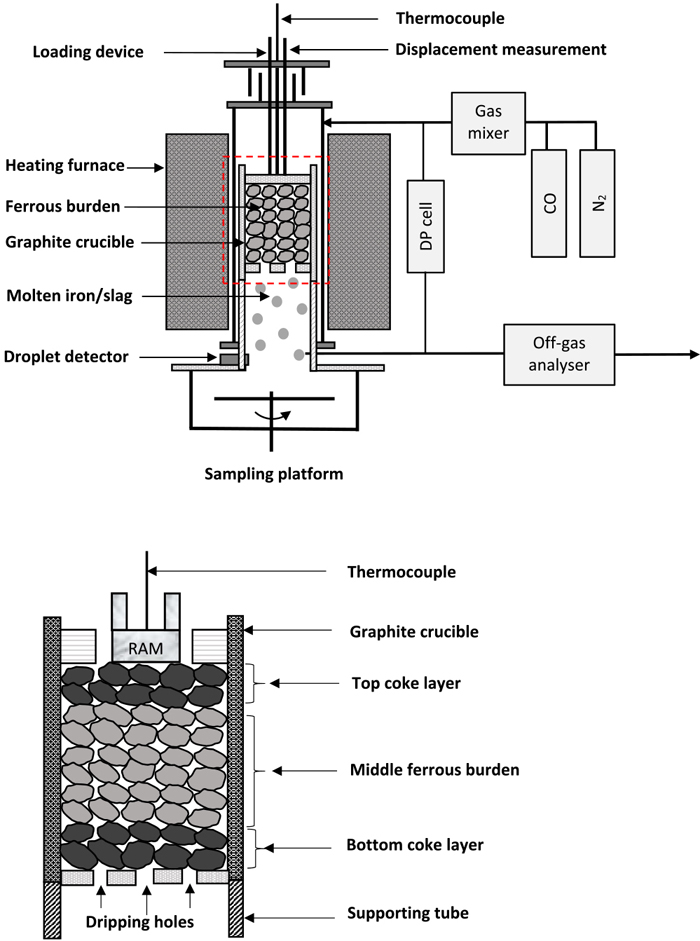
Figure 1 presents the SM test apparatus used for the experiments, which has been described in detail in earlier studies.3,12,19,20) In the test, ferrous burden samples were placed in a graphite crucible in between two alternate coke layers of different heights. Three different types of burden were used – lump (NBLL), sinter, and a mixture of sinter and ore (21 wt.% NBLL + 79 wt.% sinter). The mixed burden ore composition was typical to the iron bearing charge commonly encountered in the Asia-Pacific region. Composition of the ferrous burden samples tested in this study are given in Table 1.
Table 1. Typical compositions of lump and sinter type ferrous burden samples.
| Composition | NBLL (wt.%) | Sinter (wt.%) |
|---|
| Fe (total) | 62.8 | 56.7 |
| FeO | – | 7.6 |
| SiO2 | 3.70 | 5.43 |
| Al2O3 | 1.40 | 1.87 |
| MgO | 0.10 | 1.76 |
| CaO | 0.05 | 10.04 |
| P | 0.080 | 0.067 |
The graphite crucible was kept in a temperature-controlled heating furnace wherein temperature was increased gradually from ~ 473 to 1853 K following a predefined ramp rate. A gas stream comprising 70 vol.% N2 and 30 vol.% CO at a controlled temperature was passed through the crucible to reduce the ore. The composition of the off-gas leaving the furnace was monitored using an infra-red gas analyser.
A blown-up view of the graphite crucible containing the particle is shown separately in Fig. 1(b). A pneumatic ram was utilised to keep the bed under a fixed external load of 98 kPa. Gradual contraction in the bed height due to SM with temperature was measured with a linear variable drive transducer sensor. Differential pressure across the bed was monitored throughout the test. Melting in the bed at higher temperature was confirmed by visualising dripping of molten droplets in the collecting tray underneath the test assembly.
For determining bed porosity, a series of interrupted tests were conducted wherein ferrous burden samples were heated to different set temperatures and then quenched rapidly by turning the heater off and passing cold nitrogen gas through the sample. Operating conditions of experiments are summarised in Table 2.
Table 2. Summary of the experimental operating conditions and sample physical parameters.
| Crucible dimensions (m) | 0.06 (ID) × 0.11 (H) |
| Ferrous burden layer height (m) | 0.07 |
| Top coke layer height (m) | 0.015 |
| Top coke layer height (m) | 0.025 |
| Gas flow rate (m3·s−1) | 2.333 × 10⁻⁴ |
| Gas inlet temperature (K) | 298 |
| Gas inlet pressure (kPa) | 158 |
| Ferrous burden sample weight (kg) | 0.3 – 0.4 |
| Ferrous burden bulk density (kg·m−3) | 1600 – 2000 |
| Ferrous burden apparent density (kg·m−3) | 3300 – 3465 |
| Avg. particle (ore and coke) diameter (mm) | 11.25 |
| Coke mass (kg) | ~0.06 |
| Coke particles bulk density (kg·m−3) | 531 |
| Coke particles apparent density (kg·m−3) | 1000 |
| Ore particle sphericity (–) | 0.83 |
| Coke particle sphericity (–) | 0.82 |
| Intra-particle porosity (ore) | 0.29 |
| Bed quenching temperature (K) | 1273, 1373, 1473, 1723 |
3. Computed Tomography Measurement
Samples quenched in the temperature range 1273–1473 K were analysed using the Synchrotron X-ray CT facility at the Imaging and Medical Beam Line (IMBL) (3 GeV energy), Australian Synchrotron, Melbourne.19) The samples quenched at 1723 K had more metallic Fe content in the liquid phase due to higher reduction degree of ore, making it difficult for X-ray beam scanning due to higher attenuation coefficient. To overcome this problem, these high temperature samples were scanned at the Australian Nuclear Science and Technology Organisation (ANSTO), Sydney.19)
Images produced from both X-ray CT and neutron scattering were reconstructed on parallel computing machines and utilised for further image processing. Resolutions of images from X-ray CT and neutron scattering were ~31.5 and 50 μm/voxel, respectively. Each set of images (a stack of radial slices) were then segmented based on the difference in their grayscale values using AVIZOTM software at CSIRO (Commonwealth Scientific and Industrial Research Organisation) which comprised a series of image processing steps involving filtering and phase edge detection based on a global thresholding approach. Finally, axial variation of each phase (coke, ore and void) was computed based on an area-weighted average of each slice. A more detailed description has been reported previously by the authors.19)
4. Pressure Drop Modelling Approaches
4.1. Pressure Drop Models
Available literature in modelling the flow dynamics of the BF system, specifically the CZ system shows that four main approaches have been utilised to estimate pressure drop, namely: Ergun equation;15) fused bed model;16) orifice model,16) and modified orifice model.17) A brief description of these modelling approaches is given in the following subsections.
4.1.1. Ergun Equation
Pressure drop for any packed bed system in general can be estimated by the Ergun equation, which contains contribution from both viscous (laminar) and inertial (turbulent) flow components, and is written as follows:
|
ΔP=
150
μ
g
U
0
(
1-
ε
g
)
2
L
ε
g
3
φ
2
d
p
2
+
1.75
ρ
g
U
0
2
(
1-
ε
g
)
L
ε
g
3
φ
d
p
| (1) |
where Δ
P = pressure drop (Pa),
L = bed height (m),
μf = fluid viscosity (Pa·s),
ρf = fluid density (kg·m
−3),
U0 = superficial fluid velocity (m·s
−1),
εg = bed porosity (−),
φ = particle sphericity (−),
dp = particle diameter (m).
4.1.2. Fused Bed Model
Utilising the general expression for pressure drop in pipe flow, for a fused bed system, pressure drop can be estimated as follows:
|
ΔP=
f
b
(
L
φ
d
p
)
(
1-
ε
g
ε
g
)
(
ρ
g
U
0
2
2
)
| (2) |
where
fb is fused bed friction factor and expressed as a function of bed shrinkage ratio in the empirical form as
f
b
=a+
b
1
S
r
b
2
(Sugiyama, 1980)
16) where
a,
b1 and
b2 are the fitted variables and given as
a = 3.5,
b1 = 44,
b2 =1.4, respectively.
4.1.3. Orifice Model
Considering that the fractional opening area of a packed bed acts as an orifice, the following pressure drop model was suggested by Sugiyama (1980)16) as follows:
|
ΔP=
(
1
Cm
)
2
(
1
φ
d
p
(
1-Sr
)
)
(
ρ
g
U
0
2
2
)
L
| (3) |
where the orifice coefficient,
C, is given by
C = 0.597 − 0.011
m + 0.432
m2, fractional opening area,
m, expressed as
m=1-(
1-α
ε
g
)
(
γ
3
1-Sr
)
, bed shrinkage ratio,
Sr, in terms of initial (
Lo) and temperature-dependent (
L) bed length
Sr=1-(
L
L
0
)
, particle diameter ratio
γ = 1 – 0.25
Sr, and
α=0.8 is an empirical correction factor applied to the bed porosity.
4.1.4. Modified Orifice Model
Introducing a decrease in the available bed porosity, εg, due to melting of ferrous phase, Ichikawa et al. (2015)17) proposed the following correction to Eq. (3) as:
|
ΔP=
(
1
C(
ε
g
-
ε
l
)
)
2
(
1
ϕ
d
p
(
1-Sr
)
)
(
ρ
g
U
0
2
2
)
L
| (4) |
where
εl is the liquid volume fraction.
Note that the estimation of fractional opening parameter, m, in Eq. (4) is different from the Orifice model approach (Sugiyama, 1980)16) which accounts for reduction of available porosity due to melt formation.
4.2. Modelling of Bed Porosity
4.2.1. Determining Bed Porosity from SM Test Contraction Data
In a packed bed system two types of porosity parameters, namely inter-particle (void spaces between particles) and intra-particle (void spaces within a particle), can be defined.21) In the SM test system, the total ferrous layer height, HFe, is assumed to be sum total of the equivalent heights of inter-particle porosity, H1, intra-particle porosity, H2, and ore particles, H3, themselves which is given as follows:
|
H
Fe
=
H
1
+
H
2
+
H
3
| (5) |
where equivalent height of the initial inter-particle porosity,
εg,0, is given as:
and equivalent height of intra-particle porosity,
εg,particle, is given as:
|
H
2
=(
1-
ε
g,0
)
ε
g,particle
H
Fe
| (7) |
Ferrous layer porosity in terms of inter particle porosity for a given bed shrinkage is defined as the ratio of the decrease in the equivalent height of inter-particle spaces to available ferrous layer height accounting for bed contraction,
Hc, as follows:
21)
|
ε
g,inter
=
H
1
-
H
c
H
Fe
-
H
c
.
| (8) |
In terms of intra-particle void space, the ferrous layer porosity is defined as the minimum of the equivalent heights of inter-particle porosity and combined inter- and intra-particle porosity, relative to the available ferrous layer height:
21)
|
ε
g,intra
=
min(
H
1
,
H
Fe
-
H
3
-
H
c
)
H
Fe
-
H
c
| (9) |
where the equivalent height of the ferrous particles themselves is given as:
|
H
3
=(
1-
ε
g,bed
)
(
1-
ε
g,particle
)
H
Fe
.
| (10) |
Given both inter- and intra-particle porosity are lost during contraction, a combined porosity definition can be given as:
21)
|
ε
g,comb
=(
H
1
H
1
+
H
2
)
(
H
Fe
-
H
3
-
H
c
H
Fe
-
H
c
)
.
| (11) |
To describe the observed decrease in the ferrous layer porosity, an analogy can be drawn to a general population balance model which involves three distinct phases, including birth, growth and death following a maximum (saturated) growth.
A sample bed has a maximum porosity εg,0 at the beginning of an SM test. As the test progresses, the ferrous layer porosity, (εg), gradually decreases due to both softening of ore particles (shape deformation at high temperature due to applied load) and melting of ore particles which may lead to filling up of both intra- and inter-particle porosity. Considering the declining phase of the population balance model, decrease in εg with temperature can be expressed as proportional to the available porosity and the fraction of porosity not decayed yet and can be written as follows:
|
d
ε
g
dT
=r
ε
g
(
ε
g,0
-
ε
g
ε
g,0
)
.
| (12) |
where
r is a proportionality constant which represents the decay rate of bed porosity (K
−1).
Equation (12) can be rearranged and integrated as follows:
|
∫
(
1
ε
g
+
1
ε
g,0
-
ε
g
)
d
ε
g
= ∫
rdT
+a
|
|
ln(
ε
g
ε
g,0
-
ε
g
)
=a+rT
|
|
(
ε
g
ε
g,0
-
ε
g
)
=
e
a+rT
|
where
a is a non-dimensional system (integration) constant.
The above expression can be rearranged to finally obtain the following porosity-temperature relationship
|
ε
g
=
ε
g,0
1+
e
-(
a+rT
)
.
| (13) |
Equation (13) provides an improved theoretical basis to the temperature-dependent porosity variation approach earlier described by a purely empirical power law type relationship.18)
5. Results and Discussion
5.1. Pressure Drop Modelling: Growth-decay Based Porosity Kinetics Model
In this section, experimental data of three other different types of ferrous burdens, namely lump (NBLL), sinter and mixed burden (21% NBLL and 79% sinter), are presented along with a comparison of pressure drop data with a new modelling approach based on a growth-decay based porosity kinetics.
Figure 2 presents typical SM test results for each of the three burdens, showing the variation in bed pressure drop (primary axis) and bed shrinkage ratio (secondary axis) with temperature. Two different regimes, R1 (negligible bed contraction) and R2 (rising bed contraction) can be clearly identified here. A non-linear rise for the lump ore and a linear rise for the sinter and mixed burden ore is quite apparent in Fig. 2.

For all burden samples, it can be noted that in regime R1, there is almost no change in the bed shrinkage ratio and bed pressure drop from ~1073 to 1173 K. Slightly beyond this region, up to ~1273 K, the pressure drop remains almost constant whilst some bed contraction can be observed e.g. NBLL shows a higher contraction (~15–20%) compared with sinter and the mixed burden (<4%). This observation leads to the conclusion that thickness of softening range has little effect on bed permeability. This is reasonable due to the fact that in the softening range bed contraction occurs primarily due to particle deformation and not due to melt formation.22) A characteristic distinct peak can be seen in the temperature range ~1673–1773 K. In this regime, a steep pressure drop increase occurs (NBLL ~8 to 12 kPa, sinter ~2 kPa and mixed burden ~1 kPa) while the sample bed undergoes significant contraction by ~75 to 80%. This observed rise in pressure drop is attributed to complete softening and subsequent melting of ferrous burden leading to formation of liquid oxides.
Based on the available studies addressing the SM behaviour of ferrous burden,1,12,23,24) it is plausible to suggest that the lowest melting point component of the ferrous burden, a wüstite-containing melt (fayalite for lump, olivine for sinter), first forms as a function of temperature and reduction degree. In the case of lump, this phase change leads to formation of a porous metallic iron shell comprising a solid phase along with a liquid (melt) phase which fills up the surface pores (intra-particle pore spaces) within the microstructure. With increasing temperature, the melt volume fraction increases leading to a decrease in the mechanical strength of the core which has less resistance to deformation under applied load.
Due to improved wetting of internal pore walls by a melt phase with higher interfacial tension, the resistance to gas flow gradually increases. Strength of the iron shell gradually decreases at higher operating temperatures, and surface cracks eventually develop leading to exuding of wüstite melt along with molten slag from the surface pores of the ferrous particles. The molten liquids gradually fill up the inter-particle pores and create significant resistance to the gas flow. A steep decrease in bed pressure drop follows the peak due to downward movement of the molten phase, including the now molten carburised metallic iron as it flows through the coke layer. This is confirmed by observations of liquid material dripping from the system on to the sampling device (Fig. 1).
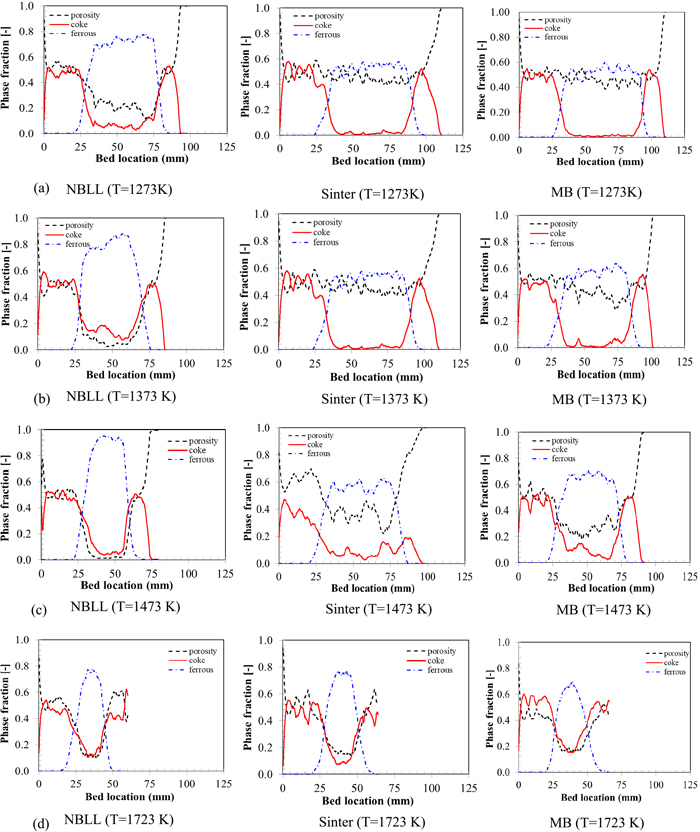
To determine the temperature dependent growth-decay based porosity kinetics (Eq. (13)), interrupted tests were conducted for all three burdens at four different temperatures - 1273, 1373, 1473 and 1523 K, respectively. Figure 3 compares axial variations in the phase fractions of all three components - coke, ferrous and void with temperature for each burden. Intersections of the coke (solid red) and ore (blue dashed) lines indicate the individual phase boundary between top coke and ore layer, and bottom coke and ore layer, respectively. With temperature, it can be noticed that lump ore (NBLL) loses its porosity significantly even at a lower test temperature. For example, at 1273 K, NBLL shows a decrease of ~50% porosity (from ~0.4 to 0.2) while porosity in sinter and mixed burden remains almost unaffected at ~0.5 to 0.6. This trend continues for the 1173 and 1473 K cases as well, where porosity loss in lump ore is significantly higher. When the temperature is further increased to 1723 K, all ferrous burdens show very low porosity (<0.1). Due to the orientation of the ore and coke layers in the system (in series and in the direction of gravity), the upper coke layer remained relatively unaffected by the presence of melt; however, due to gravity effect and externally applied load, some presence of melt was detected in the bottom coke layer at elevated temperature towards the end of experiments.
From Fig. 3, the height-averaged porosity value of each phase layer was determined as follows:
|
ε
g,layer
=
∫
ε
g,local
dh
∫
dh
.
| (14) |
To determine the coke layer heights at top and bottom,
Eq. (14) was integrated from an arbitrarily chosen slice at the top and bottom end of an image stack with minimal coke phase fraction to the distinct intersection points in the middle ferrous layer (
Fig. 3).
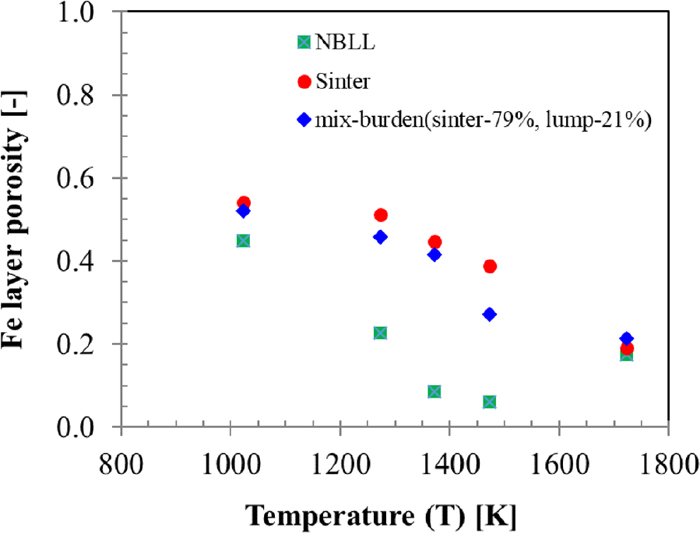
Height-averaged porosity values determined from tomography for all three ferrous burden types are presented in Fig. 4. The initial void fraction values at 1023 K were computed from the ratio of bulk to apparent densities of the ferrous burden samples. A clear decreasing trend in the ferrous layer porosity with temperature can be noted in all cases. Porosity loss was relatively smaller (~60%) for sinter and mixed burden samples (from ~0.52 to 0.2) compared with the lump ore, where the loss was much higher (> 85%) with a decline from the initial value of ~0.45 to 0.06. This trend was also observed in the PHGL (porous hematite goethite lump) case studied earlier.18) The overall system porosity accounting for the top and bottom coke layers however was less affected (~25–50%). For example, the decreases in bed porosity for sinter, lump and mixed burden were ~0.57 to 0.39, ~0.4 to 0.3, and ~0.5 to 0.24, respectively.
The observed porosity variation may be explained from a thermodynamic perspective. Figure 5 presents thermodynamic equilibrium-based predictions of melt formation for all three types of ferrous samples. Although the overall melt quantity is similar for all three types (liquid fractions of ~0.25–0.3), the lump ore shows an abrupt change in melt production just above its liquidus temperature (~1433 K).
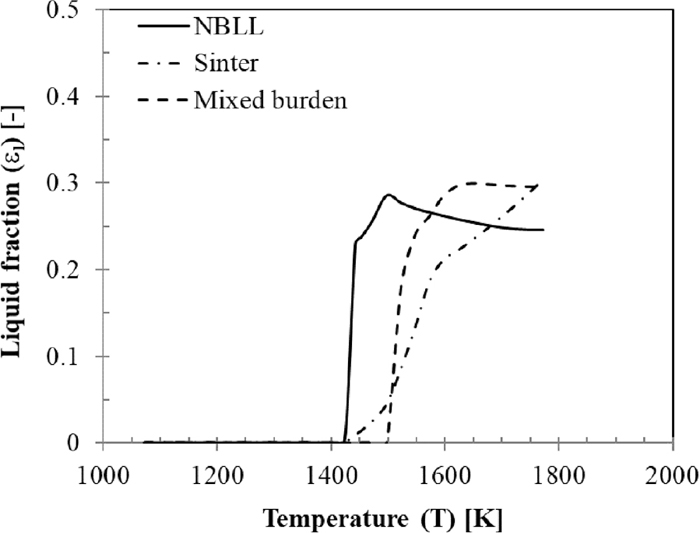
Compared with the other two burdens, the maximum liquid fraction for NBLL (~30%) occurs at a much lower temperature (~1500 K). For sinter, liquid production occurs relatively slowly with temperature (maximum melt production occurs at ~1723 K) while the mixed burden reaches maximum liquid production state at ~1623 K. This comparison suggests that lump ore is expected to soften at a lower temperature. The measured lower porosity value of lump ore below 1473 K is therefore attributed to significant deformation of ore particles due to softening behaviour. Further loss of porosity for lump ore at 1473 K is attributed to melt formation which is likely to first fill up the intra-particle porosity and then inter-particle porosity, leading to rapid drop in the available porosity (~0.06). The other two burdens are predicted to produce significant quantities of melt at higher operating temperature, which explains their relatively higher porosity compared with lump ore in the 1273–1473 K temperature range.
Interestingly, NBLL as opposed to the other two burdens, exhibits a sudden rise in porosity (also noted for PHGL)18) at the highest temperature case (1723 K). This behaviour can possibly be explained by considering the melt viscosity characteristics, shown in Fig. 6. The melt viscosity parameter for all three ferrous burdens was computed from FactSage based on the following melt compositions (%) (rest of the burden compositions include the oxygen removed and Fe content) in the temperature range from 1373 to 1773 K – NBLL (Al2O3 = 1.464, SiO2 = 3.87, CaO=0.052, FeO: 28.75 – 13.08, MgO = 0.105); Sinter (Al2O3 = 1.87, SiO2 = 5.430, CaO=10.040, FeO: 17.569 – 4.626, MgO = 1.76); MB (Al2O3 = 1.789, SiO2 = 5.118, CaO=8.042, FeO: 19.805 – 6.316, MgO = 1.4290). In these calculations, only viscosity of the melt phase was considered excluding any small particles that might be present in the actual system. Compared with sinter and mixed burdens, the NBLL melt has the lowest viscosity (~0.05 to 0.02 Pa·s) in the temperature range from 1473 to 1673 K and hence, will flow more easily through the bottom coke layer when gas pressure builds up in the melting ferrous layer. With the exudation of melt from the ferrous layer, void spaces are likely to increase; this can explain the sudden rise in the ferrous layer porosity at 1723 K earlier showed in Fig. 4.

The interrupted tests results (Fig. 4), along with those from the full-length test, were utilised to determine the two fitting parameters of the growth-decay approach-based porosity kinetics (Eq. (13)) over a large operating temperature range i.e. to the limit where the first pressure peak appears in the system. Table 3 summarises the parameters and their corresponding correlation coefficients for all three types of ferrous burden samples.
Table 3. Fitted parameters for the growth-decay type porosity kinetics model.
| Ore type | a | r | Correlation coefficient |
|---|
| NBLL | 7.65 | −0.0055 | 0.86 |
| Sinter | 6.22 | −0.0045 | 0.90 |
| Mixed burden (79% Sinter + NBLL) | 4.55 | −0.0034 | 0.95 |
Figure 7 shows a typical porosity-temperature relationship for the NBLL ore. The improvement in the porosity-temperature dependency relationship achieved with Eq. (13) compared with Eqs. (8), (9), (10) is quite apparent. The growth-decay porosity kinetics model in Eq. (13) presents a less steep porosity variation over the entire operating temperature range and avoids the singularity encountered with Eqs. (8), (9), (10) at a much lower operating temperature.
Based on the prediction capability for pressure drop of the Ergun equation (Eq. (1)) with a temperature-dependent power law porosity parameter, demonstrated earlier,18) only the results calculated using the Ergun equation coupled with the porosity kinetics model (Eq. (13)) are presented. Additional pressure drop for gas flow through multiple holes at the inlet and outlet connections of the crucible were also considered and computed using the Hagen-Poiseuille equation as follows:
|
ΔP=(
128
Q
g
μ
f
L
f
π
d
hole
4
)
| (15) |
where
Qg is the gas flow rate (m
3·s
−1),
Lf =0.01 m is length of the inlet and outlet connectors,
Dh is the hole diameter (m) of the gas inlet and outlet. Total pressure drop of the system was computed by accounting for the three separate layers in the sample bed and the associated connections.
Figure 8 compares the predicted pressure drops with four independent SM test datasets (different from those used in determining the fitting parameters given in Table 3). In all cases, the model provides reasonable agreement with experimental data. Errors in the model prediction were determined based on the normal root mean square deviation (NRMSD) defined as
NRMSD=
RMSD
Max. value-Min. value
×100%
where
RMSD=
∑
j=1
N
(
x
model
-
x
exp.
)
2
N
and Max. and Min. refers to the maximum and minimum value of the pressure drop dataset, xexp, respectively. Using this error metric, deviations in model predictions were ~26%, 23% and 17% for NBLL, sinter and the mixed burden (79% sinter + 21% NBLL) respectively, which were considered reasonable.
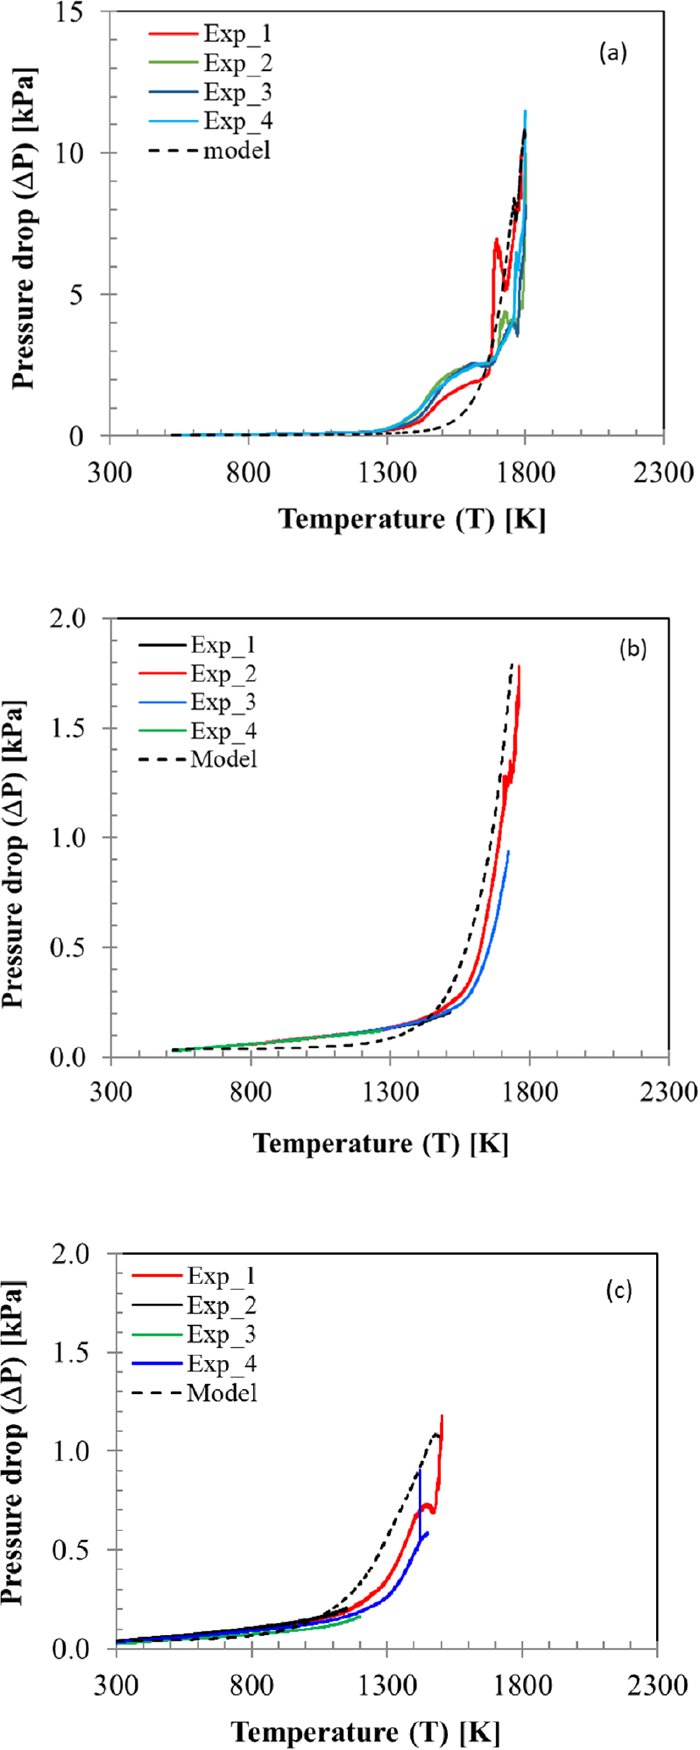
It is relevant to mention that the lump ore (NBLL) is known to exhibit a very different characteristics involving complex variations in pressure drop in different temperature ranges and double pressure peaks (Fig. 8(a)). The model parameters were optimised considering all these variations in the pressure profile, however, since the model presents a smooth continuous curve for the entire operating temperature range, these intermediate irregularities/discrete characteristics were not exactly predicted. Nonetheless it does not make the model inadequate at all since it is still able to produce some reasonable predictions at those intermediate temperature points and cover the entire operating temperature range including the peak pressure drop. To explain this irregular pressure drop behaviour, future work will focus on further examination of the softening and melting mechanism for lump ore, including the different liquid fractions produced as slag phases and metallic iron.
5.2. Determining Ore Specific System Friction Factor
In Section 5.2, the efficacy of a pressure drop model incorporating a temperature-dependent, growth-decay type porosity-temperature relationship was presented. However, a simpler straightforward approach would involve prediction of the bed pressure drop based on a lumped parameter type system friction factor utilising the SM tests data without requiring any additional CT scan measurements. A methodology for determining the bed friction factor is described in this section.
In a packed bed system, pressure drop due to gas flow in functional form can be written as follows:
|
ΔP=f(
φ,
ε
g
,
d
p
,L,
U
0
,
ρ
g
,
μ
g
)
| (16) |
In Eq. (16), there are eight variables of which six are dimensional that involve three fundamental dimensions – mass, length and time. Applying Buckingham pi theorem to this system, three independent non-dimensional groups (number of variables – number of fundamental dimensions) can be constituted as follow:
|
ΔP
(
ρ
g
U
0
2
2
)
∞(
L
φ
ε
g
d
p
)
(
d
p
U
0
ρ
g
μ
g
)
| (17) |
The left-hand side of
Eq. (17) is non-dimensionalised by the dynamic pressure term
ρ
g
U
0
2
2
which yields the well-known Euler number,
Eu. The two right hand side terms are also non-dimensional wherein the first term represents a geometric ratio of the system while the second term denotes a ratio of the inertial force to viscous force
i.e. particle Reynolds number. In the first term, two parameters,
φ, and
εg being non-dimensional, can be rearranged into any convenient form. Both parameters have been kept in the denominator with a physical basis that system pressure drop increases with both decreasing particle sphericity and bed porosity.
Substituting Euler number
Eu=
ΔP
(
ρ
g
U
0
2
2
)
in Eq. (17), it can be simplified using only a lumped parameter type system friction factor fb incorporating the effect of both system geometry and flow condition as follows:
Equation (18) is particularly useful as it does not require specifying the bed parameters such as particle diameter, sphericity and void fraction for pressure drop estimation which are difficult to determine specifically when a bed begins to soften and fuse. Based on several full-length tests, a friction factor model of the following form was fitted to the bed pressure drop and contraction ratio data for the three types of ores as follows:
|
f
b
=
f
Ergun
+
n
1
S
r
n
2
| (19) |
where
fErgun is the equivalent friction factor obtained from Ergun equation for an undeformed bed (
Sr~0) by non-dimensionalising
Eq. (1) using
ρ
g
U
0
2
2
, and two constant parameters,
n1 which is the pre-factor and
n2 which is the exponent, were obtained by linear regression.
Equation (19) was fitted for different bed shrinkage ratios involving
Sr=0.5, 0.6, 0.7 and 0.8 and all curves were observed to collapse consistently on a single trend line. All parameters of
Eq. (19) are summarised in
Table 4.
Table 4. Fitted parameters for the fused bed friction factor model for Sr=0.8.
| Ore type | fErgun | n1 | n2 | R2 |
|---|
| Lump (NBLL) | 3.4 | 355.8 | 3.29 | 0.97 |
| Sinter | 1.6 | 33.7 | 2.25 | 0.88 |
| Mixed burden (79% sinter + 21% NBLL) | 1.7 | 13.4 | 1.36 | 0.80 |
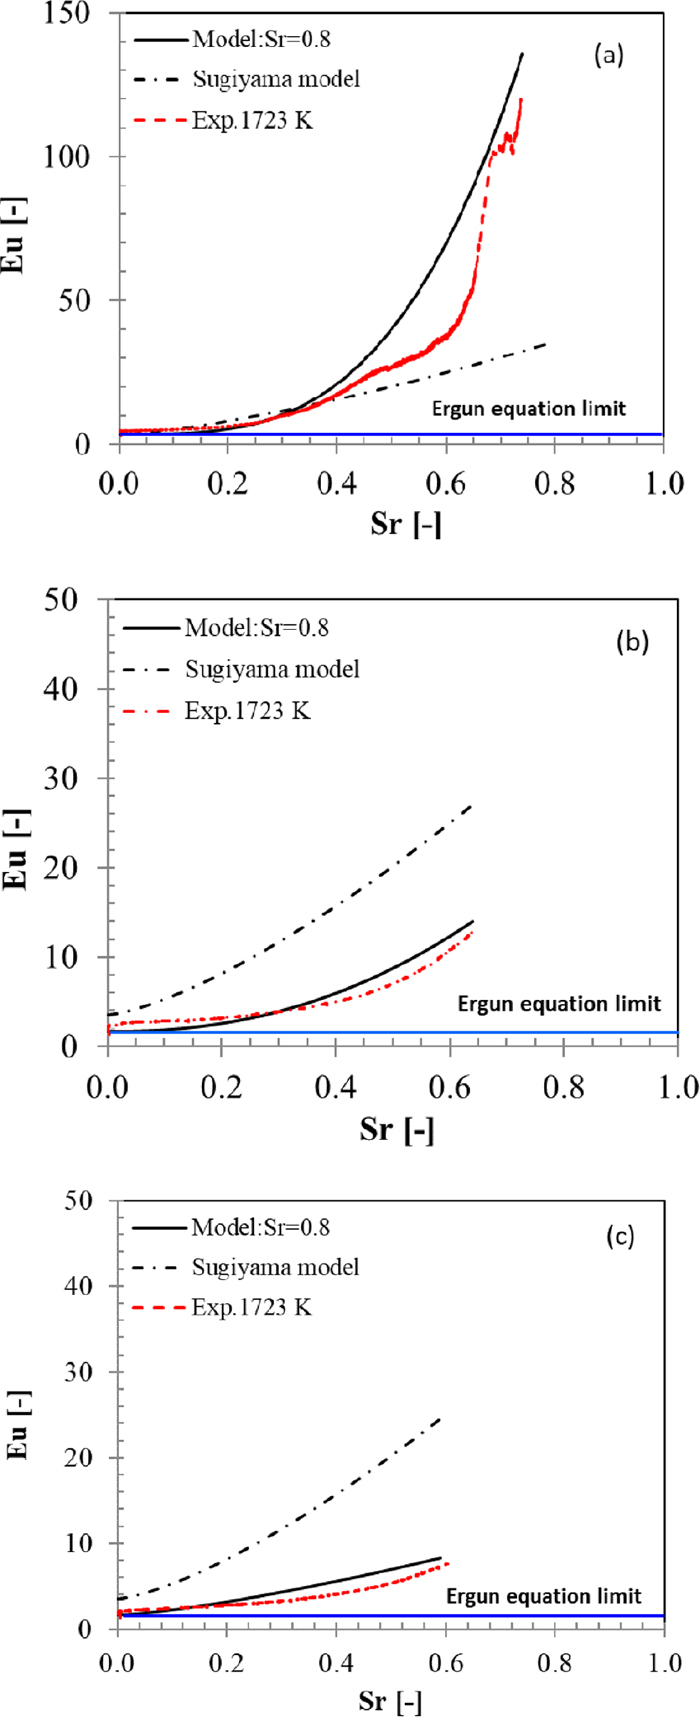
It is apparent that the bed pressure drop characteristics are significantly influenced by the bed shrinkage ratio. In all three cases, the non-dimensional form of the Ergun equation, Eq. (1), which is represented by a blue solid line, shows an equivalent friction factor for constant bed porosity. Clearly, Eq. (1) is not able to predict the bed pressure drop beyond a threshold bed shrinkage ratio (Sr≤0.04). Hence, its predictive capability is strictly limited within regime R1 (Fig. 2) with more uncertainty in the higher bed shrinkage regime. Conversely, Eq. (18) provides a reasonable agreement with the experimental data yielding an average normalised deviation (NMRSD) of ~13%, 7% and 10% for NBLL, sinter and mixed burden, respectively.
From the reported pressure profiles, it can be concluded that the friction factor in a fused bed is strongly dependent on the ore type. For example, pressure drop in the NBLL burden is more sensitive to bed shrinkage ratio compared with the sinter and mixed burden. For example, at Sr=0.4, Eulump ~ 20, Eusinter ~ 5, EuMB ~ 4. Sugiyama’s (1980)16) friction parameter is shown to under-predict bed pressure drop for NBLL and over-predict pressure drop for sinter and mixed burden. This is attributed to the fact that effect of particle diameter, bed length, sphericity and bed porosity are treated separately in Sugiyama’s fused bed model (Eq. (2)) and not lumped into the friction factor expression as is the case for Eq. (18).
It can be noted that Eq. (18) contains ore specific parameters (Table 4) as opposed to Sugiyama’s generic friction factor parameters (fErgun=3.5, n1=44, n2=1.4). Unlike Sugiyama’s fused bed friction parameters, which were determined based on a very limited set of data points (only eight) involving both pellet and sinter as the test material, the proposed friction factor model in this study involved large continuous datasets, and therefore could be expected to be a better representative of cohesive zone flow dynamics in a BF involving use of similar types of ferrous burdens.
6. Conclusion
This study aimed at analysing bed pressure drop (indicator of bed permeability) for different ferrous burdens, in a typical softening and melting (SM) test configuration accounting for variation in the bed porosity resulting from structural changes due to exposure to combined external load, high operating temperature and reducing conditions. State-of-the-art techniques involving high resolution micro-computed tomography and neutron scanning were applied to evaluate the bed porosity parameter. Available modelling approaches were assessed and new modelling approaches for bed porosity variation were proposed. The key findings of this study are summarised below:
(1) All Ergun type pressure drop models indicate divergence at higher operating temperature due to an unavoidable singularity in the bed porosity profile if it was determined directly from the SM test bed contraction data.
(2) The observed pressure drop divergence was eliminated at least within the operating temperature range using a growth-decay type porosity-temperature variation model. The proposed model was capable of predicting porosity variation over a wider range of bed shrinkage ratio (Sr ≤ 0.7). Incorporated in the Ergun equation, the model was shown to predict the bed pressure-drop reasonably well (NRMSD: ~10 to 26%).
(3) Based only on the bed contraction and pressure drop data obtained directly from the SM tests, an ore specific empirical friction factor model applicable for a wider range of bed shrinkage ratios (Sr ≤ 0.8) was developed. This formulation excluded the use of system specific parameters namely particle diameter, sphericity and bed porosity which are difficult to estimate in a fused bed system. The proposed fused bed friction factor model provided reasonable predictions for three types of ferrous burdens when compared with independent experimental data involving normalised deviation (NRMSD) in the range from ~7 to 13%.
(4) The temperature dependent porosity, shrinkage ratio, and pressure drop were very similar for the lump-sinter mixed burden (MB) and a 100% sinter burden, demonstrating the good performance of a 21% NBLL lump and 79% basic sinter mixed burden.
Acknowledgement
The authors gratefully acknowledge the funding of the Australian Research Council in supporting the ARC Research Hub for Advanced Technologies for Australian Ferrous burden at the Newcastle Institute for Energy and Resources and industrial partner BHP for their financial support and permission to publish this paper. Authors would also like to acknowledge the assistance provided by Dr. Anton Maksimenko at IMBL, Australian Synchrotron, Melbourne for tomography; Dr. Floriana Salvemini for assisting with the neutron scanning at DINGO, ANSTO, Sydney; and Dr. Belinda Godel from CSIRO for image processing.
Nomenclature
a: constant term in fused bed frictional factor used in (Eq. (2)) [–]
b1: coefficient of shrinkage term in friction factor used in (Eq. (2)) [–]
b2: exponent of shrinkage term in friction factor used in (Eq. (2)) [–]
B1: coefficient of T* in (Eq. (13)) [–]
B2: exponent of T* in (Eq. (13)) [–]
C: orifice coefficient [–]
d: diameter [m]
Eu: Euler number [–]
f: friction factor [–]
g: gravitational acceleration [m·s−2]
H1: equivalent height of inter-particle porosity in Fe layer [m]
H2: equivalent height of intra-particle porosity in Fe particles [m]
H3: equivalent height of particles in Fe layer [m]
HFe: height of Fe layer [m]
Hc: height of Fe layer after contraction [m]
L: bed height [m]
L0: initial bed height [m]
m: fractional opening area [–]
n1: constant in Eq. (24) [–]
n2: constant in Eq. (2) [–]
P: pressure [Pa]
Q: volumetric flow rate [m3·s−1]
Sr: bed shrinkage ratio [–]
T: temperature [K]
U: velocity [m·s−1]
V: volume [m3]
Subscripts
g: gas
i: ith component
inter: inter-particle
intra: intra-particle
l: liquid
p: particle
s: solid
Greek letters
α: empirical correction factor to porosity in Eq. (3) [–]
γ: particle diameter ratio in Eq. (3) [–]
φ: sphericity [–]
ε: porosity [–]
ρ: density [kg·m−3]
μ: viscosity [Pa·s]
References
- 1) P. F. Nogueira and R. J. Fruehan: Metall. Mater. Trans. B, 35 (2004), 829.
- 2) I. F. Kurunov: Metallurgist, 54 (2010), Issue 5–6, 335.
- 3) C. E. Loo, L. T. Matthews and D. P. O′Dea: ISIJ Int., 51 (2011), No. 6, 930.
- 4) S. J. Chew, P. Zulli, D. Maldonado and A. Yu: ISIJ Int., 43 (2003), No. 3, 304.
- 5) K. Ichikawa, Y. Kashihara, N. Oyama, T. Hirosawa, J. Ishii, M. Sato and H. Matsuno: ISIJ Int., 57 (2017), No. 2, 254.
- 6) M. Baniasadi, B. Peters, J.-C. Pierret, B. Vanderheyden and O. Ansseau: Powder Technol., 339 (2018), 863.
- 7) W. J. Yang, Z. Y. Zhou, A. B. Yu and D. Pinson: Powder Technol., 279 (2015), 134.
- 8) X. F. Dong, A. B. Yu, S. J. Chew and P. Zulli: Metall. Mater. Trans. B, 41 (2010), 330.
- 9) H. Kurosawa, S. Matsuhashi, S. Natsui, T. Kon, S. Ueda, R. Inoue and T. Ariyama: ISIJ Int., 52 (2012), No. 6, 1010.
- 10) X. Dong, A. Yu, J. Yagi and P. Zulli: ISIJ Int., 47 (2007), No. 11, 1553.
- 11) T. Ariyama, S. Natsui, T. Kon, S. Ueda, S. Kikuchi and H. Nogami: ISIJ Int., 54 (2014), No. 7, 1457.
- 12) X. Liu, T. Honeyands, G. Evans, P. Zulli and D. O′Dea: Ironmaking Steelmaking, 46 (2019), No. 10, 953.
- 13) P. F. Nogueira and R. J. Fruehan: Metall. Mater. Trans. B, 36 (2005), 583.
- 14) P. F. Nogueira and R. J. Fruehan: Metall. Mater. Trans. B, 37 (2006), 551.
- 15) S. Ergun: Chem. Eng. Prog., 48 (1952), No. 2, 89.
- 16) T. Sugiyama, H. Sato, M. Nakamura and Y. Hara: Tetsu-to-Hagane, 66 (1980), No. 13, 1908 (in Japanese).
- 17) K. Ichikawa, J. Ishii, S. Watakabe and M. Sato: ISIJ Int., 55 (2015), No. 3, 544.
- 18) S. Mitra, X. Liu, T. Honeyands, G. Evans and D. O’Dea: Proc. 3rd Int. Conf. on Science and Technology of Ironmaking & Steelmaking, Dept. of Materials Science and Engineering, Indian Institute of Technology, Kanpur, (2017), 207.
- 19) X. Liu, T. Honeyands, S. Mitra, G. Evans, B. Godel, R. G. Acres, F. Salvemini, D. O’Dea and B. Ellis: ISIJ Int., 58 (2018), No. 11, 2150.
- 20) P. R. Dawson: SEAISI Q. J., 16 (1987), 23.
- 21) L. Kempton: Ph.D. thesis, Faculty of Science, School of Materials Science & Engineering, UNSW, Australia, (2014), Chapter 6, 249, http://handle.unsw.edu.au/1959.4/54019, (accessed 2017-07-18).
- 22) X.-w. An, J.-s. Wang, R.-z. Lan, Y.-h. Han and Q.-g. Xue: J. Iron Steel Res. Int., 20 (2013), Issue 5, 11.
- 23) T. Bakker and R. H. Heerema: ICSTI – 2nd Int. Cong. on the Science and Technology of Ironmaking and 57th Ironmaking Conf. Proc., Iron and Steel Society, Toronto, (1998), 1597.
- 24) C. E. Loo, G. Penny, L. T. Matthews and B. Ellis: 10th Annual Meeting of China Iron and Steel and the 6th Bao Steel Biennial Academic Conf. Summary Proc., Metallurgical Industry Press, Shanghai, (2015).