Abstract
In order to clear shrinkage behavior of sinter during softening process, the effects of load and reducing gas condition on the shrinkage rate of sinter packed bed has been investigated using an experimental apparatus for measuring high temperature properties under load. As a result, the shrinkage rate increased with increasing the load impressed to the packed bed in temperature range from 1270 to 1440 K, and decreased with increasing the reduction degree of sinter in temperature range from 1470 to 1570 K. The results indicate that the mechanism of shrinkage was different depending on temperature.
In this study, the shrinkage rate of sinter was formulated by dividing into two temperature regions. In the region I, the shrinkage rate increased in proportional to the impressed load, and increased in inversely proportional to the apparent softening viscosity. In the region II, the shrinkage rate increased in proportion to the generation rate of melt, and decreased with increasing the volume fraction of metallic iron in the packed bed. The shrinkage in region II was suppressed with increasing the reduction degree of sinter since the generation rate of melt decreased and the volume fraction of metallic iron increased. The shrinkage rate of each region was expressed as functions of initial composition of sinter, load, temperature, and reduction degree. The calculated values were in good agreement with the experimental ones.
1. Introduction
In blast furnace, ore charged from the top of furnace is heated up, reduced, and dripped on the hearth finally. During the process which the ore changes from solid to liquid phase, gas permeability of the ore layer falls remarkably since a cohesive layer is formed.1) In the blast furnace, the area where cohesive layers and coke layers are alternately laminated is generally called a cohesive zone. The coke layer between the cohesive layers is called the coke slit. The cohesive zone has a large pressure drop since gas hardly flows into the cohesive layer and drifts to the coke slit. Local and large pressure drop not only obstructs the gas flow in the furnace, but also hinders the heating and reduction of the ore and adversely affects the burden descent. Therefore, reducing pressure drop in the cohesive zone is essential for stable operation of the blast furnace.
In order to reduce the pressure drop of the cohesive layers, promotion of the reduction reaction is effective. Ono et al.2) and Kawashiri et al.3) conducted a softening and melting under load test using sinters with different pre-reduction degrees, and reported that the shrinkage of ore layer was suppressed and the pressure drop was reduced with increasing the pre-reduction degree. Nishimura et al.4) reported that the pressure drop increased from the upper part of ore layer where was a low reduction degree owing to the generation of melt mainly composed of wustite. However, no quantitative evaluation has been reported on the effect of reducing pressure drop by promoting reduction reaction.
Several investigations have been carried out to estimate the pressure drop of the ore layer during the softening and melting process.2,5,6,7) Ono et al. examined the relationship between the index of gas permeability resistance determined by the physical properties of the ore and the shrinkage of ore layer.2) Sugiyama et al. estimated gas permeability of softening ore layer based on Ergun formula. They expressed the effect of softening as a function of shrinkage degree of ore layer.6) Ichikawa et al. formulated the effect of hold-up of the liquid phase produced during the softening and melting process on the pressure drop.7) In these estimation formulas, the pressure drop was expressed as a function of shrinkage degree of the ore layer. In order to apply these formulas, it is necessary to know the shrinkage degree of the ore.
The apparent softening viscosity is one of the estimation formulas for the shrinkage rate of the ore layer during the softening and melting process. Nakamura et al. defined the apparent softening viscosity by focusing on the rate of plastic deformation of the ore, and evaluated the effects of the type and composition of the raw materials.8) The softening viscosity was often handled as an evaluation index of ore raw materials,9,10) and there was little knowledge in terms of estimating the shrinkage rate of ore layer. On the other hand, Iwanaga et al. tried to estimate the shrinkage behavior by treating the sinter as a composite of mineral textures (hematite, magnetite, wustite, metallic iron, and slag) with different softening viscosities.11) Although the calculated values were in good agreement with the measured values in the softening and melting test, the mechanism of shrinkage has not been fully understood.
Therefore, the purpose of this study is to elucidate the dominant factor of shrinkage of sinter in the softening process. The effects of the load impressed to the packed bed and the reducing gas conditions on the shrinkage rate were examined by the softening and melting test. Furthermore, the softening process of sinter was divided into two temperature regions, and the effects of apparent softening viscosity and the generation behavior of melt and metallic iron on the shrinkage rate in each region were formulated.
2. Experimental Method
Figure 1 shows the experimental apparatus for measuring high temperature properties under load. A guide tube and a graphite crucible in which coke and sinter were charged were installed inside the upper and lower graphite heaters and the reaction tube. A reducing gas was flowed from the lower part to the packed bed under a predetermined load and temperature. As the temperature rose and the reduction proceeded, the sinter softened, melted and finally dripped. This test can evaluate high temperature reducibility, softening/melting characteristics and the gas permeability of packed bed.12,13) The reduction degree was calculated from the introduced and exhausts gas composition. The change in height of packed bed was measured with a displacement meter, and the shrinkage degree of ore layer was calculated assuming that there was no change in the height of coke layer during the test.

In this study, the effect of reducing gas conditions, height of sinter layer, and load on the packed bed on the shrinkage rate of the sinter layer during the softening process was evaluated by the softening and melting test. Coke and sinter used in the experiment were 15–20 mm and 10–15 mm in size. Chemical composition of the sinter was T.Fe = 57.73 mass%, FeO = 6.65 mass%, CaO = 9.86 mass%, SiO2 = 5.08 mass%, Al2O3 = 1.73 mass%, MgO = 0.87 mass%. These coke and sinter were charged into the crucible having 72 mm in diameter. The layer height of bottom coke, upper coke, and sinter were 60 mm, 15 mm, and 90 or 180 mm, respectively.
Figure 2 shows the changes in sample temperature with time. Based on the temperature distribution measured in an actual blast furnace using a vertical sonde, the heating rate was 0.056 K/s for 473 to 773 K, 0.044 K/s for 773 to 1173 K, and 0.077 K/s for 1173 to 1873 K for all experiments. When the sample temperature reached 1873 K, the reducing gas was switched to N2 gas, heating was stopped, and the sample was cooled in the furnace. The sinter used for these experiments began to drip at 1770 K to 1820 K regardless of the experimental conditions described below.
The loads on the samples were 36 kPa below 1223 K in all experiments as shown in Fig. 3. In order to evaluate the effect of the load on the shrinkage behavior of sinter, the loads above 1223 K were set as 9.8, 23, 36, 48, 74.5, and 98 kPa, respectively.
Figure 4 shows the changes in gas composition with temperature. Although the CO and H2 compositions differed under each condition, the temperature dependence of the CO/CO2 ratio and the total gas flow rate (0.03 Nm3/min) were the same. The height of sinter layer was 90 mm in condition A, and 180 mm in conditions B to D. In conditions A and B, the volume of CO supplied per mass of sinter were the same. The temperature dependence of CO, CO2, and H2 composition in conditions B to D was set by simulating the conditions in an actual blast furnace. Since the steam cannot be flowed in this furnace, the flow rate of N2 was increased by the estimated flow rate of steam. Table 1 shows a list of experimental conditions.

Table 1. Summary of experimental conditions.
| Case | Composition of reducing gas
(Max. concentration of CO/
Min. concentration of H2) | Initial layer thickness of sinter (mm) | Load above 1223 K (kPa) |
|---|
| A-90-9.8 | A (23 vol%/0 vol%) | 90 | 9.8 |
| A-90-23 | A (23 vol%/0 vol%) | 90 | 23.0 |
| A-90-36 | A (23 vol%/0 vol%) | 90 | 36.0 |
| A-90-49 | A (23 vol%/0 vol%) | 90 | 49.0 |
| A-90-98 | A (23 vol%/0 vol%) | 90 | 98.0 |
| B-180-9.8 | B (46 vol%/0 vol%) | 180 | 9.8 |
| B-180-23 | B (46 vol%/0 vol%) | 180 | 23.0 |
| B-180-36 | B (46 vol%/0 vol%) | 180 | 36.0 |
| B-180-49 | B (46 vol%/0 vol%) | 180 | 49.0 |
| B-180-75 | B (46 vol%/0 vol%) | 180 | 74.5 |
| B-180-98 | B (46 vol%/0 vol%) | 180 | 98.0 |
| C-180-36 | C (41 vol%/10 vol%) | 180 | 36.0 |
| C-180-98 | C (41 vol%/10 vol%) | 180 | 98.0 |
| D-180-36 | D (39 vol%/15 vol%) | 180 | 36.0 |
| D-180-98 | D (39 vol%/15 vol%) | 180 | 98.0 |
3. Results and Discussion
3.1. Shrinkage Rate of Sinter during Softening Process
Figure 5 shows the effect of the load impressed to the packed bed on the shrinkage rate during the softening process under reducing gas condition B and the layer height of 180 mm. In the temperature range from 1270 to 1470 K, the shrinkage rate increased with increasing the load. On the other hand, in the temperature range from 1520 to 1570 K, the shrinkage rate tended to decrease with increasing the load. There was no correlation between the load and the temperature dependence of the reduction degree.

Figure 6 shows the effect of gas conditions on the reduction degree of sinter with the maximum load of 98 kPa. For A-90-98 and B-180-98, the experiments were carried out with the same volume of CO gas supplied per mass of sinter. As a result, under the condition of B-180-98, the reduction degree was higher than that of A-90-98 due to the high partial pressure of CO in the reducing gas and the large driving force of the reduction reaction. Under the conditions of C-180-98 (maximum H2 concentration of 10 vol%) and D-180-98 (maximum H2 concentration of 15 vol%), the reduction degree was significantly increased. This result indicates that the reaction rate of H2 reduction was higher than that of CO reduction.

Figure 7 shows the changes in the shrinkage rate with temperature under the same conditions as shown in Fig. 6. In the temperature range from 1270 to 1440 K where the shrinkage rate increased rapidly, the shrinkage rate did not depend on the gas conditions or the reduction degree. In contrast, between 1470 and 1570 K, the shrinkage rate tended to decrease with increasing the reduction degree. The reasons for the suppression of shrinkage due to the reduction promotion have been pointed out as follows: (1) suppression of generation of melt containing FeO4) and (2) improvement of softening resistance by the generated metallic iron.11,14)
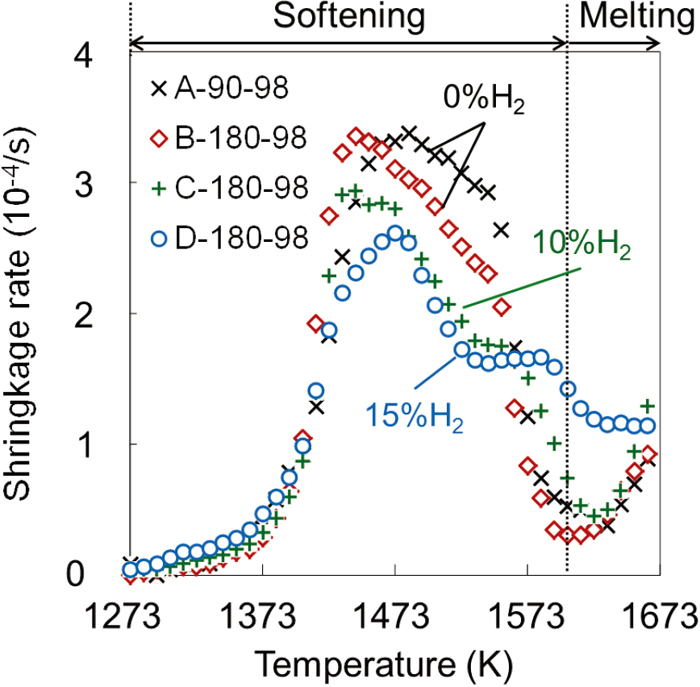
These results suggest that the mechanism of shrinkage was different between the low temperature range below 1440 K and the high temperature range above 1470 K. Therefore, in this study, the softening process of sinter was divided into two temperature regions (regions I and II) with the maximum value of the shrinkage rate as a boundary (see Fig. 8). The inflection point in region II was attributed to smelting reduction, and the mechanism of shrinkage did not change before and after the inflection point.
3.2. Formulation of Shrinkage Rate in Region I
In region I where the shrinkage rate increased rapidly, it was assumed that the apparent softening viscosity8) shown in Eq. (1) was applicable because there was a correlation between the load and the shrinkage rate. The temperature dependence of the apparent softening viscosity η was expressed by Eq. (2).
where
dSr/
dt,
W,
η,
T,
η0, and
c1 denoted shrinking rate [1/s], load [Pa], softening viscosity [Pa·s], temperature [K], parameter [Pa·s], and parameter [K], respectively. These equations mean that the shrinkage rate is proportional to the load impressed to the packed bed, and inversely proportional to the apparent softening viscosity, in other words, the shrinkage resistance of the ore.
Equation (3) was calculated from
Eqs. (1) and
(2).
|
lnη=lnW-ln
dSr
dt
=
c
1
T
+ln
η
0
| (3) |
Figure 9 shows the relationship between ln η and 1/T in the temperature range from 1270 to 1440 K (corresponding to region I). In Region I, the relationship between the two was approximated by a straight line. η0 and c1 were obtained from the intercept and the slope of the straight line. It is assumed that the parameters of η0 and c1 are values specific to ore, and determined by strength, pore structure, chemical composition.
3.3. Formulation of Shrinkage Rate in Region II
As shown in Figs. 6 and 7, the shrinkage rate in region II tended to decrease with increasing the reduction degree. From these results, the generation of melt and metallic iron were focused in order to formulate the shrinkage rate in region II.
First, the generation rate of melt and the shrinkage rate in the softening process of sinter were compared. The effects of temperature and the reduction degree on the generation of melt were estimated by thermodynamic equilibrium calculation. Assuming that the presence of iron is only Fe and FeO at temperatures higher than the temperature at which melt start to generate (1493 K), the mass ratio of Fe and FeO was obtained from the reduction degree. The mass ratio of CaO, SiO2, Al2O3, and MgO was 9.86, 5.08, 1.73, and 0.87, respectively. Based on the mass ratio of FeO, CaO, SiO2, Al2O3, and MgO, the effects of temperature and reduction degree on the generation of melt were evaluated by the thermodynamic equilibrium calculation using general-purpose software.15) Figure 10 shows the effect of temperature and reduction degree on the mass ratio of melt to the initial sinter. The melt was generated from around 1493 K regardless of the reduction degree. In addition, the mass of melt generated decreased with increasing the reduction degree. The volume of melt was obtained dividing the mass of melt by the density (2490 + 12[mass%-FeO] kg/m3),16) and was approximated by Eq. (4):
|
V
liq
=
c
2
T-
c
3
R+
c
4
| (4) |
where
Vliq,
R,
c2,
c3, and
c4 denoted volume of melt per 1 kg of sinter [m
3/kg], reduction degree [-], parameter [m
3/(kg·K)], parameter [m
3/kg], and parameter [m
3/kg], respectively. The parameters of
c2–
c4 in the
Eq. (4) vary depending on the chemical composition of ore. The volume of melt calculated by
Eq. (4) was differentiated by time, and the generation rate of melt was obtained by multiplying that by the mass of the sinter.
Figure 11 shows a comparison between the generation rate of melt and the shrinkage rate. After the start of melt generation (1493 K –), changes in the shrinkage rate showed a similar trend as that in the generation rate of melt. The result indicates that the shrinkage rate increased in proportion to the generation rate of melt in the region II as shown in
Eq. (5).
|
dSr
dt
=β
M
SP
V
0.SP
d
V
liq
dt
| (5) |
where
MSP,
V0.SP, and
dVliq/
dt denoted mass of sinter [kg], volume of sinter before shrinkage [m
3], and generation rate of melt [m
3/(kg·s)], respectively. The right side of
Eq. (5) shows the ratio of the volume of the sinter layer before shrinkage and the volume of the melt generated per unit time. The generation rate of melt and the shrinkage rate decreased rapidly at around 1570 K. A rapid increase in the reduction degree due to smelting reduction was confirmed at the corresponding temperature. Since the smelting reduction is a large endothermic reaction, the heating rate of the sample temporarily decreased. The generation rate of melt could be decreased by the increase in the reduction degree and the decrease in the heating rate. As a result, the shrinkage rate was decreased at around 1570 K.

The coefficient β in Eq. (5) was defined as the ratio between the shrinkage rate and the generation rate of melt. When β = 1, it means that the volume of the generated melt is equal to the decrease in the volume of the sinter layer due to shrinkage. The β changes depending on the shrinkage resistance of the packed bed. Therefore, assuming that the generated metallic iron has softening resistance that suppresses shrinkage of the packed bed, the relationship between the volume fraction of metallic iron in the packed bed and the β was evaluated. Figure 12 shows the relationship between the volume fraction of metallic iron XFe and β in region II. XFe was determined by Eq. (6). The change in β in the XFe range of 0.05 to 0.20 can be approximated by a descending straight line. When β was expressed by a linear expression related to XFe, the Eq. (7) was obtained.
|
X
Fe
=
V
Fe
V
0.SP
(1-Sr)
| (6) |
where
XFe,
VFe,
Sr, and
c5–
c6 denoted volume fraction of metallic iron in the packed bed [-], volume of metallic iron [m
3], shrinkage degree [-], and parameters [-]. The parameters of
c5 and
c6 were obtained from the slope and the intercept of the straight line.
VFe was the ratio of the mass and density of metallic iron (7600 kg/m
3). The mass of metallic iron was estimated from the reduction degree, assuming that the presence of iron was Fe or FeO. The parameters of
c5 and
c6 vary depending on the properties of ore such as strength, pore structure, and chemical composition.
The shrinkage rate in region II was proportional to the generation rate of melt and decreased with increasing the volume fraction of metallic iron in the packed bed. The shrinkage of sinter layer was suppressed with increasing the reduction rate and the reduction degree since the generation rate of melt decreased and the volume fraction of metallic iron increased. On the other hand, when the volume of metallic iron is constant, the shrinkage rate in region II could decrease with increasing the shrinkage degree since the volume fraction of metallic iron in the packed bed increases.
3.4. Comparison between Calculated and Experimental Values
Figure 13 shows the changes in the shrinkage rate with temperature during softening process. The plot in the figure shows the experimental values obtained from the softening and melting test, and the solid line shows the calculated values. Although there was a slight divergence in region I of B-180-36, the calculated values were in good agreement with the experimental ones.
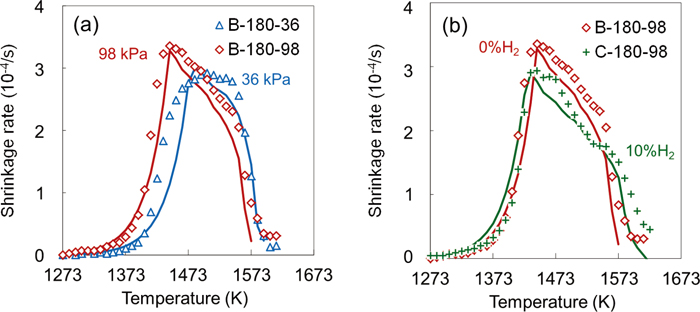
Figure 13(a) shows the effect of the load impressed to the packed bed on the shrinkage rate. In region I, the shrinkage rate increased with increasing the load. In contrast, above 1470 K, the shrinkage rate was higher when the load was low. There was no significant difference in the reduction degree between B-180-36 and B-180-98 since the heating and the reducing gas conditions were the same. Therefore, the effect of the shrinkage behavior in the softening process on the reduction degree can be neglected. The difference in the shrinkage rate in the region II was due to the shrinkage degree before reaching at the temperature of 1470 K. As described above, the shrinkage rate in region II decreased with increasing the shrinkage degree owing to the increase in the volume fraction of metallic iron. Since B-180-36 showed low shrinkage rate and degree in region I, it was considered that the shrinkage rate increased conversely in region II.
Figure 13(b) shows the effect of reducing gas conditions on the shrinkage rate. In region I, the shrinkage rate did not depend on the reducing gas conditions. As shown in Fig. 6, although the absolute value of the reduction rate of C-180-98 was higher than that of B-180-98 in the temperature range of 1490 K to 1570 K, there is no difference in the slope of the change in the reduction degree. Therefore, it is conjectured that the shrinkage rate of C-180-98 between 1490 K and 1570 K decreased mainly due to the increase in the volume fraction of metallic iron. On the other hand, the shrinkage rate of B-180-98 decreased rapidly at 1570 K, which was attributed to the smelting reduction. The smelting reduction increased the reduction rate of sinter, decreased the generation rate of melt, and suppressed the shrinkage. In region II, the volume fraction of metallic iron in the packed bed has a large effect on the shrinkage rate in the temperature range below the inflection point near 1570 K. In contrast, in temperatures above the inflection point, the effect of the generation rate of melt on the shrinkage rate was remarkable.
Figure 14 shows the changes in the shrinkage degree of sinter during the softening process. The dotted line in the figure shows the experimental value obtained by the softening and melting test, and the solid line shows the calculated value. The calculated value of the shrinkage degree was obtained by integrating the shrinkage rate. As the load impressed to the packed bed increased, the shrinkage degree decreased. In addition, under the experimental conditions that promote the reduction of sinter, the shrinkage was suppressed in the temperature range above 1470 K. The proposed formula in this study can express these shrinkage behaviors well. As described above, the conventional formula to estimate the pressure drop during the softening process has been reported as a function of the shrinkage degree. Therefore, the combination of these formulas with the proposed formula allows us to evaluate the changes in pressure drop during the softening process.

In this study, the reduction degree of the ore layer was calculated based on the exhaust gas analysis, and the average shrinkage rate of the ore layer was estimated using the average reduction degree of the ore layer. However, as reported by Nishimura et al.,4) there was a distribution of reduction degree in the ore layer, and the shrinkage progressed from the upper layer where the reduction degree was low. Therefore, in order to evaluate the shrinkage behavior in the softening process more precisely, it is necessary to estimate the shrinkage distribution in the height direction considering the distribution of the reduction degree in the ore layer. Furthermore, the volume fraction of metallic iron in the packed bed was focused, and the effect of existence form of metallic iron in the sinter particles was not considered. For example, in the case of pellets, the effect of existence form of metallic iron may not be negligible since topochemical reaction proceeds.
4. Conclusions
In this study, the softening process of sinter was divided into two temperature regions I and II with the maximum value of the shrinkage rate as the boundary. The shrinkage rate dSr/dt in each region was formulated as a function of the initial composition of sinter, the load W, the temperature T, and the reduction degree R. It is assumed that the parameters of η0 and c1–c6 are values specific to ore, and determined by strength, pore structure, chemical composition.
(1) Region I
In region I, which is a low temperature region, the apparent softening viscosity was able to be applied. The shrinkage rate was proportional to the load W impressed to the packed bed and inversely proportional to the apparent softening viscosity η.8)
(2) Region II
|
dSr
dt
=β
M
SP
V
0.SP
d
V
liq
dt
|
|
V
liq
=
c
2
T-
c
3
R+
c
4
|
|
X
Fe
=
V
Fe
V
0.SP
(1-Sr)
|
The shrinkage rate dSr/dt in region II, which is a high temperature region, was proportional to the generation rate of melt dVliq/dt. The coefficient β decreased with increasing the volume fraction of metallic iron XFe in the packed bed. With increasing the reduction degree R, the shrinkage was suppressed since the generation rate of melt decreased and the volume fraction of metallic iron increased. In region II, the generation behaviors of melt and metallic iron were the dominant factors for determining the shrinkage rate.
References
- 1) M. Sasaki, K. Ono, A. Suzuki, Y. Okuno, K. Yoshizawa and T. Nakamura: Tetsu-to-Hagané, 62 (1976), 559 (in Japanese).
- 2) K. Ono, Y. Hida, A. Shigemi and K. Kodama: Tetsu-to-Hagané, 61 (1975), 777 (in Japanese).
- 3) Y. Kawashiri, T. Nouchi and H. Matsuno: Tetsu-to-Hagané, 104 (2018), 467 (in Japanese).
- 4) T. Nishimura, K. Higuchi, K. Ohno and K. Kunitomo: Tetsu-to-Hagané, 102 (2016), 61 (in Japanese).
- 5) K. Takatani and Y. Iwanaga: Tetsu-to-Hagané, 73 (1987), 980 (in Japanese).
- 6) T. Sugiyama, H. Sato, M. Nakamura and Y. Hara: Tetsu-to-Hagané, 66 (1980), 1908 (in Japanese).
- 7) K. Ichikawa, J. Ishii, S. Watakabe and M. Sato: Tetsu-to-Hagané, 100 (2014), 270 (in Japanese).
- 8) M. Nakamura, Y. Seki and S. Kondo: Tetsu-to-Hagané, 56 (1970), 1456 (in Japanese).
- 9) T. Nishimura, K. Higuchi, M. Naito and K. Kunitomo: ISIJ Int., 51 (2011), 1316.
- 10) K. Sunahara, T. Natsui, K. Shizawa and Y. Ujisawa: Tetsu-to-Hagané, 98 (2012), 331 (in Japanese).
- 11) Y. Iwanaga: Tetsu-to-Hagané, 68 (1982), 2223 (in Japanese).
- 12) K. Mochizuki, T. Murai, Y. Kawaguchi and Y. Iwanaga: Tetsu-to-Hagané, 72 (1986), 1855 (in Japanese).
- 13) Y. Hosotani, K. Yamaguchi, T. Orimoto, K. Higuchi, T. Kawaguchi and H. Goto: Tetsu-to-Hagané, 83 (1997), 97 (in Japanese).
- 14) H. Kokubu, A. Sasaki, S. Taguchi and N. Tsuchiya: Tetsu-to-Hagané, 68 (1982), 2338 (in Japanese).
- 15) C. W. Bale, E. Bélisle, P. Chartrand, S. A. Decterov, G. Eriksson, A. E. Gheribi, K. Hack, I. H. Jung, Y. B. Kang, J. Melançon, A. D. Pelton, S. Petersen, C. Robelin, J. Sangster, P. Spencer and M.-A. Van Ende: Calphad, 54 (2016), 35.
- 16) K. C. Mills and B. J. Keene: Int. Mater. Rev., 32 (1987), No. 1–2, 1.


