Abstract
Reduction test under load is normally applied to evaluate softening and melting behaviour of ferrous burdens at simulated condition in cohesive zone in blast furnace. Outcomes from this test are very complex because they depend on reduction degree, chemical composition, basicity, melts physical property, etc. One of the reasons to make complex this test is sample for the test provided as particle packed bed. In order to comprehend softening and melting behaviour of cohesive zone, focus on behaviour of single particle as a component of particle packed bed in this study. For simplification, a pre-reduced simulant sinter iron ore was prepared as single tablet sample. The samples were made from mixture of reagent oxides and they were pre-reduced to control their reduction degree to several reduction levels. The tablet sample was rapidly heated up to 900°C, and then gradually heated up with 10°C/min under inert gas atmosphere and 0.1 MPa load. Shrinkage degree of the sample was measured during the softening and melting test, and quenched sample was made at certain temperature when the sample shows a characteristic tendency. Cross-sectioning observation of the quenched sample provided mineral phases distribution in the tablet sample. The observation indicated that peripheral structure has a significant effect on deformation resistance. Especially in there, existence of molten slag phase could make easy to deform the sample particle shape, and metallic solid Fe phase helped to strengthen the particle’s deformation resistance.
1. Introduction
In order to realize low carbon operation for blast furnace, proper control of cohesive zone is the most important task to maintain healthy gas flow for stable operation. One of the biggest reasons is gas pressure drop in the cohesive zone due to softening and melting behaviour of iron burdens.1) Reduced iron burdens begin to deform from upper part of the cohesive zone, and they melt into molten iron and slag until bottom of this zone. The deformation and melting cause clogging a gas flow passes in iron burden’s layer, and this severe situation for gas flow makes bigger gas pressure drop values. Especially, Ohno et al.2) indicated that an effective gas path shape in cohesive zone could be a dominant factor for stable gas flow. Natsui et al.3) estimated the gas pass structure using numerical simulation based on Smoothed Particle Hydrodynamics method. Although their result could well reproduce a situation in iron burden’s layer, further improvement with detail information about mineral phase morphology in single iron burden particles is necessary to next step.
The mineral phase morphology is dependent on reduction reaction condition. High reduction degree forms a bigger amount of metallic iron in the iron burden than in case of low reduction degree. This difference should make difference on deformation behavior of the iron burdens. Many tests of iron burden reduction test under load condition4,5,6) were conducted for understanding of the cohesive zone formation mechanism. This method can simultaneously evaluate reduction behaviour and deformation behaviour of iron burden’s layer, and the test can provide practical knowledge of iron burden’s character for blast furnace operation. However, the results from this test are too complex to comprehend the formation mechanism, because it includes many factors from whole part of iron burden hysteresis not only cohesive zone but also upper dry zone in blast furnace. One of the reasons to make complex this test would come from sample shape as particle packed bed. The outcome from the packed bed could be an average value and disappear information of local mineral morphology variation. In order to comprehend effect of mineral morphology in iron burden on softening and melting behaviour of cohesive zone, focus on behaviour of single iron burden particle as a component of particle packed bed in this study.
Sanbongi et al.7) reviewed experimental methods and results in 1960’s of reduction test under load for single particle and packed bed iron burdens and recommend test condition. This report broadly summarized the test condition and they suggested recommending conditions in each test based on reduction test point of view. For example, 20 mm cubic cut from iron burden was recommended for single particle test. Mineral phase morphology in the cut sample should be decided by material’s morphology which kind natural resource was used, and it had a great effect on evaluation of sample softening behavior. To diminish an effect of original mineral morphology, Nakamura et al.8) used reshaped sample from grinded raw material. The reshaped sample can be evaluated directly deformation behavior of sample’s matrix phase. To additionally simplify, Inoue et al.9) used synthesized sample from regent oxide powders. These kinds of simplifications well helped to understand softening behaviors of single particle, which is consisted of uniformed material. However, these tests were included reduction reaction step with gradual heating up condition, their specimens for morphology observation in reduced sample could not be quenched.
Kemppainen et al.10) applied a softening and melting simulator for evaluation of iron ore pellet deformation behavior. The simulator can control sample temperature with rapid heating and quenching over 1000°C/min. This capability can directly focus on the temperature range of sample deformation behavior. Pre-reduced pellet sample was rapidly heated up to 1000°C and then they could be evaluated about deformation behavior under inert atmosphere. Rapid quenched samples also could be provided for morphology observation in softening step.
In this study, the rapid heating and quenching method with the simulator was applied to evaluate deformation behavior of pre-reduced simulant sinter iron ore synthesized from regent oxide powder under inert atmosphere.
2. Experimental Methodology
2.1. Experimental Samples
In order to focus on effect from mineral phase morphology on deformation behavior of single particle sample, 3 kind of samples were prepared as follows. As shown in Table 1, 3 types of reagent oxide mixtures were prepared in different basicities, CaO/SiO2 (mass%/mass%), as simulant iron ore sinter material. 3 g of the mixed powder samples were pressed into tablet shape with 15 mm inner diameter die, and they were sintered at 1270°C for 5 min under air atmosphere.11) The sintered tablet samples, 14 mm diameter and 6 mm height, were treated under reducing gas atmosphere for preparation of pre-reduced samples in 2 levels of different reduction degree. The pre-reduction degree of pellets were prepared to about 30% (low pre-reduction degree) and about 60% (high pre-reduction degree) with CO:CO2:N2 =1:1:2 at 900°C for 60 min and CO:CO2:N2=1:0:1 at 1000°C for 30 min, respectively. Chemical compositions of pre-reduced tablet samples were shown in Table 2.
Table 1. Experimental sample mixing compositions.
| Basicity (–) | Mixing Composition (mass%) |
|---|
| CaO/SiO2 | Fe2O3 | CaO | SiO2 | Al2O3 |
|---|
| 1.5 | 81.6 | 9.9 | 6.6 | 1.8 |
| 2.0 | 11.0 | 5.5 | 1.8 |
| 2.5 | 11.8 | 4.7 | 1.8 |
Table 2. Chemical compositions of pre-reduced experimental samples.
| Reduction degree (%) | Basicity (–) | Chemical compositions (mass%) |
|---|
| Aimed value | Measured value | CaO/SiO2 | T. Fe | M. Fe | FeO | Fe2O3 | CaO | SiO2 | Al2O3 |
|---|
| 30 | 14.9 | 1.50 | 59.1 | 0.5 | 32.3 | 47.9 | 10.4 | 6.9 | 1.9 |
| 60 | 51.0 | 1.49 | 65.9 | 22.5 | 43.0 | 14.3 | 10.9 | 7.3 | 2.0 |
| 30 | 26.3 | 2.00 | 60.6 | 0.4 | 59.9 | 19.4 | 12.2 | 6.1 | 2.1 |
| 60 | 53.7 | 2.03 | 65.1 | 24.5 | 40.2 | 13.3 | 13.2 | 6.5 | 2.3 |
| 30 | 23.7 | 2.51 | 60.8 | 0.6 | 53.3 | 26.8 | 12.3 | 4.9 | 2.1 |
| 60 | 63.9 | 2.50 | 68.2 | 35.4 | 31.6 | 11.8 | 13.5 | 5.4 | 2.3 |
A softening and melting simulator2,10) can achieve to high speed temperature control over 1000°C/min of sample packed bed by combination of infrared gold image furnace heating and dry-quenching chamber. Temperature distribution in a sample chamber, 30 mm inner diameter and 40 mm inner height, was confirmed within ±5°C during radiation of infrared. As measurement devices, the simulator equips a sample thickness displacement sensor builded in a loading device, located top of the simulator.
The single tablet sample was set between alumina blocks and steel sheets and put into the sample chamber as shown in Fig. 1. The blocks and sheets were used to avoid direct reaction of the sample with graphite sample chamber. 20 N load was added onto the sample from a pushing rod above a graphite lid, deformation amount of the sample was measured. This load as calculated as 0.24 MPa is relatively bigger than previous reports4,5,6) with packed bed samples as 0.1 MPa. This condition can be sensitively observed softening behavior of the single tablet sample.
Before experimental measurement, heat expansion of sample chamber and sample holding materials were measured to calibrate effect from it on measurement values. The calibrated values were used for definition of shrinkage degree as shown in Eq. (1).
|
Shrinkage degree(
%
)
=
Displacement length at time t(
mm
)
Maximum Displacement length(
mm
)
×100
| (1) |
The sample was heated up to 900°C with 1000°C/min. After reach to 900°C, a heating rate was changed to 10°C/min. During heating experiment, 0.1 MPa load was added to the sample from top part through the lid and N2 gas was flowed from bottom side with 1 NL/min. Displacement amount of the sample thickness was measured for evaluation of deformation behaviour. From results of deformation behaviour measurement experiment, specific temperatures when sample’s characteristic deformation behaviours were recognized. For detail observation of mineral phase morphology, quenched samples were prepared at the specific temperature with 1000°C/min cooling rate. The quenched samples were provided to optical micrograph observation in the tablet centre cross-section.
3. Results and Discussions
Figures 2 and 3 are shown shrinkage variation curves with raising temperature for low reduction degree and high reduction degree, respectively. Trend of curve can be categorized in 3 stages as follows. Initial stage until 20% shrinkage degree shows initiation and gradual increasing the shrinkage degree. Second stage around 50% shrinkage degree shows the most obvious variation and the fastest shrinkage speed. Last stage around 80% shrinkage degree shows gradual speed down of shrinkage behavior. Dominant difference of each shrinkage behaviors can be found in the second stage. Therefore, the second stage’s behavior was mainly analyzed in this study.
The shrinking speed was defined as an absolute value of shrinkage per unit time, and relationships between pre-reduction degree and shrinkage speed in the second stage of each basicity samples were shown in Fig. 4. From this figure, higher pre-reduction degree and higher basicity samples showed low shrinkage speed.
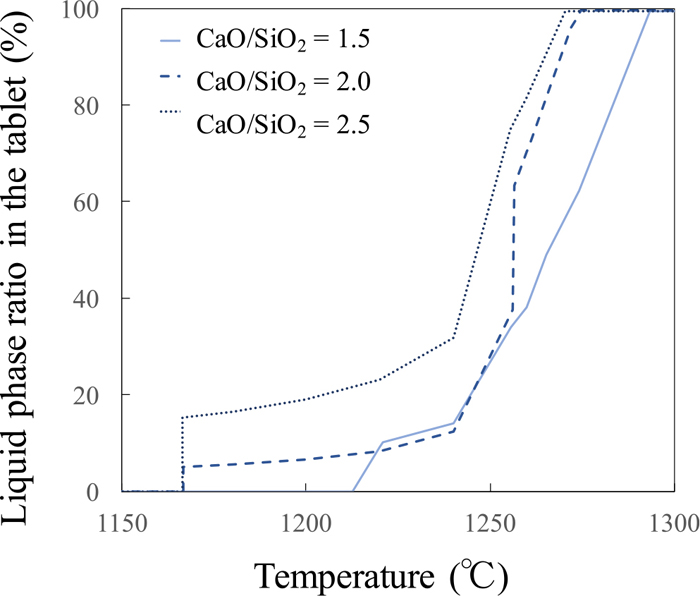
In order to focus on effect of phase transformation on the shrinkage speed, liquid phase formation behaviors in the sample tablets were estimated with thermodynamic equilibrium calculation software, FactSage with FToxid Database, using chemical compositions of the pre-reduced sample tablets from Table 2. Liquid phase ratio in Figs. 5 and 6 were defined with Eq. (2) under following assumptions; metallic Fe phase didn’t melt; any iron oxide didn’t reduce and held as mineral phase. From these figures, higher basicity case obviously shows larger liquid phase ratio at same temperature.
|
Liquid phase ratio in the tablet(
%
)
=Liquid phase ratio in slag phase(
%
)
×
100-M. Fe ratio(
%
)
100
| (2) |
Although final liquid phase ratio is depended on metallic Fe amount at high pre-reduction degree, increasing trend of liquid phase ratio until reaching to final value are same exclude case of basicity 2.5. In case of basicity 2.5, lower reduction degree shows larger amount of liquid phase formation at same temperature. In both figures, higher basicity samples have bigger amounts of liquid phases in the second stage. When it could be thought liquid phase formation could help deformation behavior, this liquid formation behavior is opposite trend against shrinkage speed in Fig. 4. These thermodynamic equilibrium calculation results could show average information of the sample tablet for homogeneous sample. However, the pre-reduced tablet samples should have a mineral phase distribution based on reduction reaction.
Figures 7 and 8 show basicity 2.0 quenched sample’s cross-sectioning observations of low pre-reduction degree and high pre-reduction degree, respectively. For comprehension of softening behavior dominant factor, the samples were prepared with quenching before and after the second stage around 50% shrinkage degree. In case of low pre-reduction degree, it could not be found obvious difference about mineral phase distribution between periphery part and core part before experiment. From this point, the initial sample of low pre-reduction degree could be categorized as homogenous phase sample. With deformation progress, slag phases were fusing each other, and this behavior well observed in peripheral part rather than core part. In case of high pre-reduction degree, reduction reaction was confirmed as topochemical reaction because periphery part’s reduction reaction well progressed than core part before experiment. With deformation progress, metallic Fe phases were well fusion in peripheral part. The mineral phase distribution in quenched samples of other basicity cases were shown same trend. In order to quantify the mineral phase distribution, an imaging analysis was applied on the cross-sectioning observation as follows. An object phase was selected from the original micrograph, and then occupied area ratio of the object phase was estimated through binarization processing as shown in Fig. 9. Quantified results from low pre-reduction degree and high pre-reduction degree are shown in Figs. 10 and 11, respectively. Pore occupied ratio in the observed area is plotted, and mineral phases ratios in other area are shown as a percentage in these figures. From Figs. 10 and 11, pore ratio was decreasing in whole part of the tablet with increasing of shrinkage degree. The decreasing ratio of the pore at the peripheral part was bigger than at the core part. It was thought increasing of slag ratio could made decreasing of pore ratio at the peripheral part due to pushing out of the molten slag generated at the core part to the peripheral part. In order to clarify a deformation mechanism in the second step, the slag ratios at around 20% shrinkage degree as initial stage of the second step were focused because the molten phase formation could help deformation of the tablet samples.

In case of low pre-reduction degree in Fig. 12, slag ratio at the peripheral part shows a negative correlation with the basicity of the sample, though the slag ratios at the core part are almost same values. Although the liquid phase amount trend calculated at Figs. 7 and 8 shows opposite against this trend, the slag formation trend at the peripheral part from morphology observation could be help to explain about the deformation behavior. This trend mismatch about formation phase ratio should indicate an importance of mineral phase distribution consideration for the deformation behavior.

In case of high pre-reduction degree in Fig. 13, slag ratio at the peripheral part shows no correlation with the basicity of the sample, and the slag ratios at the core part are almost same values. Therefore, focus point was change from the slag ratio to the metallic Fe ratio because metallic Fe could not melt in this experimental condition and be a structural material against deformation. From Fig. 14, a negative correlation between metallic Fe ratio and shrinkage degree in initial stage at 1160°C was shown. Although differences among metallic Fe ratio were not big, it can be thought fusing behavior of the metallic phases, as mentioned before, could affect on deformation resistance of the tablet samples.
4. Conclusions
In order to comprehend iron burden’s softening behavior at cohesive zone, the softening simulator with rapid heating and quenching condition was applied to evaluate deformation behavior of the pre-reduced simulant sinter iron ore tablet sample under inert atmosphere. Obtained results are as follows.
(1) Shrinkage behavior could be separated in 3 steps as follows. Initial stage until 20% shrinkage degree shows initiation and gradual increasing the shrinkage degree. Second stage around 50% shrinkage degree shows the most obvious variation and the fastest shrinkage speed. Last stage around 80% shrinkage degree shows gradual speed down of shrinkage behavior. Dominant difference of each shrinkage behaviors can be found in the second stage.
(2) In case of the low pre-reduction degree samples, the smaller basicity samples showed the larger the shrinkage degree in the second stage of shrinking. It was considered to be because the lower the basicity, the higher the ratio of molten slag in the mineral phases could form in the early stage of deformation.
(3) In case of the high pre-reduction sample, the metallic Fe ratio has dominant role for deformation resistance rather than the slag phase ratio because the metallic Fe could not melt in temperature range of this study.
Acknowledgements
Authors express their gratitude to a financial support by Grants-in-Aid for Scientific Research “KAKENHI” (15H04168) and scientific advices from the research group of “Control of Cohesive Phenomena in Blast Furnace to optimize Gas Permeability” established in ISIJ.
References
- 1) M. Hayashi, S. Sukenaga, K. Ohno, S. Ueda, K. Sunahara and N. Saito: Tetsu-to-Hagané, 100 (2014), 211 (in Japanese).
- 2) K. Ohno, Y. Kitamura, S. Sukenaga, S. Natsui, T. Maeda and K. Kunitomo: ISIJ Int., 60 (2020), 1512.
- 3) S. Natsui, K. Ohno, S. Sukenaga, T. Kikuchi and R. O. Suzuki: ISIJ Int., 58 (2018), 282.
- 4) K. Ono, K. Yamaguchi, A. Shigemi, N. Nishida and K. Kanbara: Tetsu-to-Hagané, 65 (1979), 505 (in Japanese).
- 5) K. Mori, R. Hidaka and Y. Kawai: Tetsu-to-Hagané, 66 (1980), 1287 (in Japanese).
- 6) H. Hotta and Y. Yamaoka: Tetsu-to-Hagané, 71 (1985), 807 (in Japanese).
- 7) K. Sanbongi, Y. Omori, M. Asada, H. Adachi and Y. Takahashi: Tetsu-to-Hagané, 54 (1968), S295 (in Japanese).
- 8) M. Nakamura, Y. Seki and S. Kondo: Tetsu-to-Hagané, 56 (1970), 1456 (in Japanese).
- 9) K. Inoue, T. Ikeda, T. Uenaka and M. Kanemoto: Tetsu-to-Hagané, 68 (1982), 2441 (in Japanese).
- 10) A. Kemppainen, K. Ohno, M. Iljana, O. Mattila, T. Paananen, E. Heikkinen, T. Maeda, K. Kunitomo and T. Fabritius: ISIJ Int., 55 (2015), 2039.
- 11) K. Kato, H. Konishi, H. Ono and H. Fujimoto: ISIJ Int., 60 (2020), 1479.