Abstract
Thermal diffusivity of Fe1−xO scale formed on iron sheets have been measured using an electrical-optical hybrid pulse-heating method, which can avoid decomposition of Fe1−xO scale even at elevated temperatures by executing the experiment rapidly. The samples were 50 µm-thick Fe1−xO scale, which had been obtained by oxidation of a 0.5 mm-thick iron coupon at 1123 K in the air followed by sandblasting to remove the outer oxide layers of Fe3O4 and Fe2O3. In the experiment, the sample was heated by a large current pulse supplied to the iron layer of the coupon, and the Fe1−xO scale was indirectly heated up to experimental temperature from room temperature within 0.2 s. The temperature was maintained at the experimental temperature, and the laser flash method was conducted to measure the effective thermal diffusivity of the coupon. The laser irradiation position was adjusted by two ceramics blocks to make the temperature profile better. The effective thermal diffusivity produced the value for Fe1−xO scale based on a three-layered analysis for the Fe1−x O/iron/Fe1−xO structure. Thermal diffusivities of Fe1−xO scale were around 4.8 × 10⁻⁷ m2s−1, and there can be seen no obvious temperature dependence from 600 K to 900 K. X-ray diffraction analysis confirmed that phase transformation did not occur in the Fe1−xO scales during the experiment and x value was calculalted to be 0.09. Non-stoichiometry is supposed to have a significant effect on thermal diffusivity of Fe1−xO scale and its temperature dependence in this research.
1. Introduction
In steelmaking, at the end of the hot rolling process, the hot plate is cooled by water under strict temperature control to produce high-quality steel. The steel plate is easy to be oxidized, and oxide scale with the thickness of several-10 μm exists between the cooling water and the steel plate during the cooling process. Since the thermal conductivity of the oxide scale is smaller than that of steel, oxide scale can be a heat resistance factor for the cooling process. Thus, thermophysical property data of the oxide scale are necessary for the process simulation. The typical oxide scale formed on the steel has a multi-layered structure, usually consists of Fe1−xO, Fe3O4, and Fe2O3, and the thickness ratio of the Fe1−xO/Fe3O4/Fe2O3 layers is approximately 95/4/1 at 1273 K.1) Because Fe1−xO is the main phase of the typical oxide scale formed on the steel plate, the thermal diffusivity of Fe1−xO is primarily required for estimating the thermophysical properties of oxide scale and understanding the effect of the oxide scale in the cooling process of steel plates.
There have been several reports available for thermal diffusivity of iron oxides;2,3,4,5,6,7,8) however, a large discrepancy exists among the reported values. The discrepancies would be due to the difference in microstructures of samples originating from sample preparation methods, i.e., sintering of iron oxide powders2,3) or thermal oxidation of iron sheets.4,5,6,7) The iron oxide samples prepared by the thermal oxidation of iron would have a closer microstructure of oxide scale formed on the steel plate in the actual steelmaking process and more suitable for measurements of thermophysical properties of oxide scale. There are four reports available on the thermal diffusivity for Fe1−xO scales formed on iron sheets;5,6,7,8) reported by Taylor et al.,5) Li et al.6,7) and Yang et al.,8) where all reports applied the laser flash method. However, discrepancies still exist between reported values for Fe1−xO scales because of the decomposition of Fe1−xO into Fe3O4 and Fe during the experiment. Such decomposition of Fe1−xO occurs below 833 K, according to the phase diagram of Fe–O system9) and studies by Tanei et al.10,11) The phase transformation of Fe1−xO increased the measured thermal diffusivity because iron, which is formed by the phase transformation, has thermal diffusivity much greater than that of Fe1−xO. The decomposition of Fe1−xO had affected to values measured by Taylor et al. and Li et al. To derive the thermal diffusivity of Fe1−xO below 833 K, Li et al.6,7) corrected the measured data based on volume ratio of existing phases in the post-experiment samples. After the correction, the values became much smaller. Yang et al.8) applied another heating technique, i.e., the electrical-optical hybrid pulse-heating method because it is difficult to measure the thermal diffusivity of Fe1−xO under normal heating rate. The pulse-heating method can heat the sample rapidly and minimize the duration of high-temperature exposure of the Fe1−xO scale in the thermal diffusivity measurement. The sample used was an iron sheet, where Fe1−xO scales were formed on both the surfaces and the iron layer was heated by current directly and outer Fe1−xO layers were indirectly heated. The measurement was finished within 500 ms, and the Fe1−xO scales were confirmed to keep the phase stable. Finally, thermal diffusivity of Fe1−xO scale was successfully obtained at 932 K. The measured value was between those reported by Taylor et al. and Li et al. However, the temperature dependence of thermal diffusivity of Fe1−xO scale has not been investigated.
Thus, the present work aims to measure the thermal diffusivity of thermally grown Fe1−xO scale formed on iron sheets at different temperatures to determine the temperature dependence of thermal diffusivity of Fe1−xO scale.
2. Experimental
2.1. Sample Preparation
The samples of Fe1−xO scale were prepared from oxidation and sandblasting processes of iron coupons (99.99% Fe) having a size of 0.5 × 4 × 50 mm3 for the measurement using the electrical-optical hybrid pulse-heating method. The oxidation was conducted at 1123 K for 180 s in the air, followed by air cooling. The thickness of the oxide layer formed on each of the 50 × 4 mm2 face of the coupon was estimated to be ca. 70 μm from the thickness change of the coupon before and after the oxidation. The oxide scale formed consisted of all three kinds of iron oxide layers: Fe1−xO, Fe3O4, and Fe2O3.1) The outer Fe2O3 and Fe3O4 layers were removed by sandblasting to leave 40–50 μm-thick Fe1−xO scale only on the both 50 × 4 mm2 faces of the coupon. The 5 mm-length parts on two sides of the coupon were cut off after sandblasting. The Fe1−xO scale was removed around 4-mm length from the ends in the longitudinal direction by 15% HCl solution to form the terminals to connect with the circuit for current supply. An R-type thermocouple was welded at the center of a 40 × 4 mm2 face of the coupon to measure the temperature.8) Nine pieces of coupons were prepared by the method introduced above.
2.2. Thermal Diffusivity Measurement and Analysis
Figure 1 shows the schematic diagram of the electrical-optical hybrid pulse-heating method used in this work, which was almost same as that Yang et al.8) used. The apparatus consisted of an Nd: glass laser generator, a pyrometer, data acquisition, and heating control system and the circuits for heating the sample. Besides, two ceramic blocks were used to adjust the irradiation position of the laser pulse on the coupon, and the R-type thermocouple was used to correct the temperature measured by the pyrometer. Details of the experimental apparatus and schemes for controlling the multi-step experimental sequence have been mentioned elsewhere.8,12) Based on the temperature change due to the laser irradiation, the effective thermal diffusivity of the coupon could be calculated based on the half time analysis.13) In this research thermal diffusivity of the Fe1−xO scale was measured in the temperature range from 600 K to 900 K and one coupon was used for only one measurement at one temperature to prevent phase transformation of Fe1−xO scale.

The conventional laser flash method, which is same as the method applied by Li et al.,7) was also applied for measurements at room temperature in both air and vacuum. Two coupons were prepared from 99.99% Fe sheets having a size of 0.5 × 10 × 10 mm3 by oxidation and sandblast, which way is the same as coupons for the measurements by electrical-optical hybrid pulse-heating method.
The coupons were characterized by X-ray diffraction (XRD) before and after the measurements to identify the phases of the Fe1−xO layers. A secondary electron microscope (SEM) was also applied for the post-experiment coupons to determine the thicknesses of the Fe1−xO scale and the iron layers.
3. Results
3.1. Characterization of Fe1−xO Scales
Figure 2 shows the XRD results of the Fe1−xO scale on the coupon used for the measurement at Tr = 624 K (Tr: corrected temperature) before and after the thermal diffusivity measurement as an example. The analysis was conducted for both the two surfaces: focused on by the pyrometer and irradiated by the laser. Most of the peaks found in each profile belong to Fe1−xO. The XRD profiles also indicate that the Fe1−xO scale is oriented to [200]. The (200) peaks show splits after the measurement shown as the closed square, indicating that the formation of the iron-rich Fe1−xO with a larger lattice constant.14) Such phase change occurred in the cooling process after the thermal diffusivity measurement and should not affect the measurement result. There are several peaks with low intensity belonging to Al2O3 as the open circle shows. The Al2O3 would be the remaining sand after sandblast, which was confirmed by the SEM analysis. The intensities for these peaks are very low, and the effect of these impurities should be negligible. From the above considerations, it is concluded that the thermally formed Fe1−xO scale hardly decomposed during such a rapid experiment realized by the electrical-optical hybrid pulse-heating method.

According to XRD results, lattice constants of Fe1−xO can be obtained to be 0.430 nm for all the samples. Hentschel15) has summarized the relationship between lattice constant of Fe1−xO and the non-stoichiometry; the value of x for Fe1−xO was 0.09 in this research. The x value obtained was for the Fe1−xO layer detected by XRD; the information came from the volume where the X-ray penetrated. The penetration distance (d) could be estimated by the fraction Gd of the total diffracted intensity that is contributed by the surface layer of depth (d) as follows:16)
where
θ is the incident angle of X-ray,
μ is a linear absorption coefficient of the material to X-ray. Here suppose
Gd = 0.99 and
Eq. (1) is changed to:
In this research, the X-ray was generated by Co target. The linear absorption coefficient of Fe1−xO to the X-ray was estimated to be 17000 m−1 based on the following equation:16)
|
μ
Fe
1-x
O
=(
W
Fe
(
μ
Fe
ρ
Fe
)
+
W
O
(
μ
O
ρ
O
)
)
×
ρ
Fe
1-x
O
| (3) |
where
WFe and
WO are the mass percent of Fe and O elements in Fe
1−xO, respectively, and
ρ is density. The mass absorption coefficient (
μ/
ρ) of Fe and O are 5.28 m
2kg
−1 and 1.78 m
2kg
−1, respectively.
17) The value of
ρFe1-xO was estimated to be 5670 kgm
−3 according to the
x value as 0.09, which estimation method would be introduced later. Finally, by substituting these values into
Eqs. (2) and
(3), the penetration distance is determined to be around 60
μm, which is almost same as the Fe
1−xO scale thickness. Thus, the measured lattice constant and
x value could be considered as the average for the Fe
1−xO scale.
Figure 3 shows the cross-sectional SEM image of the coupon after the thermal diffusivity measurement as an example, which was the same coupon shown in Fig. 2. The coupon has a three-layered structure of Fe1−xO/iron/F1−xO; the upper Fe1−xO layer was irradiated by the laser, and the bottom one was focused on by the pyrometer. Respective thicknesses of the three layers of the upper Fe1−xO, the iron and the bottom Fe1−xO and the whole thickness of the coupon (L1, SEM, L2, SEM L3, SEM and Ls, SEM) were evaluated by averaging several tens of thickness measurements for different positions shown in Fig. 3. The total thickness of the coupon (Ls) was also measured by a micrometer. Because of the observation perspective and focus of SEM, the value of Ls,SEM was slightly different from Ls. Therefore, the thickness of each layer was determined by the correction of the thickness estimated by SEM with the thickness measured by a micrometer from the equation as follows:
|
L
i
=
L
i, SEM
×
L
s
L
s, SEM
| (4) |
In the calculation of thermal diffusivities of the coupons and Fe
1−xO scales, linear thermal expansion of iron
18) and FeO
19) were also considered.
Table 1 lists the thicknesses corrected at experimental temperature estimated based on linear thermal expansion.
Table 1. Thicknesses of FeO and Fe layers in the oxidized coupons determined at room temperature and those estimated at experimental temperatures.
| Experimental temperature/K | At room temperature | At experimental temperature |
|---|
| L1/10−5 m | L2/10−4 m | L3/10−5 m | L1/10−5 m | L2/10−4 m | L3/10−5 m |
|---|
| RT | 4.60 | 4.30 | 4.44 | 4.60 | 4.30 | 4.44 |
| RT | 4.40 | 4.09 | 4.04 | 4.40 | 4.09 | 4.04 |
| 624 | 4.85 | 4.29 | 5.22 | 4.87 | 4.33 | 5.24 |
| 624 | 4.76 | 4.26 | 5.53 | 4.78 | 4.30 | 5.55 |
| 624 | 5.44 | 4.30 | 4.91 | 5.46 | 4.35 | 4.93 |
| 625 | 4.34 | 4.39 | 5.15 | 4.35 | 4.43 | 5.17 |
| 656 | 5.23 | 4.29 | 4.68 | 5.25 | 4.33 | 4.70 |
| 708 | 3.93 | 4.31 | 4.80 | 3.95 | 4.36 | 4.83 |
| 727 | 4.83 | 4.32 | 5.09 | 4.85 | 4.37 | 5.12 |
| 732 | 4.69 | 4.42 | 4.14 | 4.71 | 4.47 | 4.16 |
| 865 | 4.07 | 4.27 | 5.05 | 4.10 | 4.33 | 5.09 |
Figure 4 shows the time evolution of the apparent temperature (Ta) measured by pyrometer during the thermal diffusivity measurement at Tr = 865 K. It can be seen that within 200 ms, the coupon was heated up with the approximate heating speed of 4110 Ks−1 and then maintained at the preset experimental temperature (Ta = 772.8 K), which corresponds to the calibrated temperature of 865 K. The inserted figure of Fig. 4 is the enlarged curve of Ta versus time, where the origin of the time axis is transferred to the time when the laser was emitted. The sharp peak of Ta in the enlarged image should be caused by penetration of the laser pulse to the coupon in the laser flash method. The gradual temperature increase after laser irradiation was due to the heat transfer from the front surface heated by the laser.

In this study, the obtained temperature profiles showed better quality for the analysis of laser flash method compared with the results by Yang et al.8) When a pulse laser was irradiated to the sample in the laser flash method, a part of the laser can reach to the pyrometer directly and detected as like a sharp temperature increase. In the study of Yang et al., the peak was very large, and the duration of the peak was mixed with the profile of temperature change after laser pulse irradiation, resulting in the worse quality of temperature profile. This kind of leakage was prevented by two ceramic blocks set on the top of the experimental chamber, as explained in section 2.2, in this study.
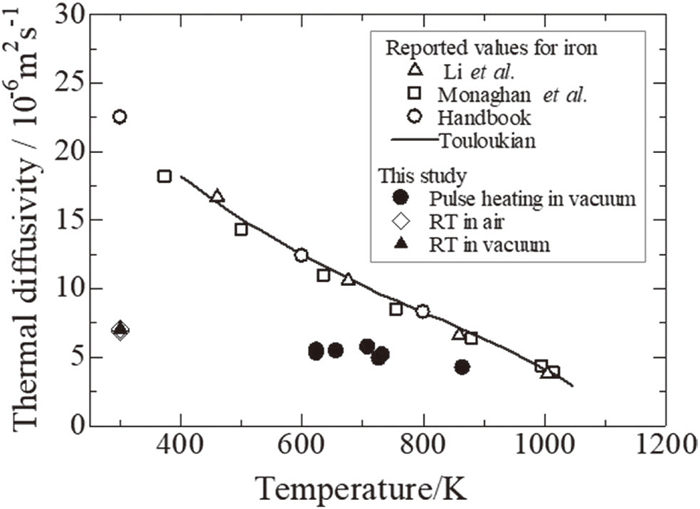
The half time of thermal diffusion for the coupon was estimated to be 9.00 ms from Fig. 4 and the effective thermal diffusivity of the coupon was determined to be 6.37 × 10⁻⁶ m2s−1 based on half-time analysis.12) The effective thermal diffusivities of the coupons were plotted in Fig. 5 with those reported for iron.18,20,21) It can be seen that effective thermal diffusivities of the coupons are smaller than those reported for iron, suggesting that the thermal diffusivity of Fe1−xO scale is much smaller than that of iron. Besides, the values of effective thermal diffusivity measured at similar temperatures are close to each other, and the repeatability of the method seems to be good since the coupons had similar thicknesses of each layer. Based on the difference between effective thermal diffusivity of the coupon and thermal diffusivity of iron, thermal diffusivity of Fe1−xO scale could be determined, which is introduced in the next section.
4. Discussion
In this section, the thermal diffusivity of Fe1−xO scale was derived from the measured effective thermal diffusivity based on a three-layered analysis method.22) The factors which affect measurement results are also discussed from the viewpoints of thermal boundary resistance of Fe1−xO/iron interfaces and non-stoichiometry of the Fe1−xO scale.
4.1. Determination of Thermal Diffusivity of Fe1−xO Scale
The thermal diffusivity of Fe1−xO scale (αFe1−xO, app) was calculated according to ISO 1855522) by the following three-layered analyzing equation:
|
α
Fe
1-x
O, app
=
(
C
1
6
+
C
2
2
+
C
3
2
)
L
1
2
+(
C
1
2
+
C
2
2
+
C
3
6
)
L
3
2
(
L
1
+
L
2
+
L
3
)
2
6
α
s
(
C
1
+
C
2
+
C
3
)
-
L
2
2
α
2
(
C
1
2
+
C
2
6
+
C
3
2
+
C
1
C
3
C
2
)
| (5) |
where
Ci =
ciρiLi, in which
ci is the heat capacity and
ρi is the density of substance
i. The subscripts “1” and “3” mean the two Fe
1−xO layers and “2” means the iron layer in the coupon. Here,
αFe1−xO, app is considered as an apparent value, because
Eq. (5) neglects the boundary resistance between Fe
1−xO scale and the iron substrate.
Equation (5) has a symmetric structure for the parameters with subscripts “1” and “3”; thus, the two-scale layers can be represented by either “1” or “3”. In this study, since the two-scale layers were formed in the same atmosphere and temperature conditions, they are assumed to have the same properties of
c,
ρ, and
α, but different
L values. The value of
αFe1−xO, app was calculated by substituting measured values of
αs,
L1 –
L3 into
Eq. (5) with other parameters at experimental temperature cited in literature
6,18,23) as listed in
Table 2. The density of Fe
1−xO listed in
Table 2 was estimated from the value of the density at room temperature and reported values of linear thermal expansion of Fe
1−xO.
19) The density at room temperature was estimated for Fe
0.91O (
x = 0.09) by the following equation:
|
ρ
Fe
1-x
O
=
4×(1-x)×
M
Fe
+4×
M
O
)
6.02×
10
23
×
a
Fe
1-x
O
3
| (6) |
where
aFe1−xO is the lattice constant of Fe
1−xO scale, and
MFe and
MO are the atomic mass of Fe and O, respectively. Based on the data listed in
Table 2, the value of
αFe1−xO, app could be obtained.
Table 2. Referred data for calculation of
αFeO,app at experimental temperatures.
| Temperature/K | Specific heat/Jkg−1K−1 | Density/kgm−3 | Thermal diffusivity |
|---|
| Iron18) | FeO23) | Iron18) | FeO | Iron/10−6 m2s−1 6) |
|---|
| RT | 453 | 725 | 7860 | 5670 | 22.5 |
| 624 | 586 | 758 | 7753 | 5555 | 11.7 |
| 625 | 586 | 758 | 7753 | 5555 | 11.7 |
| 656 | 603 | 764 | 7740 | 5548 | 10.9 |
| 708 | 630 | 773 | 7718 | 5537 | 9.66 |
| 727 | 640 | 776 | 7711 | 5533 | 9.23 |
| 732 | 642 | 777 | 7708 | 5532 | 9.11 |
| 865 | 774 | 801 | 7648 | 5502 | 6.37 |
The value of αFe1−xO, app
would be affected by the thermal boundary resistance between Fe1−xO scale and iron substrate as well as the thermal diffusivity of Fe1−xO scale. The following equation explains the relationship between the thermal resistance of Fe1−xO scale (LFe1−xO/kFe1−xO), the thermal boundary resistance (h) and the apparent thermal resistance (LFe1−xO/kFe1−xO, app) for the coupon in this study:
|
L
Fe
1-x
O
k
Fe
1-x
O, app
=
L
Fe
1-x
O
k
Fe
1-x
O
+2h
| (7) |
where
k is the thermal conductivity, which is derived from
k =
αρc, where the subscripts of “Fe
1−xO, app” and “Fe
1−xO” represent with and without the effect of thermal boundary resistance of Fe
1−xO scale/iron interfaces, respectively, and
LFe1−xO is the total thickness of Fe
1−xO layers (
LFe1−xO =
L1 +
L3).
Equation (7) can be transformed into another equation as follows,
|
1
α
Fe
1-x
O
=
1
α
Fe
1-x
O, app
-
2h
ρ
Fe
1-x
O
c
Fe
1-x
O
L
Fe
1-x
O
| (8) |
where
αFe1−xO involves no effect of thermal boundary resistance.
Li et al.7) have reported the boundary resistance of Fe1−xO scale/iron from room temperature to high temperature: the reported boundary resistance were 6.4 × 10⁻⁶ m2KW−1 at room temperature and 0.1 × 10⁻⁶ m2KW−1 at high temperature over 600 K. The values were determined on the iron plate samples oxidized in the air and smooth Fe1−xO scale/iron interface was found, which conditions are same as coupons used in this study. Therefore, the boundary resistance of Fe1−xO scale/iron boundary in the research of Li et al. was substituted into Eq. (8) to check the effect of boundary resistance on thermal diffusivity.
Figure 6 shows the temperature dependence of the thermal diffusivity calculated in this study. The thermal diffusivity at room temperature increased over 30% by correcting the effect of boundary resistance. At high temperatures, thermal resistance causes little change on the thermal diffusivity of Fe1−xO scale; only by 0.5%. Therefore, the points plotted in Fig. 6 for this study are without the correction of the effect of boundary resistance at high temperatures. Further discussion would be required for the boundary resistance at room temperature.

At room temperature, the values measured in air and vacuum are close to each other; the difference is smaller than 4%. This means that the sample can be considered as dense. It can be seen that there is no obvious temperature dependence of thermal diffusivity of Fe1−xO scale at temperatures between 600 K and 900 K and averaged value was (4.8 ± 0.3) × 10−7 m2s−1. The detail and the explanation of such temperature dependence will be discussed later.
4.2. Comparison with Reported Values
Figure 6 also shows the previously reported thermal diffusivities of thermally grown Fe1−xO scale.5,7,8) At room temperature, the data measured without revising the effect of boundary resistance are smaller than reported values by Li et al.7) After the revision of the boundary resistance, the data in this study became close to those reported by Li et al.
The values measured in this research are smaller than those reported by Taylor et al. The value reported by Taylor et al. shows hysteresis existing during the consecutive heating and cooling cycles, which should be caused by the decomposition of Fe1−xO in the heating cycle, especially, from 450 K to 900 K. In the cooling cycle, since the cooling speed would be fast, the phases at high temperatures, mainly Fe1−xO but possibly contains Fe and Fe3O4, would be maintained in the sample. The Fe1−xO decomposition increases the measured thermal diffusivity value; thus, the smaller data obtained in this research are considered to be reasonable.
The values reported by Li et al.6) are those for Fe1−xO scale below 473 K and corrected values for Fe1−xO over 673 K. Since the phase transformation was found in the samples after the measurement over 673 K, the thermal diffusivity of Fe1−xO was estimated on the basis of the volume ratio of existing phases in the post-experiment samples. The thermal diffusivity of Fe1−xO scale measured in this study shows good agreement with that reported by Li et al. However, the measured value in this study shows no temperature dependence within the uncertainty of the measurement, while Li et al. reported that the thermal diffusivity of Fe1−xO slightly decreases with increasing temeperature above 473 K.
This study applied the same measurement technique as Yang et al.8) used. The obtained values in this study show good agreement with that reported by Yang et al., although there is difference in sample preparation methods: Yang et al. prepared the sample by oxidizing an iron coupon for 5 h under oxygen partial pressure around 1.7 × 10⁻¹² Pa at 1123 K. The x value of the sample should also be different from this research: the average oxygen partial pressure and x value were estimated to be 1.95 × 10⁻¹² Pa and 0.085, respectively. However, the result of such a difference would be negligible within the uncertainty of the measurement. The measured thermal diffusivity in this study has large scatter by 6% from standard deviation, but the value would be worth because the values are for temperatures lower than 833 K, where the phase separation occurs thermodynamically in Fe1−xO scale.
4.3. Temperature Dependence of Thermal Diffusivity
Figure 6 shows that there is no obvious temperature dependence in thermal diffusivity at temperatures over 600 K. The data scatters around 4.8 × 10⁻⁷ m2s−1. The physical principle for heat conduction in Fe1−xO should be discussed to explain such effects.
Since Fe1−xO is a kind of semiconductor with low electrical conductivity,24) the heat is mainly conducted by a phonon, and the phonon thermal conductivity can be expressed by the following equation:
|
k≈
k
phonon
=
1
3
c
l
v
s
l
l
| (9) |
where
cl is the phonon heat capacity per unit volume,
vs is the average phonon group velocity, and
ll is the phonon mean free path. Among these factors
k =
αρcp and
cl =
ρcv, where
ρ is density,
cp and
cv are specific heats at constant pressure and volume, respectively, and for solid
cp is almost same as
cv. Substituting these equations into
Eq. (9), thermal diffusivity of Fe
1−xO can be expressed by:
Equation (10) indicates that temperature dependence of thermal diffusivity of Fe
1−xO is affected by
vs and
ll. The value of
vs approximately equals the speed of sound in solids, which is assumed to be independent of temperature.
25) Normally,
ll is proportional to the inverse of temperature at high temperature;
26) as temperature increases,
ll becomes smaller, and the thermal diffusivity of Fe
1−xO should also be smaller. However, the data obtained in this research did not show such a decrease with temperature increase. Such a contradiction could be attributed by non-stoichiometry of Fe
1−xO. The loss of Fe ion in crystal lattice causes defects, which act as phonon scattering center and also decrease the phonon mean free path.
The effect of non-stoichiometry could be seen clearly by comparing thermal diffusivity of Fe1−xO measured in this study with other metal oxides27) as shown in Fig. 7. The other stoichiometric metal oxides(MgO or CaO) and Ni1−xO, which has very weak non-stoichiometry (0 ≤ x ≤ 0.001),28) show negative temperature dependence in thermal diffusivity since phonon mean free path decreases with temperature increase.27) Compared with other metal oxides, the thermal diffusivity of Fe1−xO is much smaller than those of the other metal oxides. The larger value of x in Fe1−xO would make phonon mean free path smaller, resulting in the much smaller thermal diffusivity for Fe1−xO than those for the other metallic oxides at room temperature. Li et al.6) suggested that the thermal diffusivity of Fe1−xO slightly decreases with increasing temperature due to the increase of phonon-phonon scattering; however, such effect is small for Fe1−xO compared to the other oxides since the structurally introduced defects dominate the phonon mean free path. This consideration also suggests that other factors which affect the phonon mean free path, such as grain boundary and orientation, seems not to have a significant effect on the thermal diffusivity of the Fe1−xO scale than the contribution from the non-stoichiometry.

5. Conclusions
The thermal diffusivity of Fe1−xO scale, which had been thermally grown on high purity iron coupons, have been determined at room temperature and from about 600 K to 900 K by the laser flash method. The electrical-optical hybrid pulse-heating method was applied for measurements at elevated temperatures with the improvements of adjusting the laser irradiation position.
Fe1−xO scale layers formed on coupons were dense; the effect of porosity on thermal diffusivity was within 4% for the room temperature measurements. During the high-temperature measurement by the electrical-optical hybrid pulse-heating method, the Fe1−xO scales were maintained, and no decomposition of Fe1−xO occurred because the duration was excessively decreased for the sample exposed to high temperature. Thermal diffusivities of thermally grown Fe1−xO obtained are determined to be scattering around 4.8 × 10⁻⁷ m2s−1 with almost no temperature dependence. XRD analysis determined the x value for Fe1−xO scale to be 0.09. Non-stoichiometry the Fe1−xO scale would make smaller the thermal diffusivity of Fe1−xO and also contributes to the temperature dependence.
Acknowledgments
This work was supported by the research group for “Thermophysical Properties of Oxide Scale-II” in Rolling Theory Committee, The Iron and Steel Institute of Japan. The authors are grateful for the financial support from the Institute and useful advice from the Committee members. The authors also appreciate to Dr. Ishibashi and Mr. Kubo in Fuji Manufacturing Co., Ltd for the special treatment of sandblasting of the coupons and to Profs. Ueda and Watanabe in Department of Materials Science and Engineering, Tokyo Institute of Technology for the essential advice of XRD analysis.
References
- 1) M. Krzyzanowski, J. H. Beynon and D. C. J. Farrugia: Oxide Scale Behavior in High Temperature Metal Processing, Wiley-VCH Verlag & KGaA, Weinheim, (2010), 33. https://doi.org/10.1002/9783527630318.ch2
- 2) J. Slowik, G. Borchardt, C. Köhler, R. Jeschar and R. Scholz: Steel Res., 61 (1990), 302. https://doi.org/10.1002/srin.199000353
- 3) T. Akiyama, H. Ohta, R. Takahashi, Y. Waseda and J. I. Yagi: ISIJ Int., 32 (1992), 829. https://doi.org/10.2355/isijinternational.32.829
- 4) R. Endo, T. Yagi, M. Ueda and M. Susa: ISIJ Int., 54 (2014), 2084. http://doi.org/10.2355/isijinternational.54.2084
- 5) R. Taylor, C. M. Fowler and R. Rolls: Int. J. Thermophys., 1 (1980), 225. http://doi.org/10.1007/BF00504523
- 6) M. Li, R. Endo, M. Akoshima and M. Susa: ISIJ Int., 57 (2017), 2097. http://doi.org/10.2355/isijinternational.ISIJINT-2017-301
- 7) M. Li, R. Endo, M. Akoshima, H. Tanei, H. Okada and M. Susa: ISIJ Int., 59 (2019), 398. https://doi.org/10.2355/isijinternational.ISIJINT-2018-553
- 8) Y. Yang, H. Watanabe, M. Ueda, M. Hayashi, M. Susa and R. Endo: ISIJ Int., 58 (2018), 2186. https://doi.org/10.2355/isijinternational.ISIJINT-2018-380
- 9) L. Darken and R. W. Gurry: J. Am. Chem. Soc., 68 (1946), 798. https://pubs.acs.org/doi/pdf/10.1021/ja01209a030
- 10) H. Tanei and Y. Kondo: ISIJ Int., 57 (2017), 506. https://doi.org/10.2355/isijinternational.ISIJINT-2016-552
- 11) H. Tanei and Y. Kondo: ISIJ Int., 52 (2012), 105. https://doi.org/10.2355/isijinternational.52.105
- 12) H. Watanabe and T. Baba: Appl. Phys. Lett., 88 (2006), 241901. http://doi.org/10.1063/1.2211985
- 13) W. J. Parker, R. J. Jenkins, C. P. Butler and G. L. Abbott: J. Appl. Phys., 32 (1961), 1679. http://doi.org/10.1063/1.1728417
- 14) T. Shiraiwa and F. Matsuno: Sumitomo Met., 19 (1967), 33.
- 15) B. Hentschel: Z. Naturforsch. A, 25 (1970), 1996.
- 16) B. D. Cullity: Elements of X-ray Diffraction. 2nd ed., Addison-Wesley Publishing Company, Inc., Reading, MA, (1978), 13.
- 17) J. A. Ibers and W. C. Hamilton: International Tables for X-Ray Crystallography, Vol. 4, The Kynoch Press, Birmingham, (1974), 61.
- 18) Thermophysical Properties Handbook, ed. by Japan Society of Thermophysical Properties, Yokendo, Tokyo, (2008), 23 (in Japanese).
- 19) Thermophysical Properties Handbook, ed. by Japan Society of Thermophysical Properties, Yokendo, Tokyo, (2008), 283 (in Japanese).
- 20) B. J. Monaghan and P. N. Quested: ISIJ Int., 41 (2001), 1524. https://doi.org/10.2355/isijinternational.41.1524
- 21) Y. S. Touloukian, R. W. Powell, C. Y. Ho and M. C. Nicolaou: Thermal Diffusivity, Thermophysical Properties of Matter, Vol. 10, IFI/Plenum, New York, (1973), 82.
- 22) ISO 18555: 2016, Metallic and other inorganic coatings – Determination of thermal conductivity of thermal barrier coatings – Annex A (informative) Areal heat diffusion time method.
- 23) Thermophysical Properties Handbook, ed. by Japan Society of Thermophysical Properties, Yokendo, Tokyo, (2008), 271 (in Japanese).
- 24) H. K. Bowen, D. Adler and B. H. Auker: J. Solid State Chem., 12 (1975), 355. https://doi.org/10.1016/0022-4596(75)90340-0
- 25) P. Debye: Ann. Phys., 39 (1912), 789.
- 26) G. Grimvall: Thermophysical Properties of Materials, Elsevier Science B.V., Amsterdam, (1999), 261.
- 27) Thermophysical Properties Handbook, ed. by Japan Society of Thermophysical Properties, Yokendo, Tokyo, (2008), 291 (in Japanese).
- 28) T. B. Reed: The Chemistry of Extended Defects in Non-Metallic Solids, eds. by L. Eyring and M. O’Keeffe, North-Holland, Amsterdam, (1970), 21.