Ironmaking
Extraction of Iron from Refractory Titanomagnetite by Reduction Roasting and Magnetic Separation
2021 Volume 61 Issue 1 Pages 93-99

Details
2021 Volume 61 Issue 1 Pages 93-99
The abundant refractory titanomagnetite (TTM) provides a cheap alternative source of iron, but this ore contains impurities and is difficult to process to make suitable concentrates for the blast furnace. In this study, reduction roasting of a primary TTM concentrate followed by magnetic separation was investigated to understand the effects of reduction time, coal dosage, and CaF2 addition on the reduction behavior of TTM and growth mechanism of iron particles. The phase composition of reduced samples was characterized by X-ray diffraction. The size distribution of iron particles was quantitatively examined using image analysis. Results showed that CaF2 can help improve the reduction degree and particle size of metallic iron. The metallization degree increased from 85.5% to 89.5% when the CaF2 dosage increased from 0% to 4%, while a minor increase was observed when the CaF2 dosage exceeded 4%. Accordingly, the TTM samples were treated by reduction roasting with 4% CaF2 and 25% coal at 1200°C for 60 min followed by magnetic separation. A magnetic concentrate with an iron content of 91.1% and a recovery of 92.9% was achieved. In addition, the relationship between the size distributions of iron particles and grinding fineness was also studied. The size distribution using data from the diameter of iron particles was found to be close to the actual grinding fineness.
The exploitation of refractory iron ores has become increasingly important across the world owing to the fast depletion of easy-to-process iron ores.1) Ironsand is extensively distributed in coastal areas, such as Indonesia and New Zealand, and can provide an alternative source for conventional iron ores.2) Although the composition of ironsand is partially dependent on its origin/location, it approximates that of titanomagnetite (Fe3−xTixO4) containing ~60% total Fe (TFe). The major impurities in ironsand are MgO, Al2O3, and SiO2. All but SiO2 are typically associated with the titanomagnetite (TTM) grains and are present as solid solution components within the lattice.3,4) Thus, it is difficult to separate major impurities and obtain high-quality iron concentrates using conventional beneficiation methods such as specific gravity and magnetic separation.5)
To efficiently utilize the TTM, many pyrometallurgical processes, including blast furnace smelting and direct reduction–electric furnace smelting, have been investigated.6,7,8) The conventional smelting routes have, to some extent, achieved recovery of iron, but they still have several disadvantages. For example, ironsand needs to be incorporated into sinter for ironmaking because its small particle size precludes direct charging into a blast furnace, and sinter blend only allows the addition of a small amount of ironsand to ensure the desired sintering characteristics.3) Recent research has shown it is feasible to recover metallic iron from refractory iron ores by reduction roasting followed by magnetic separation.9,10,11) This technology combines metallurgy and mineral processing, in which iron oxides are primarily reduced to metallic iron with grain growth. The reduced product is then ground to its liberation size followed by magnetic separation.12,13,14) In addition, it is widely believed that the reduction characteristics or separating result is not good without using the aid of additives, so additives such as CaF2 and CaCO3 are often used. However, previous studies on the reduction roasting of ironsand have primarily focused on the influential factors, such as reaction temperature, and reaction time.15,16)
In this study, the feasibility of reduction roasting followed by magnetic separation to extract iron from refractory TTM was investigated. The effects of reduction time, coal dosage, and CaF2 addition on the reduction behavior of TTM and growth mechanism of iron particles were analyzed and clarified. The correlation of the size distribution of iron particles with the grinding fineness was also evaluated in this study, based on the grinding fineness and magnetic separation tests.
The raw TTM used in this study was obtained from the Indonesian coast. After drying, grinding, and magnetic separation, the chemical composition of the TTM concentrate was as follows: 57.29% TFe, 26.08% FeO, 12.04% TiO2, 1.69% SiO2, 1.74% MgO, and 1.23% Al2O3. The X-ray diffraction (XRD) pattern (Fig. 1) of the TTM sample showed that the main crystalline phases were TTM, as well as small amounts of ilmenite and quartz. Bituminous coal was used as the reductant, and it was ground to <1 mm prior to the reduction tests. A proximate analysis showed that the coal was composed of 56.66% fixed carbon, 29.54% volatiles, 6.55% ash, and 7.25% moisture. Analytical-reagent grade CaF2 was used as an additive. The size distributions of the TTM sample and CaF2 were analyzed by a laser interferometer (SEISHIN LMS-30). As shown in Fig. 2, the size of the TTM sample was the range from 0 to 52 μm, and the average size was about 17 μm. The size of the CaF2 particles was the range from 0 to 50 μm, and the average size was about 12 μm.

X-ray diffraction (XRD) pattern of the studied sample.
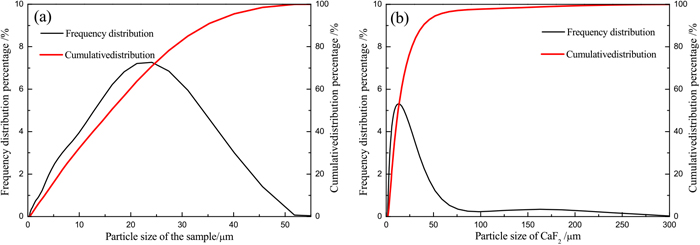
Particle size distributions of the (a) TTM sample and (b) CaF2. (Online version in color.)
The reduction of TTM by bituminous coal was conducted in a vertical tube electric furnace whose schematic is shown in Fig. 3. The reaction chamber was an alumina tube with an inner diameter of 56 mm and a height of 82 cm. A homogeneous temperature zone in this furnace was about 30 mm. The sample was prepared by mixing 10 g of the TTM concentrate, a certain amount of coal and CaF2, and then the mixtures were placed in a corundum crucible.

Schematic of the experimental apparatus. (Online version in color.)
To conduct the reduction experiments, the furnace was preheated to the temperature of 1200°C, and then purged with N2 for 20 min. The corundum crucible with the sample was then placed in the hot zone of the furnace. The flow rate of N2 was maintained at 3.0 L/min, and the concentrations of CO and CO2 in the outlet gas were analyzed online by an infrared CO/CO2 analyzer (Vario Plus, MRU). After a specific reaction time, the sample was quickly removed from the hot zone to the cool top part of the furnace for quenching.
The reduced samples under optimum conditions were treated by grinding and magnetic separation. Grinding was performed using a rod mill (RK/BM-1.0L) at a solid density of 60 wt% with a rotation speed of 289 r/min for different times (5–20 min). An XCGS-73 magnetic tube with a magnetic field intensity of 1250 Oe was used to recover metallic iron. The magnetic concentrate designated direct reduced iron (DRI) was obtained by a two-stage magnetic separation process, namely, the rough concentrate obtained from the first separation step was magnetically separated again. The main evaluation indexes of the test results were the iron grade and the iron recovery of DRI. The iron recovery refers to the percentage of the total iron contained in the ore that is recovered into the DRI.
2.3. Analysis and CharacterizationThe reduced samples were analyzed by X-ray diffraction (XRD, D/Max 2200, Rigaku) with Cu Kα radiation. The metallization degree (η) of the reduced sample was calculated as follows:
| (1) |
To study the morphological changes and size distribution of iron particles, the reduced samples were mounted in epoxy resin and polished for optical microscopic observation (Leica DM64500P Optical Microscope) and scanning electron microscopy (SEM, S360-EVO18) analysis. Fifty optical microscope images (each containing>300 iron particles) for each reduced sample were obtained in reflected light and analyzed using Leica QWin (Leica Microsystems, Germany) software, which can provide a series of image-analysis tools for microscopy applications, such as image detection, processing, and measurement. For every image, the properties (such as length, width and area) of each iron particle were automatically measured by QWin software. Taking the images shown in Fig. 4 for instance, different colors in the image (Fig. 4(b)) processed by the QWin software denote different size distributions of iron particles. In the end, the data were exported to an Excel file for categorization and calculation.

Image acquired for image analysis. (Online version in color.)
The phase transformations of reduced samples were identified in the presence of different coal dosages. The reduction experiments were conducted at 1200°C for 60 min without CaF2. The XRD analysis (Fig. 5) shows that the main phases of the sample with the addition of 15% coal were metallic iron and TTM. When the coal dosage increased to 20%, the phase of TTM disappeared, while FeTiO3, Ca3Al2O6, and (Fe, Mg)Ti2O5 peaks were observed. The peak intensities of FeTiO3 gradually decreased, whereas those of metallic iron increased with increasing coal dosage. When the coal dosage increased from 25% to 30%, no new phase was observed. Therefore, the coal dosage was fixed at 25% in the subsequent experiments.

XRD patterns of samples reduced at 1200°C for 60 min with different coal dosages. (Online version in color.)
The effect of reduction time on the reduction of TTM was also investigated. Figure 6 shows the XRD patterns of the samples reduced at 1200°C without CaF2 for different times. When the reduction time was 20 min, the main phases included metallic iron, FeTiO3 and FeO. After reduction for 40 min, the FeO phase disappeared, and new phases of Ca3Al2O6 and (Fe, Mg)Ti2O5 were observed. When the reduction time was further extended, no new phase was observed. Therefore, the reduction time was fixed at 60 min in the subsequent experiments.

XRD patterns of samples reduced by 25% coal at 1200°C for different reduction times. (Online version in color.)
To compare the effects of CaF2 on the reduction of TTM, the reduction degree (R) can be calculated from the composition and flow rate of the outlet gas according to Eq. (2), given as:
| (2) |
According to the weight percentages of FeO and Fe2O3 in the ironsand sample, the oxygen content combined with Fe can be calculated by Eq. (3). Thus, when 10 g of the sample was added, the theoretical amount of oxygen loss was 2.21 g.
| (3) |
The mole generation rate of oxygen at reduction time t can be calculated according to the following expression:
| (4) |
| (5) |
| (6) |
Therefore, Eq. (2) can be rewritten as:
| (7) |
The experiments were conducted at 1200°C with a reduction time of 60 min and a coal dosage of 25%. Figure 7 shows the reduction degree curves at different CaF2 dosages, viz, 0%, 4%, 8% and 12%. From Fig. 7, it can be found that CaF2 obviously influenced the reduction degree, and the reduction degree increased with increasing CaF2 concentrations. This indicates that the addition of CaF2 played a positive role in increasing the reduction degree of TTM. Furthermore, in general, the reduction of TTM progressed according to the following path: Fe3-xTixO4→FeO+Fe2TiO4→Fe+Fe2TiO4→Fe+FeTiO3→Fe+FeTi2O5.15) Thus, it can be clearly observed from Fig. 7 that in the later stage of reduction, the reaction rate decreased because the reductions of FeTiO3 and FeTi2O5 by coal were more difficult than that of FeO. Moreover, it is shown that the final degree of reduction slightly exceeded 1.0 when the addition of CaF2 was 8% and 12%, probably because the volatile matter generated a small amount of CO and CO2.
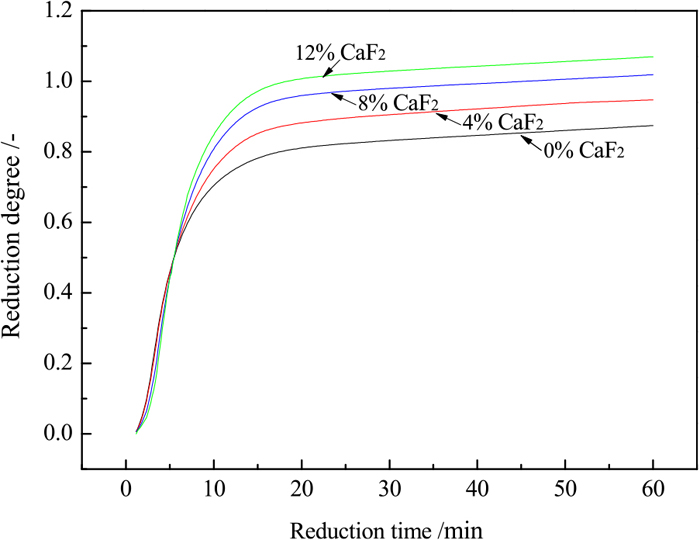
Effect of CaF2 on the reduction degree of the samples reduced by 25% coal at 1200°C. (Online version in color.)
The effect of CaF2 dosage on the metallization degree of reduced samples is shown in Fig. 8. As the CaF2 dosage increased, the metallization degree first increased quickly and then slowed down. The metallization degree increased from 85.5% to 89.5% when the CaF2 dosage increased from 0% to 4%, and only increased from 89.5 to 91.3% as the CaF2 dosage increased from 4% to 12%. The above results show that the presence of CaF2 can easily promote the reaction of TTM, but the promoting effect weakened when the dosage of CaF2 was more than 4%.
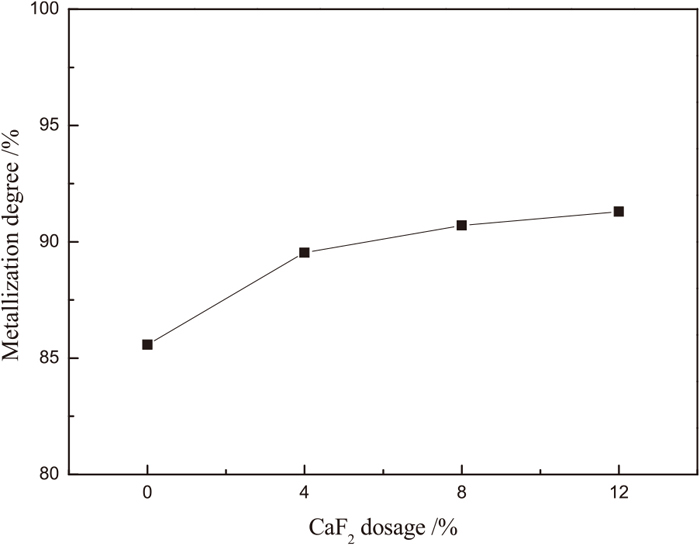
Effect of CaF2 on the metallization degree of the reduced samples.
The phase transformations were identified by XRD. As shown in Fig. 9, the main phases of the reduced sample without adding CaF2 were metallic iron, (Fe, Mg)Ti2O5 and FeTiO3. When the CaF2 dosage was increased to 4%, no new phase was observed. When the dosage of CaF2 was more than 4%, the diffraction peaks of CaF2 were observed, which indicates there were lots of residual CaF2 in reduced sample that did not react.

XRD patterns of the reduced samples with different dosages of CaF2.
In generally, one ion may replace another if the difference between their ionic radii does not exceed 15% of the radius of the smaller ion.15,16) Fluorine ions and oxygen ions have similar ionic radii (0.133 and 0.144 nm, respectively). This indicates that F− can easily replace the position of O2−, and an O2− ion tends to replace two F− ions to maintain local electrical neutrality.17,18) As a result, F− can break the TTM network and reduce the stability of the lattice structure, thus accelerating the reduction process. Therefore, the induced structural changes facilitated the reduction of the TTM, and also can decrease the melting point, which will be beneficial to the growth of metallic iron grains. However, combined with the XRD analysis, it was found that when the CaF2 dosage was increased to 4%, no new phase was observed, and titanium existed mainly in the form of (Fe, Mg)Ti2O5 and FeTiO3. These results show that even in the present of CaF2, the reductions of FeTiO3 and (Fe, Mg)Ti2O5 by coal were still difficult. Therefore, with the increasing of CaF2 dosage, only a certain amount of F− can diffuse into the TTM lattice, but more F− will exist in the form of CaF2. This also explains why peaks of CaF2 were observed when the dosage of CaF2 was more than 4%. Besides, excessive CaF2 also caused lower melting point, which hindered the diffusion of reducing gas and weakened the promoting effect of CaF2.
3.3. Growth Characteristic of Metallic Iron ParticlesWith the exception of metallization degree, the sizes of iron particles should be controlled because they considerably affect the results of magnetic separation. In general, the size characterization can be expressed by mean size. Therefore, mean size parameters (diameter and length) were first studied in this study to determine the effect of CaF2 on the growth behavior of iron particles. The mean diameter represents the average value of the equivalent diameter of the measured iron particles, and the mean length represents the average value of the length of the measured iron particles.
Figure 10 shows that both the mean diameter and length of the iron particles first increased quickly and then their growth rates slowed down as the dosage of CaF2 increased. Figure 10(a) shows, when the CaF2 dosage increased from 0% to 8%, the mean diameter increased from 13.2 μm to 18.9 μm, and corresponding increased from 18.9 μm to 20.8 μm as the CaF2 dosage increased from 8% to 16%. Figure 10(b) shows that the mean length increased from 25.3 μm to 39.0 μm when the CaF2 dosage increased from 0% to 8%, while a minor increase was observed when the CaF2 dosage exceeded 8%. These results suggest that adding CaF2 can facilitate the growth of iron particles.

Effect of CaF2 on the growth of iron particles. (a) Mean diameter and (b) Mean length. (Online version in color.)
To gain insights into the effect of CaF2 addition on the growth of iron particles, the reduced samples were analyzed by SEM. Figure 11 shows that the addition of CaF2 resulted in an increase in the particle sizes of iron grains compared to the sizes in the case at which no additive was present. Therefore, combined with the XRD analysis, the content of CaF2 should be maintained at a proper level of 4% because the addition of excessive amounts of CaF2 will lead to the presence of excessive amounts of residual CaF2 in the reduced sample that will not react.

SEM images of the reduced samples reduced by 25% coal at 1200°C for 60 min. (a) No additive and (b) 4% CaF2. (Online version in color.)
To extract iron from refractory TTM, the reduced samples with adding 4% CaF2 were separated by grinding and magnetic separation. Figure 12 shows that the iron recovery increased gradually with an increase in the grinding time. When the grinding time increased from 5 min to 20 min, the iron recovery increased from 72.0% to 92.9%. Subsequently, the iron recovery increased slowly to 93.6% when the grinding time was extended to 25 min. The iron grade of DRI increased from 69.8% to 91.1% when the grinding time increased from 5 min to 20 min, but it decreased gradually as the grinding times exceeded 20 min. Therefore, the optimal grinding time was 20 min, which achieved an adequate liberation of iron particles. Under the optimal conditions, a magnetic product with an iron grade of 91.1% and an iron recovery of 92.9% was obtained. Besides, the mineral composition of the DRI was also determined. As shown in Fig. 13, the main mineral of the DRI was metallic iron, the diffraction peaks of FeTiO3 and (Fe, Mg)Ti2O5 were not observed. Although there might be little impurities such as FeTiO3 or (Fe, Mg)Ti2O5 in DRI, the content was very low.

Effect of grinding time on the iron grade and recovery. (Online version in color.)
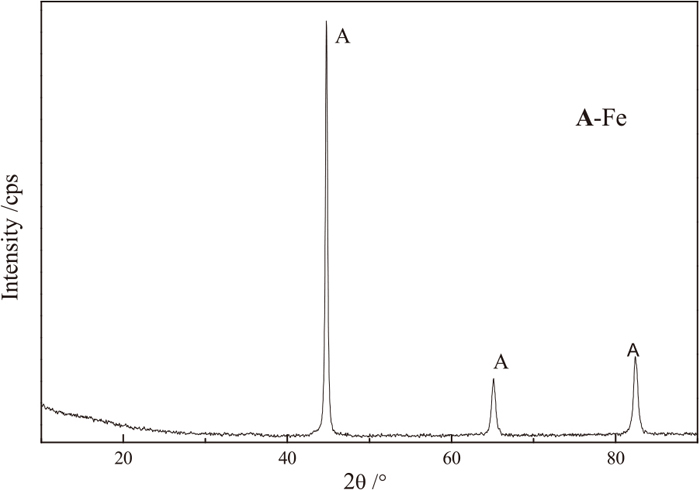
XRD patterns of DRI after grinding of 20 min and magnetic separation.
To investigate relationship between measured size distributions of iron particle and grinding fineness, the grinding fineness tests were carried out. From Fig. 11(b), it can be found that the size of iron particle was mainly distributed in the range of 0 to 50 μm, so the fineness of the power after grinding was wet classified at a 400 mesh (37.4 μm). As shown in Fig. 14, the percentage in a -400 mesh first increased rapidly followed by a slower increase as a function of grinding time. The percentage increased from 43.2% to 95.4% when the grinding time increased from 5 min to 20 min, while it only increased from 95.4% to 96.5% as the grinding time increased from 20 min to 25 min. Hence, it is difficult to improve grinding fineness as well as the liberation of iron by continuing grinding. These results further suggest that the optimal grinding time may be 20 min, where the grinding fineness was about 95.4% in the case of the -400 mesh. Generally, a sample is ground to 95% through a 400 mesh, which means the percentage in a -400 mesh reaches 95% and the maximum particle size in the ground sample is close to the mesh size, namely about 37.4 μm. In other words, the reduced product with 4% CaF2 is supposed to be ground to liberation size, i.e., about 37.4 μm.

Relationship between grinding fineness and grinding time.
The size and cumulative distributions of iron particles are important factors in the understanding of the mill performance, and they are displayed in Figs. 15(a) and 15(b). Figure 15(a) shows that the particle size was mainly distributed in the range of 0 to 48 μm. In addition, D80 and D95 can be used to describe the particle size and size distribution. For example, D95 represents the particle size when the percentage of cumulative distribution reaches 95%. Thus, from Fig. 15(a), it can be seen that the value for D95 was 43.3 μm. As shown in Fig. 15(b), iron particles have a wide length in the range of about 0 to 120 μm, and the value for D95 was 104.4 μm.

Size and cumulative distributions of the reduced samples with adding 4% CaF2. (Online version in color.)
When the measured value for D95 was compared with the grinding fineness (95% through the -400 mesh), it can be inferred that the D95 value (43.3 μm) of the diameter rather than the D95 value (104.4 μm) of the length is closer to the optimal liberation size (37.4 μm). This also suggests that the measured value using data from the length of iron particles is considerably different from the actual grinding fineness. Therefore, the above-mentioned size analysis can not only be convenient to study the effect of additives on the growth of iron particles and size distribution, but also help predict the size range and suitable liberation size by using the diameter data of the iron particles.
To extract iron from refractory TTM, reduction roasting and the particle size of metallic iron were investigated. These procedures analyzed and clarified the effects of reduction time, coal dosage, and CaF2 addition. The conclusions are summarized as follows:
(1) CaF2 can help improve the reduction rate of the TTM. The reduction degree increased with increasing CaF2 dosage, but the promoting effect weakened when the dosage of CaF2 was more than 4%. With the CaF2 dosage of 4%, the main products were metallic iron, (Fe, Mg)Ti2O5 and FeTiO3, the addition of an excessive amount of CaF2 led to the formation of an abundant volume of residual CaF2 in the reduced sample that did not react. Other factors such as reduction time and coal dosage can also affect the reduction of TTM.
(2) It is observed that CaF2 significantly promoted the growth of metallic iron. The particle size of metallic iron in the reduced samples increased when the CaF2 content increased.
(3) A comparison of the size distributions of iron particles with grinding fineness showed that size distribution using data of the diameter of iron particles was close to the actual grinding fineness. Based on the results, this method will be applied as an effective way to predict the size range and suitable liberation size.
(4) The TTM samples were treated by reduction roasting with 4% CaF2 and 25% coal at 1200°C for 60 min, followed by magnetic separation. A magnetic concentrate with an Fe content of 91.1% and a recovery of 92.9% were achieved.
The authors wish to express their thanks to the Natural Science Foundation of China (No. 51874017 and 51674018) for the finance support for this research.