Abstract
Based on the analysis of single-bar melting experiments in a previous article,1) the effect of spacing between the steel bars on the agglomeration of steel shells around the steel bars and the melting rate of steel scrap samples was studied in this article. In addition, a calculation model of melting time of steel scrap in the electric arc furnace under different bulk densities and random stacking conditions was also established. The two-bar melting experimental results show that the thermal simulation results are basically consistent with the numerical simulation results. And an increase in the spacing between the steel bars up to 6 mm and the preheating temperature of the steel scrap samples up to 1073 K, can greatly reduce or eliminate the adverse effect of the agglomeration of steel shells around the steel bars on the melting process, thus greatly reducing the melting time. The multibar melting experimental results show that an increase in the porosity is beneficial to the melting of steel scrap samples, and when the porosity reached 0.84 and above, the melting time of multibar samples is close to that of an individual steel bar. In addition, the calculation model can accurately predict the melting time of the steel scrap in the electric arc furnace.
1. Introduction
Steel scrap is an indispensable raw material in the steel industry, and it is a renewable resource that can be recycled indefinitely. With the Chinese government vigorously advocating low-carbon and green development, the electric arc furnace (EAF) steelmaking process with steel scrap as the main raw material has been valued.1) In addition, the Chinese government has vigorously cracked down on substandard steel and promoted the industrialization of steel scrap resources, thereby further promoting the development of EAF steelmaking.2) However, the melting rate of steel scrap is one of the important influencing factors for EAF to improve production efficiency and reduce energy consumption. It is reported that the energy consumed by heating and melting of steel scrap accounts for about 60 pct of the total energy, and more than 50 pct of the time requirement for one heat is used for scrap melting.3,4)
The EAF steelmaking has generally adopted large “hot heel” and flat bath operation, which utilized the liquid steel left in the bottom of the furnace to heat and melt the fresh steel scrap. Therefore, several studies have been carried out to investigate the melting of steel bar in the liquid steel by thermal simulation experiment in induction furnace. In these studies, the melting characteristics of an individual steel bar with simple geometries, such as cylindrical and square, were observed.5,6,7,8,9,10,11) And the factors, such as initial temperature and initial size of the steel bar, and the liquid steel temperature, on the melting of the individual steel bar, were also investigated.1,2,3,4,12,13,14) In addition, the mass and heat transfer coefficients between the liquid steel and the steel bar under different experimental conditions were also analyzed.15,16,17,18,19) Mathematical model and numerical simulation, as inexpensive and computationally efficient research methods, were widely used to study the melting of steel bar in liquid steel.20,21,22,23,24,25,26,27,28,29) All these simulation methods can intuitively reflect the change of melting morphology of steel bar with time. All the research has certain significance for the melting process of steel scrap in the EAF.
In the process of EAF steelmaking, the charging steel scrap has different shapes and sizes, and is randomly distributed after falling into the molten pool. A 3-dimensional lattice, which has certain hydraulic resistance, is formed around the steel scrap, thus reducing the flow rate of molten steel between the steel scrap. Therefore, there is a certain difference between the melting of steel scrap in the EAF and that of an individual steel bar with regular geometries. On the basis of this, Li et al.30) studied the kinetics of two-bar and multibar melting in liquid steel by means of thermal simulation experiment and phase-field model, and shown that the formation of steel shells around the original steel bars, and agglomeration of these steel shells, dominate the melting process. This study provides a good foundation to investigate the melting process of steel scrap in the EAF under different bulk densities and random stacking conditions.
Based on the single-bar melting experiments introduced in a previous article,1) the present work was studied the melting characteristics of two-bar and multibar samples in liquid steel, and the effect of spacing between the steel bars on the agglomeration of steel shells around the steel bars and the melting rate of steel scrap samples was also analyzed. On the basis of these, a calculation model of melting time of steel scrap in the EAF under different bulk densities and random stacking conditions was established. The research results are of great significance to the melting of steel scrap in EAF.
2. Research Methods
The experimental materials were GCr15 bearing steel, the chemical compositions and melting point were shown in our previous article.1) Two-bar and multibar melting experiments were performed in this study. The two-bar melting experiments were carried out to investigate the effect of the spacing between two cylindrical bars on the melting process; and the multibar melting experiments were designed to investigate the effect of the porosity between the multiple cylindrical bars on the melting process. The experimental apparatus and procedure were the same as our single-bar melting experiments, described in a previous article.1)
2.1. Two-bar Melting Experiments
2.1.1. Thermal Simulation Experiment
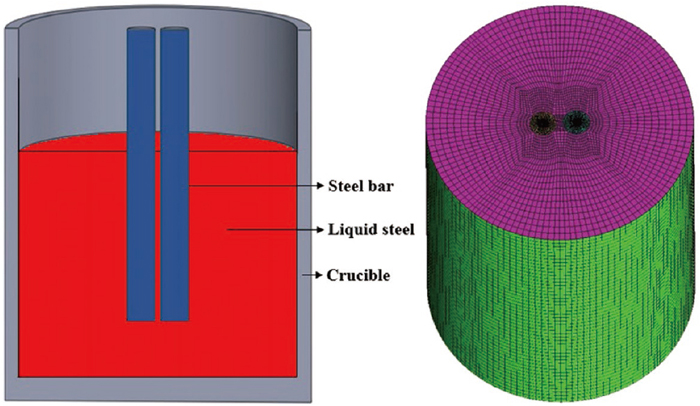
The two-bar sample was made by holding two cylindrical bars with a gripper, as shown in Fig. 1(a). The diameter of the cylindrical bar was 25 mm (Ф25-mm), and the length was 200 mm. The spacing between the cylindrical bars was varied at 2, 3, 4, 5, 6, and 7 mm. During the melting experiment, the immersion depth of the sample in liquid steel was 110 mm, and the temperature of liquid steel was 1873 K. In the process of the melting experiment, the time range required for the complete melting of the sample was preliminarily determined; then the melting experiment was carried out within this time range, and the sample was taken out from the liquid steel every one second to observe its melting morphology. When the immersion part of the sample completely disappears, the corresponding time is the melting time of the sample.

In order to investigate the effect of preheating temperature of steel bar on the melting process, four preheating temperatures were designed, which are 298 (room temperature), 673, 1073, and 1173 K, respectively. The subsequent experimental procedure was the same as the single-bar melting experiments, shown in a previous article.1)
2.1.2. Numerical Simulation
Figure 2 shows the schematic of the two-bar sample melting in the liquid steel, where the grid division area is only the part of the sample immersed in the liquid steel. The mesh is divided by ANSYS ICEM CFE software, and the whole computing area is hexahedral grid. To ensure the accuracy of the numerical simulation, the grid is densified at the interface between the steel bar and the liquid steel. The number of grids in the entire computing domain is about 250000.
(1) Assumptions
1) The liquid steel is an incompressible Newtonian fluid.
2) The crucible avoids no heat loss, and the bottom and side of the crucible are defined as fixed temperature boundary conditions.
3) There is no heat exchange between the molten bath surface and the external gas, and the molten bath surface is defined as a fixed temperature boundary conditions.
(2) Governing Equations
The melting of steel scrap in liquid steel can be solved by solidification and melting model. The model uses the “enthalpy-porosity” method to solve the continuity equation, momentum equation, and energy equation. In the process of steel scrap melting, it can be divided into liquid zone, solid zone, and mushy zone, and the porosity is the volume fraction of the liquid fluid in the grid cell. For the melting process of steel scrap, the liquid phase volume fraction (liquid fraction, the same as below) increases, so the porosity increases from 0 to 1. And when the liquid fraction is 1, the corresponding time is the melting time of the steel scrap. The liquid fraction can be expressed by Eq. (1).31)
|
β={
0
T-
T
solidus
/
T
liquidus
-
T
solidus
1
T<
T
solidus
T
solidus
<T<
T
liquidus
T>
T
liquidus
| (1) |
where
β indicates the liquid fraction;
Tsolidus and
Tliquidus are the solidus temperature and liquidus temperature, respectively, in K.
For the melting process of steel bar in liquid steel, there is a mushy zone between the solidus and liquidus temperatures.31) When the temperature is higher than the liquidus temperature, the steel bar is completely melted. The solidus and liquidus temperatures can be expressed by Eqs. (2) and (3).
|
T
solidus
=
T
s
+
∑
scrap
m
i
Y
i
/
K
i
| (2) |
|
T
liquidus
=
T
s
+
∑
scrap
m
i
Y
i
| (3) |
where
Ts is the melting point of steel bar, in K;
Yi indicates the mass fraction of solute
i;
Ki is the partition coefficient of solute
i;
mi is the slope of the liquidus surface with respect to
Yi, and it can be calculated by the eutectic temperature (
Teutectic) and the eutectic mass fraction (
Yi,eutectic), as shown in
Eq. (4).
|
m
i
=(
T
eutectic
-
T
s
)
/
Y
i,eutectic
| (4) |
The continuity equation, momentum equation, and energy equation can be expressed by Eqs. (5), (6), (7), (8), and (9), respectively.32)
The continuity equation:
|
∂ρ
∂t
+
∂(
ρu
)
∂x
+
∂(
ρυ
)
∂y
+
∂(
ρw
)
∂z
=0
| (5) |
The momentum equation:
|
ρ(
∂u
∂t
+u
∂u
∂x
+υ
∂u
∂y
+ω
∂u
∂z
)
=μ(
∂
2
u
∂
x
2
+
∂
2
u
∂
y
2
+
∂
2
u
∂
z
2
)
-
∂P
∂x
+
S
u
| (6) |
|
ρ(
∂υ
∂t
+u
∂υ
∂x
+υ
∂υ
∂y
+ω
∂υ
∂z
)
=μ(
∂
2
υ
∂
x
2
+
∂
2
υ
∂
y
2
+
∂
2
υ
∂
z
2
)
-
∂P
∂y
+
S
υ
| (7) |
|
ρ(
∂ω
∂t
+u
∂ω
∂x
+υ
∂ω
∂y
+ω
∂ω
∂z
)
=μ(
∂
2
ω
∂
x
2
+
∂
2
ω
∂
y
2
+
∂
2
ω
∂
z
2
)
-
∂P
∂z
+
S
w
| (8) |
The energy equation:
|
ρ(
∂H
∂t
+u
∂H
∂x
+υ
∂H
∂y
+ω
∂H
∂z
)
=
k
c
p
(
∂
2
H
∂
x
2
+
∂
2
H
∂
y
2
+
∂
2
H
∂
z
2
)
+
S
h
| (9) |
where
ρ is the density of liquid steel, in kg·m
−3;
P is the pressure, in Pa;
k is the heat transfer coefficient, in W·m
−2·K
−1;
cp is the specific heat capacity, in J·kg
−1·K
−1;
u, υ and
ω are the velocities of liquid steel in x, y and z directions, respectively, in m·s
−1;
Su,
Sυ and
Sw are the source terms of the momentum equation in x, y and z directions, respectively; and
μ is the dynamic viscosity of liquid steel, in kg·m
−1·K
−1.
During the melting process of steel scrap, the temperature of the liquid steel on the surface of the molten bath decreases, resulting in an increase in the density, which causes the liquid steel to sink; while the liquid steel at the bottom of the molten bath has a high temperature, and the density is relatively small, which causes the liquid steel to move to the surface of the molten bath under the action of buoyancy. The density change leads to natural convection of the liquid steel in the molten bath. In the case of natural convection of liquid steel, the momentum and energy equations are modified as follows:32)
The source terms of the momentum equation can be expressed by Eqs. (10) and (12).
|
S
u
=
(
1-β
)
2
(
β
3
+ε
)
A
mush
u
| (10) |
|
S
υ
=
(
1-β
)
2
(
β
3
+ε
)
A
mush
υ
| (11) |
|
S
w
=
(
1-β
)
2
(
β
3
+ε
)
A
mush
w+
ρ
ref
gα(
T-
T
ref
)
| (12) |
The source terms of the energy equation can be expressed through Eq. (13).
|
S
h
=
ρ
c
p
∂(
ΔH
)
∂t
| (13) |
In the energy equation, the specific enthalpy (H) can be expressed by Eqs. (14), (15), (16).
|
h=
h
ref
+
∫
T
ref
T
c
p
dT
| (15) |
Where
β indicates the liquid fraction;
α is the volume expansion coefficient, in K
−1;
h is the sensible heat enthalpy, in J·kg
−1; Δ
H is the latent heat enthalpy, in J·kg
−1;
cp is the specific heat, in J·kg
−1·K
−1;
Tref is the reference temperature, in K;
ρref is the density of liquid steel at reference temperature, in kg·m
−3;
href is the reference specific enthalpy, in J·kg
−1;
Amush is the continuous number in the mushy zone, and its value is between 10
4 to 10
7; and the value of
ε is between 0 to 0.0001.
(3) Computation Methodology
The physical properties of GCr15 bearing steel at 1873 K were obtained by previous study33) and JMatPro software, as shown in Table 1. In addition, the change of physical properties of steel bar with temperature was calculated by JMatPro software, as shown in Table 2.
Table 1. Physical properties of GCr15 bearing steel at 1873 K.
| Physical properties | Density
(kg·m−3) | Specific heat
(J·kg−1·K−1) | Thermal conductivity
(W·m−1·K−1) | Viscosity
(Pa·s) |
|---|
| Value | 6873.75 | 845.59 | 35.04 | 4940 |
Table 2. Changes of physical properties of steel bar with temperature.
| Physical properties | Temperature (K) | Value |
|---|
| Density (kg·m−3) | 298≤T<403 | 7706.01+0.4122T |
| 403≤T<1598 | 7974.12−0.3990T |
| 1598≤T | 8158.63−0.6860T |
| Specific heat (J·kg−1·K−1) | 298≤T<398 | 376.74+2.47T |
| 398≤T<1598 | 472.71+0.13T |
| 1598≤T | 390.45+0.24T |
| Thermal conductivity (W·m−1·K−1) | 298≤T<408 | 33.60−0.029T |
| 408≤T<1693 | 16.71+0.00991T |
| 1693≤T | 6.95+0.015T |
| Viscosity (Pa·s) | 298≤T<1603 | 0 |
| 1603≤T<1703 | 101.44−0.05948T |
| 1703≤T | 0.0189−7.44×10⁻⁶T |
The heat of fusion of GCr15 bearing steel bar is 272000 J·kg−1, and the solidus and liquidus temperatures are 1601 K and 1738 K, respectively.33) During the numerical simulation, the pressure-velocity coupling scheme was achieved with the SIMPLE algorithm. A standard discretization method was used for pressure, and the momentum and energy equations were solved by the second order upwind method. The under-relaxation factors of the pressure equation, the density equation, and the momentum equation are all 0.3. In this study, when the residuals of energy equation and other dependent variable equation were less than 10−8 and 10−3, respectively, the numerical simulation was considered to be convergent.
2.2. Multibar Melting Experiments
The multibar sample was fabricated by welding seven Ф10-mm steel bars to the steel plate, as shown in Fig. 1(b). The spacings (L) between the cylindrical bars in the four samples were 18, 20, 25, and 30 mm, respectively. Li et al.4) showed that the porosity of multibar sample, which represents the volume fraction of empty space between seven steel bars that is filled with liquid steel during immersion, can be calculated based on the distance between steel bars, and the calculation formula is as follow:
|
P=1-(
A
b
×
H
i
)/(
A
h
×
H
i
)
=1-(
A
b
/
A
h
)
| (17) |
where
P indicates the porosity of sample;
Ab represents the total cross-sectional area of the steel bars, in m
2;
Ah is the cross-sectional area of the hexagonal envelope of the entire assembly, in m
2;
Hi is the immersed depth of the multibar sample in liquid steel, and the value is 110 mm.
According to Eq. (17), the porosity values of the multibar samples used in the melting experiments were 0.62, 0.68, 0.78, and 0.84, corresponding to the spacings between steel bars of 18, 20, 25 and 30 mm, respectively. During the melting experiments, the liquid steel temperature was 1873 K.
3. Results and Discussion
3.1. Two-bar Melting Experimental Results and Analysis
3.1.1. Model Validation and Error Analysis
Table 3 compares the melting time of two-bar samples with different spacings obtained by thermal simulation experiment and numerical simulation. The numerical simulation results are slightly less than the data measured by the thermal simulation experiments, this may be because the numerical simulation ignores the heat loss on the wall of the crucible and the surface of the molten bath. However, the error between the thermal simulation experimental results and the numerical simulation results is no greater than 7.84 pct, and the variation trend with the spacing of samples is similar. Hence, it can be conclude that the numerical simulation results are reasonably consistent with the thermal simulation experimental results.
Table 3. Comparison of the melting time of two-bar samples obtained by thermal simulation experiment and numerical simulation.
| Spacing (mm) | 2 | 3 | 4 | 5 | 6 | 7 |
|---|
| Thermal simulation experiment (s) | 54 | 53 | 52 | 51 | 46 | 44 |
| Numerical simulation (s) | 50 | 49 | 48 | 47 | 43 | 42 |
| Error (pct) | 7.41 | 7.55 | 7.69 | 7.84 | 6.52 | 4.54 |
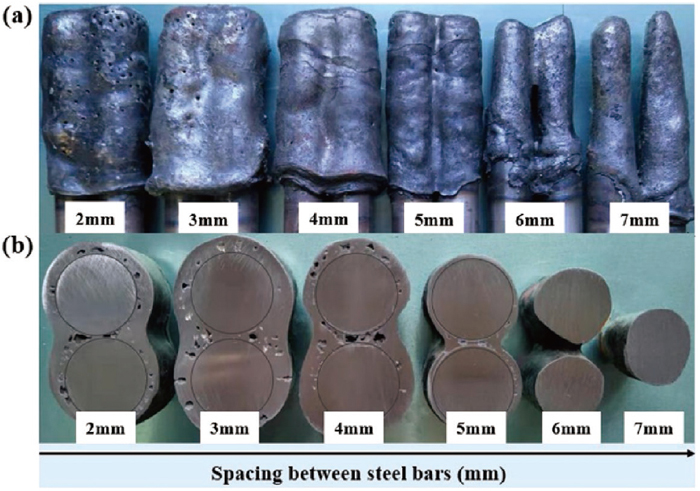
Figure 3 shows the melting morphology and the cross-sectional morphology of two-bar samples with different spacings after 10 seconds of immersion in the liquid steel. Here, the initial temperature of the sample is 298 K, and the liquid steel temperature is 1873 K. Three different melting scenarios were observed as a function of the spacing between the two bars:
(1) When the spacing was less than 6 mm, solidified steel shells formed around the two bars, and the steel shells agglomerated.
(2) When the spacing was 6 mm, the solidified shells around the two bars was partially agglomerated, and the steel bars in the middle of the immersion part existed independently.
(3) When the spacing between the two bars reached 7 mm, the two steel bars existed independently after the sample was immersed in the liquid steel.
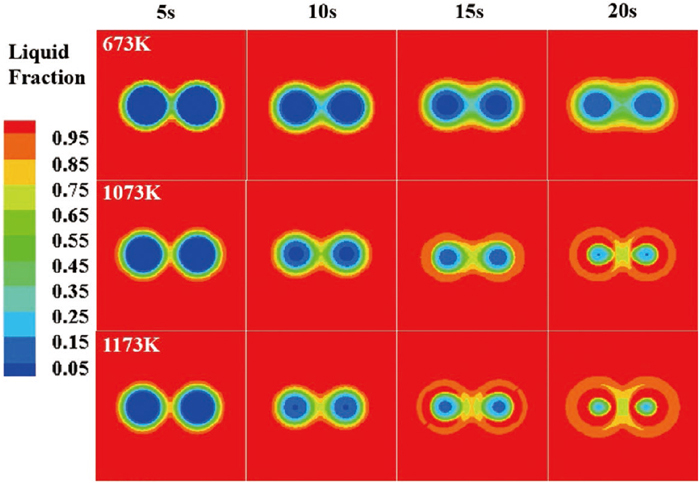
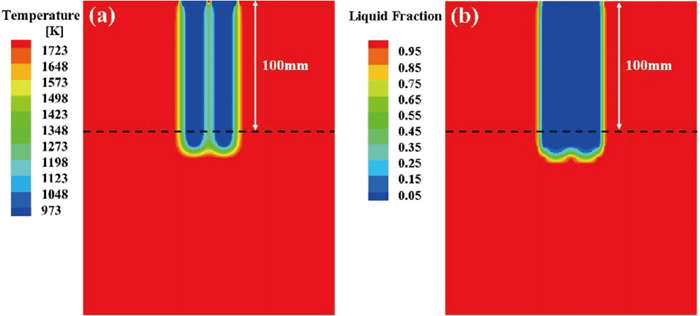
Figure 4 presents the longitudinal section diagrams of the temperature and liquid fraction of two-bar sample with a spacing of 4 mm after being immersed in liquid steel for 10 seconds. It can be seen that the steel shells formed around the steel bars agglomerated. In order to visually observe the changes in the temperature and liquid fraction of the inner and outer layers of the two-bar samples with different spacings after being immersed in liquid steel, the samples were cut along the cross-section at a position of 100 mm below the immersion part, as shown by the black dotted line in Fig. 4. Figures 5 and 6 show the temperature and liquid fraction profiles of two-bar samples with different spacings after 10 seconds of immersion in the liquid steel. When the spacing is less than 6 mm, the steel shells of two bars agglomerated, causing the two-bar samples to form large scrap bundles, the numerical simulation results are in agreement with the experimental results; when the spacing is increased to 6 mm and above, the agglomeration degree of the steel shells around the two bars is lower than that of the samples with the spacing less than 6 mm, and the two steel bars tend to separate independently, the results are consistent with those reported by Li et al.,30) which showed that when the spacing is 6 mm and above, the steel shells of two bars first agglomerated but then separated independently.


To further explain three different melting scenarios, the melting process of two-bar samples with spacings of 5, 6 and 7 mm was selected for analysis. Figure 7 shows the liquid fraction profile of two-bar samples after being immersed in liquid steel for different times. When the spacing is 5 mm, the steel shells of two bars agglomerated and the whole sample melted as one piece. The melting process is also applicable to two-bar samples with spacings less than 5 mm. When the spacing is increased to 6 mm and above, the steel shells around the two bars first agglomerated, and then separated independently after about 20 seconds of immersion, after that, the two steel bars are melted independently. Based on the above analysis, it can be concluded that an increase in the spacing between the steel bars up to 6 mm can effectively reduce or eliminate the adverse effect of agglomeration of steel shells around the steel bars on the melting process of steel scrap samples.

Figure 8 shows the melting time of two-bar samples vs spacing between the two bars. It can be seen that the thermal simulation experimental results are consistent with the numerical simulation results. When the spacing is increased from 2 mm to 5 mm, the melting time decreased very slightly as a function of the spacing, and the decrease is only about 5.5 pct. This is because the melting process of the samples with spacing less than 6 mm is the same, corresponding to the first scenario, which was described previously. While when the spacing is increased from 5 mm to 6 mm, the decrease rate of the melting time reaches about 10 pct. Since the agglomeration of the steel shells around the steel bars is an important reason that hinders the melting of the two-bar samples.3,34) The thickness and existence time of the agglomeration of steel shells around the two-bar sample with a spacing of 5 mm are greater than those of the sample with a spacing of 6 mm, therefore, the melting time significantly decreases as the spacing increases from 5 mm to 6 mm. When the spacing is increased from 6 mm to 7 mm, the melting time is only reduced by about 4 pct. This is because for the two-bar sample with a spacing of 6 mm, the steel shells of two bars firstly agglomerated but then separated at the late stage of melting, so the agglomeration of steel shells has less effect on the melting of sample. In addition, the two-bar sample with a spacing of 7 mm melted relatively independently. Therefore, the melting time decreased very slightly as the spacing increases from 6 mm to 7 mm. The variation trend of the melting time with the spacing is in agreement with a previous study.3)

In the condition of different preheating temperatures, the melting time of two-bar samples with different spacings is shown in Fig. 9. It can be known that an increase in the preheating temperature is beneficial to melting the samples, and the relevant mechanism has been described in our previous published article.1) In addition, when the preheating temperature is 673 K, the melting time decreased very slightly as the spacing between the two bars increased from 2 mm to 5 mm; while when the spacing is increased from 5 mm to 6 mm, the melting time reduced by 5 seconds, and the reduction reached 12 pct; when the spacing is further increased to 7 mm, the melting time did not change significantly, compared to the sample with a spacing of 6 mm, the melting time is only shortened by about 5 pct. The variation trend of the melting time with the spacing at the preheating temperature of 673 K is similar to that at the room temperature (298 K), which was described previously. However, when the preheating temperature is increased to 1073 K and above, the melting time decreased very slightly with the increase of the spacing. Taking the melting of sample at the preheating temperature of 1073 K as an example, the melting time only decreased by 3 seconds as the spacing increased from 2 mm to 7 mm. The above results indicate that an increase in the preheating temperature of the samples can reduce or eliminate the adverse effect of the spacing on the melting process.

To further illustrate the changes of melting morphology of two-bar samples with different spacings at different preheating temperatures, the changes in the liquid fraction of samples with time, under two critical spacing of 5 mm and 6 mm, were compared, and the results are shown in Figs. 10 and 11, respectively. In the case of preheating temperature of 673 K, the steel shells around the two-bar sample with a spacing of 5 mm firstly agglomerated, and then remelted and separated after immersion for about 10 seconds, after that, the two bars were melted separately; while for the two-bar sample with a spacing of 6 mm, each bar melted relatively independently of the others. Therefore, the melting time of samples with preheating temperature of 673 K decreased significantly as the spacing increased from 5 mm to 6 mm. However, when the preheating temperature is increased to 1073 K and above, for the samples with spacing of 5 mm and 6 mm, the interaction between the two bars was weak and each bar melted independently, so the melting time did not decrease significantly as the spacing increased from 5 mm to 6 mm. The above analysis further illustrates that increasing the preheating temperature can reduce or eliminate the adverse effect of the agglomeration between steel bars on the melting process of samples.

Figure 12 shows melting time of multibar samples with different porosity. The melting time of the samples generally increased with decreasing the porosity. When the porosity of sample is 1, each individual steel bar melts independently, and the melting time of the sample was close to that of each individual steel bar. When the porosity is decreased to 0.84, each bar of the sample melted relatively independently of the others, as shown in Fig. 13(d), and the interaction between the steel bars was very weak. Therefore, the melting time only increased by 2 seconds as the porosity decreased from 1 to 0.84. As the porosity is further decreased to 0.78, the melting time increased by 10.5 pct compared to the sample with a porosity of 0.84. This is because a decrease in the porosity causes an increase in the interaction between the steel bars, which slows down the melting rate of the sample, but each steel bar in the sample still melted relatively independently. When the porosity is decreased from 0.78 to 0.68, the melting time increased significantly, and the increase reached 47.6 pct. Since the spacing between the steel bars of the sample with a porosity of 0.68 is small, the outer steel bars absorbed a large amount of heat of the liquid steel, which reduced the heat transfer rate from the liquid steel to the central steel bar, resulting in the agglomeration of a large amount of liquid steel around the central steel bar, as shown in Fig. 13(b), thus significantly increasing the melting time. As the porosity decreased further, the agglomerate region of steel shell continued to enlarge and spread through the whole multibar sample, resulting in the all steel bars to agglomerate into one piece, as shown in Fig. 13(a). Therefore, the melting time increased rapidly with decreasing the porosity from 0.68 to 0.62. The variation trend of the melting time with the porosity of multibar samples was consistent with a previous study.3) From the above analysis, it can be known that the agglomeration of steel shells around the steel bars is the main reason for the increase of the melting time of multibar samples.

The preheating of 100 pct steel scrap in modern EAF steelmaking was realized, and the preheating temperature reached 673 to 873 K. In addition, the large “hot heel” and flat bath smelting were generally adopted in EAF steelmaking, the molten bath can be formed at the beginning of smelting, and the steel scrap melted in the liquid steel. Therefore, there are some similarities between the thermal simulation experiment of steel scrap melting and the melting process of steel scrap in EAF. However, in the process of EAF steelmaking, the charging steel scrap has different shapes and sizes, and is randomly distributed after falling into the molten pool. In addition, the EAF is continuously charged and the steel scrap is charged at a high speed, which can efficiently reduce the agglomerate phenomenon of steel shells around the steel scrap. These phenomena lead to a certain differences between the thermal simulation experiment and the EAF steelmaking. Hence, it is necessary to establish an equivalent model between the steel scrap melting in EAF and the thermal simulation experiment, and calculated the melting time of the steel scrap in the EAF based on the thermal simulation experimental results.
For the continuous charging and smelting process of the EAF, the melting time of the steel scrap can be calculated by the heat balance formula of the melting process, as shown in Eq. (18).35,36) The left side of Eq. (18) indicates the heat obtained by steel scrap in time τ, and the right side indicates the heat consumption for melting the steel scrap at a temperature of tav. And it is assumed that the heat evolved during the solidification of the steel shell around the steel scrap is equal to the heat consumed for the melting down of the steel shell.
|
α(
T
l
-
T
av
)
Fτ=M[
H+
c
P
(
T
av
-
T
s
)
]
| (18) |
where
α indicates heat transfer coefficient, W·m
−2·K
−1;
Tl is the temperature of liquid steel, K;
Tav is the average temperature of melting steel scrap, K;
F indicates the total surface area of the steel scrap, m
2;
τ is the melting time, min;
M is the mass of steel scrap, kg;
H is the latent heat of melting, J·g
−1;
cp is the special heat capacity, J·kg
−1·K
−1;
Ts is the initial temperature of the steel scrap, K.
3.3.1. Establishment of Equivalent Model
As shown in Fig. 12, an increase in the porosity, decreasing the melting time of multibar samples, and the melting time asymptotically approached the duration of melting of the individual steel bar. However, in the actual arc furnace smelting process, steel scrap is continuously charged into the quite limited zone of steel bath, which is no more than 2.5 to 3.0 m3.35) Therefore, it is impossible for the porosity between steel scrap to be 1. Zhu et al.37) showed that when the bulk density of steel scrap in the EAF is about 0.74 t·m−3, the melting rate is the fastest. According to Eq. (19),35,36) when the bulk density is about 0.74 t·m−3, the corresponding porosity of steel scrap is about 0.91. As can be seen from Fig. 12, the melting time of steel scrap with a porosity of 0.91 is approximately equal to that of steel scrap with a porosity of 1.
where
ρV is the bulk density of steel scrap, t·m
−3; 7.9 indicates the density of steel scrap, in g·cm
−3.
The steel scrap melting process of thermal simulation experiment and electric arc furnace are both in accordance with the relationship shown in Eq. (18), and the total surface area F and total mass M are the two most basis parameters of steel scrap, therefore, the relationship between F and M can be established. When the bulk density of steel scrap in the EAF is 0.74 t·m−3, the ratio of F to M is about 25 m2·t−1; while for the steel bars with a diameter of 20 to 25 mm, the ration of F to M is between 26 to 27 m2·t−1, which is close to 25 m2·t−1. Therefore, steel bars with diameters of 20 to 25 mm can be equivalently used to replace the steel scrap in the EAF, thus approximately obtaining the melting time of the steel scrap in the EAF.
From Eq. (18), it can be known that the melting time is closely related to the preheating temperature of steel scrap, the liquid steel temperature, and the heat transfer coefficient between the liquid steel and the steel scrap. While the stirring intensity of injected gas is the main factor affecting the heat transfer rate between the between the liquid steel and the steel scrap, that is, the melting time of the steel scrap is closely related to the flow rate of the injected gas. In addition, during the EAF smelting process, the melting time is greatly affected by the porosity between the steel scraps. Therefore, it is necessary to establish the relationship between the melting time of steel scrap and porosity, preheating temperature, liquid steel temperature and stirring intensity.
(1) Coefficient KP
The coefficient KP indicates the ratio of the melting time of the multibar sample with a porosity of P to the melting time of the sample with a porosity of 1. For Fig. 12, the relationship between the coefficient KP and the porosity P of the multibar sample can be obtained, as shown in Fig. 14.
(2) Coefficient KPT
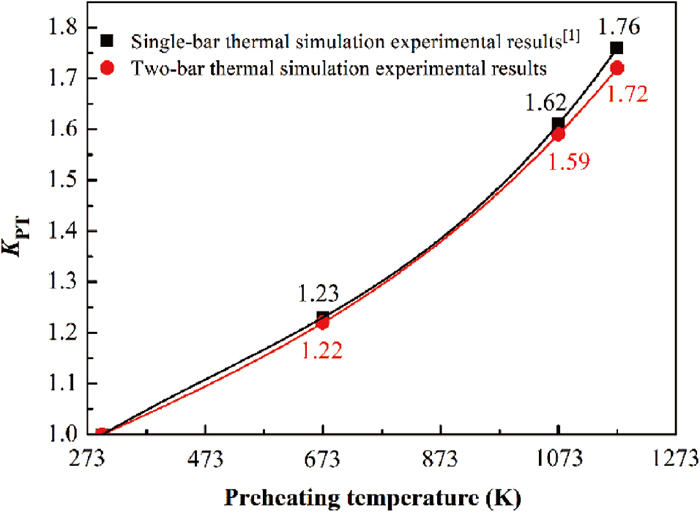
The coefficient KPT refers to the ratio of the melting time of the steel bar at room temperature to the melting time of steel bar at different preheating temperatures. For the thermal simulation experiments, the relationship between the coefficient KPT and the preheating temperature of steel bar can be shown in Fig. 15.
(3) Coefficient KLT
The coefficient KLT is the ratio of the melting time of the steel bar immersed in the liquid steel with a temperature of Tl to the melting time of steel bar immersed in the liquid steel with a temperature of 1873 K. The relationship between the coefficient KLT and the liquid steel temperature can be obtained by single-bar thermal simulation experiment, as shown in Fig. 16.
(4) Coefficient Kα
The coefficient Kα refers to the ratio of the melting time of the steel bar under different flow rates of stirring gas to the melting time of the steel bar under natural convection condition. In the single-bar thermal simulation experiment, argon gas with flow rates of 0, 2.0, 4.0 and 6.0 L·min−1, was injected into the liquid steel from the side wall of the crucible pool, respectively. The results show that in the case of argon gas flow rates of 0, 2.0, 4.0 and 6.0 L·min−1, the melting time of the steel bars is 52, 47, 42, and 38 seconds, respectively. The relationship between the coefficient Kα and the flow rate of stirring gas can be obtained by single-bar thermal simulation experiment, as shown in Fig. 17.
Based on the coefficients KP, KPT, KLT and Kα, the melting time of steel scrap in the EAF can be calculated by Eq. (20).
|
τ=
τ
i
×
K
P
×
K
LT
K
PT
×
K
α
| (20) |
where
τ is the melting time of steel scrap in the EAF, min; and
τi is the melting time of single steel bar of initial temperature of 298 K immersed in the liquid steel of 1873 K and without gas stirring in the liquid steel. For a single GCr15 bearing steel bar with a diameter of 20 mm, the melting time is 41 seconds, that is, the
τi is 41 seconds.
3.3.2. Calculation Example of Melting Time of Steel Scrap in the EAF
Taking a 150-ton Consteel direct current electric arc furnace in a Chinese steel plant as an example, and the main process parameters are as follows: the steel scrap is continuously charged into the liquid steel; the tapping weight (Mt) is 150 tons; the hot heel is 40 tons; the mass of steel scrap (Ms) consumed for one heat is 161 tons; the smelting cycle is 52 min; the melting time of steel scrap is about 31 min; and the volume of charging zone (Vt) is 4.2 m3. In addition, the bulk density of steel scrap (ρV) is 0.70 t·m−3, the porosity calculated according to Eq. (19) is 0.91, and the corresponding KP value is 1.07; the preheating temperature of steel scrap is around 573 K, and it can be known from Fig. 15 that the value of KPT is about 1.17; the average temperature of the liquid steel after the steel scrap is melted is about 1853 K, so the value of KLT can be obtained from Fig. 16 is about 1.24; it is assumed that the stirring intensity of the liquid steel in the EAF is equivalent to that of the liquid steel with a stirring gas flow rate of 6 L·min−1 in the thermal simulation experiment, so the value of Kα is 1.38.
Based on the above known conditions, the mass of steel scrap in the charging zone (Mc) can be obtained by using Eq. (21), which is 2.94 tons.
The time required for the complete melting of 2.94 tons steel scrap in the charging zone is as follow:
|
τ=
τ
i
×(
K
P
×
K
LT
)
/(
K
PT
×
K
α
)
=34 seconds=0.57 min
| (22) |
The melting rate of the steel scrap in the charging zone can be calculated by Eq. (23), and the value is 5.16 t·min−1 after being substituted into the parameters.
Therefore, the melting time of steel scrap (τtol) for one heat in the EAF can be expressed by Eq. (24).
The melting time of the steel scrap obtained by the calculation model is 31 min, which is the same as the melting time of steel scrap in the actual EAF, indicating the accuracy of the calculation model.
4. Conclusions
In this study, the melting characteristics of the two-bar and multibar samples in liquid steel were studied, and the effect of spacing between the steel bars on the melting rate of steel scrap sample was analyzed. On the basis of these, a mathematical model of the steel scrap melting process in the EAF under different bulk densities and random stacking conditions was established to predict the melting time of steel scrap. The following main conclusions can come out from this study.
(1) The agglomeration of steel shells around the steel bars is the main reason for the increase of the melting time of steel scrap samples. Increasing the spacing between the steel bars to 6 mm and above, and improving the preheating temperature of the steel bars to 1073 K and above, can effectively reduce or eliminate the adverse effect of agglomeration of steel shells around the steel bars on the melting process of steel scrap samples, thus greatly shortening the melting time.
(2) An increase in the porosity between the steel bars can effectively increase the melting rate of steel scrap samples. When the porosity reached 0.84 and above, the melting time is close to that of an individual steel bar.
(3) Based on the thermal simulation experimental results of single-bar, two-bar and multibar samples, the calculation model of the melting time of the steel scrap in the EAF was established. The mathematical model can accurately calculate the melting time of the steel scrap in the EAF.
Acknowledgements
The authors gratefully acknowledge the support by the Key Projects of National Natural Science Foundation of China (NSFC, Nos. 51734003 and 51574190) and Fundamental Research Funds for the Central Universities FRF-TP-18-009C1.
References
- 1) X. J. Xi, S. F. Yang, J. S. Li, X. K. Chen and M. L. Ye: Ironmaking Steelmaking, 47 (2020), 442.
- 2) Y. N. Xuan and Q. Yue: Resour. Conserv. Recycl., 120 (2017), 186.
- 3) J. H. Li: Ph.D. thesis, McMaster University, (2007), https://fjour.blyun.com/views/specific/3004//FThesisDetail.jsp?dxNumber=350100193659&d=CC38633D19223F5E451AD7D7E532DABB, (accessed 2007-02-01).
- 4) J. H. Li, N. Provatas and G. Brooks: Metall. Mater. Trans B, 36 (2005), 293.
- 5) M. Kosaka and S. Minowa: Tetsu-to-Hagané, 53 (1967), 983 (in Japanese).
- 6) R. I. L. Guthrie and P. Stubbs: Can. Metall. Q., 12 (1973), 465.
- 7) E. Specht and R. Jeschar: Steel. Res., 64 (1993), 28.
- 8) M. Shin, J. S. Oh, J. Lee, S. Jung and J. Lee: Met. Mater. Int., 20 (2014), 1139.
- 9) G. S. Wei, R. Zhu, T. P. Tang and K. Dong: Ironmaking Steelmaking, 46 (2019), 609.
- 10) M. Gao, S. F. Yang and Y. L. Zhang: Ironmaking Steelmaking, 47 (2020), 1006. https://doi.org/10.1080/03019233.2019.1659003
- 11) F. M. Penz, J. Schenk, R. Ammer, G. Klosch, K. Pastucha and M. Reischl: Materials, 12 (2019), 1358.
- 12) Y. U. Kim and R. D. Pehlke: Metall. Trans., 5 (1974), 2527.
- 13) K. Mori and T. Sakuraya: Trans. Iron Steel Inst. Jpn., 22 (1982), 984.
- 14) J. K. Wight: Metall. Mater. Trans. B, 20 (1989), 363.
- 15) R. I. L. Guthrie and L. Gourtsoyannis: Can. Metall. Q., 10 (1971), 37.
- 16) Y. U. Kim and R. D. Pehlke: Metall. Trans. B, 6 (1975), 585.
- 17) M. Kawakami, K. Takatani and L. C. Brabie: Tetsu-to-Hagané, 85 (1999), 658 (in Japanese).
- 18) F. M. Penz, J. Schenk, R. Ammer, G. Klosch and K. Pastucha: Metals, 8 (2018), 1078.
- 19) F. M. Penz, R. P. Tavares, C. Weiss, J. Schenk, R. Ammer, K. Pastucha and G. Klosch: Int. J. Heat Mass Transf., 138 (2019), 640.
- 20) F. M. Penz and J. Schenk: Steel Res. Int., 90 (2019), 1900124.
- 21) Y. K. Wu and M. Lacroix: Int. Commun. Heat Mass Transf., 22 (1995), 517.
- 22) M. Ostman: Master’s thesis, Luleå University of Technology, (2006), http://www.diva-portal.org/smash/get/diva2:1020098/FULLTEXT01.pdf, (accessed 2016-10-04).
- 23) F. Qian, B. Farouk and R. Mutharasan: Metall. Mater. Trans. B, 26 (1995), 1057.
- 24) Y. A. Stankevich, V. I. Timoshpol’skii, N. V. Pavlyukevich, M. G. German and P. S. Grinchuk: J. Eng. Phys. Thermophys., 82 (2009), 221.
- 25) H. Akseki: Master’s thesis, McMaster University, (2010), https://macsphere.mcmaster.ca/handle/11375/9026, (accessed 2010-10-01).
- 26) N. Arzpeyma, O. Widlund and M. Ersson: ISIJ Int., 53 (2013), 48.
- 27) A. K. Shukla, B. Deo and D. G. C. Robertson: Metall. Mater. Trans. B, 44 (2013), 1407.
- 28) A. Kruskopf: Metall. Mater. Trans. B, 46 (2015), 1195.
- 29) A. Kruskopf and L. Holappa: Metall. Res. Technol., 115 (2018), 201.
- 30) J. H. Li and N. Provatas: Metall. Mater. Trans. B, 39 (2008), 268.
- 31) Ansys Fluent User’s Guide, Ansys, Canonsburg, PA, (2015), 1297.
- 32) L. Y. Zhang: Master’s thesis, Tianjin University, (2012), http://cdmd.cnki.com.cn/Article/CDMD-10056-1013041121.htm, (accessed 2013-7-31) (in Chinese).
- 33) X. B. Li, H. Ding and Z. Y. Tang: J. Mater. Metall., 9 (2010), 241 (in Chinese).
- 34) O. J. P. González, Marco A. Ramírez-Argáez and A. N. Conejo: ISIJ Int., 50 (2010), 9.
- 35) Y. N. Toulouecski and I. Y. Zinurov: Fuel Arc Furnace (FAF) for Effective Scrap Melting, Springer, Singapore, (2017), 51.
- 36) Y. N. Toulouecski and I. Y. Zinurov: Electric Arc Furnace with Flat Bath, Springer, Cham, (2015), 45.
- 37) H. L. Liu and R. Zhu: Equipment and Technology for Short – Process Steelmaking in Electric Arc Furnace, Metallurgical Industry Press, Beijing, (2012), 5 (in Chinese).