Abstract
In-situ observation of fatigue crack growth behavior under ΔK-constant cyclic loading in Paris regime for two Thermo-Mechanical Control Process (TMCP) steels with different grain size was carried out. It was found from the results that crack closure dominantly contributed to fatigue crack growth resistance in the fine grain material, while crack tip stress shielding induced by crack deflection and crack branching dominantly contributed to fatigue crack growth resistance in the coarse grain material. The electron back scatter diffraction (EBSD) analysis revealed that crack deflection and crack branching in the coarse grain material were induced in the grain with (101) crystal orientation intensively under co-existence of the grain with (001) crystal orientation and also along the grain boundary between the grains with (101) and (001) crystal orientations. Hence, higher content ratio of the grains with (001) crystal orientation could contribute to higher crack growth resistance.
1. Introduction
Thermo-mechanical control process (TMCP) is defined as a technique for controlling microstructure by combining controlled rolling and controlled cooling processes, which has been widely applied in the commercial fabrication of structural steel plates. This process can control mechanical properties, such as tensile strength, yield stress/tensile stress ratio, fracture toughness as well as fatigue strength through microstructural modification.1,2,3,4,5,6)
Fatigue characteristics is of importance to be clarified in the structural applications of TMCP steels. It is generally known that microstructural influence on fatigue crack growth behavior is significant in threshold region but not much in Paris regime. However, detail of microstructural influence on fatigue crack growth behavior in Paris regime has not yet been well understood in TMCP steels. In the previous studies on TMCP steels, effects of banded ferrite-pearlite structure,7) networked and distributed pearlite structures,8) size and spacing of uniformly distributed pearlite particles9) and hardness of second phase particles10) on fatigue crack growth behavior had been investigated. These previous studies have revealed that fatigue crack growth resistance in Paris regime is high for (1) the banded ferrite-pearlite steel with narrow pearlite band spacing, (2) distributed pearlite structure compared to networked pearlite structure, (3) larger size and spacing of uniformly distributed pearlite structure, and (4) harder second phase particle. The similar effects of pearlite particle morphology have been observed in the references.11,12,13) It has been also clarified that these enhanced fatigue crack growth resistances are attributed to the effects not only of crack closure but also of crack tip stress shielding due to crack deflection, branching and friction contacts of crack surfaces in the crack wake.14)
There have been lots of works on crack closure and crack tip stress shielding behavior from the mechanical point of view.15,16) The crack deflection and crack branching, which induce crack closure and crack tip stress shielding behavior, are known to be affected by microstructures, such as grain size, second phase particle, crystal orientation, etc. For example, if the grain size is large and comparative order of the cyclic plastic zone size, slip behavior of the grain ahead of the crack tip will strongly depend on crystal orientations of the grain ahead of the crack tip as well as the surrounding grains, which will consequently influence the crack deflection and branching behavior. However, the effects of grain size and crystal orientation of ferrite grain in front of the fatigue crack tip on fatigue crack growth behavior, such as crack deflection and branching behavior, have not yet been clarified in detail, while the effect of grain boundary morphology has been reported.17,18,19)
In the present study, to investigate the effects of grain size and crystal orientation on fatigue crack deflection and branching behavior, two TMCP steels were prepared: one has the small ferrite grain size compared to the cyclic plastic zone size and the other has the large ferrite grain size compared to the cyclic plastic zone size. ΔK-constant fatigue crack growth tests were carried out in a scanning electron microscope (SEM) chamber combined with electro-hydraulic fatigue test machine for in situ observation of detailed fatigue crack growth behavior. Effects of grain size and crystal orientation on crack closure and crack tip stress shielding behavior were discussed by evaluating the effective stress intensity factor range and the effective crack tip stress intensity factor range. Electron back scatter diffraction (EBSD) analysis was also carried out along with the fatigue crack growth tests for clarifying the influence of crystal orientation on fatigue crack deflection and crack branching behavior.
2. Experimental Procedure
2.1. Materials and Specimen Geometry
Two kinds of low carbon structural steel plates (Steel A and Steel B) with different grain size produced under two different process conditions of TMCP were used. The microstructures of Steel A and Steel B are shown in Fig. 1. As found from the figure, Steel A has fine hard particles (pearlite/bainite particles) dispersed in fine ferrite grains, while Steel B has coarse island-like second phases of pearlite dispersed in coarse ferrite grains. The average grain sizes (av) of ferrite phase for Steel A and Steel B determined by the linear intercept method were 5 μm and 30 μm, respectively. The chemical compositions and mechanical properties of the steels are shown in Tables 1 and 2, respectively. As seen from Table 2, the yield stresses for two steels are relatively high and their ratios of yield stress σy and tensile strength σUTS, (σy/σUTS), are approximately 0.8, while Steel B with larger grain size shows lower yield stress and tensile strength as well as larger elongation compared to Steel A with smaller grain.
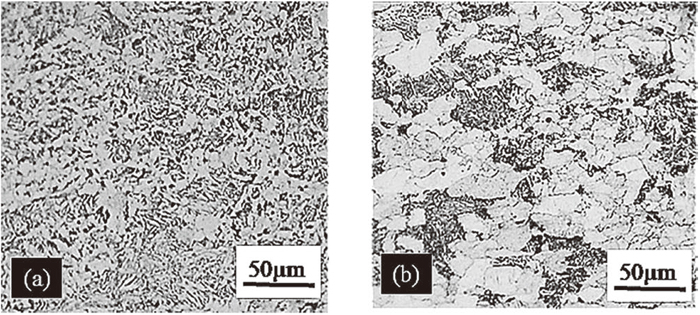
Table 1. Chemical composition of the steels used (wt%).
| C | Si | Mn | P | S |
|---|
| Steel A | 0.12 | 0.29 | 1.34 | 0.011 | 0.002 |
| Steel B | 0.085 | 0.26 | 1.55 | 0.010 | 0.002 |
Table 2. Mechanical properties of the steels used.
| Yield stress (MPa) | Tensile strength (MPa) | σy/σUTS | Elongation (%) |
|---|
| Steel A | 508 | 621 | 0.81 | 25.0 |
| Steel B | 446 | 543 | 0.82 | 30.8 |
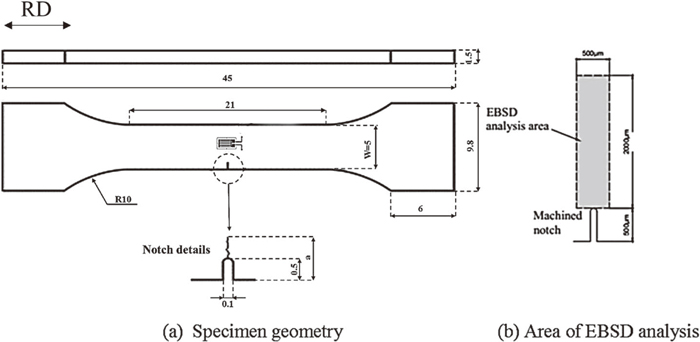
A single edge cracked plate tension (SECT) specimen with a width of 5 mm and a thickness of 1.5 mm was used for the fatigue crack growth test, geometry of which is shown in Fig. 2(a). The cyclic loading was applied parallel to rolling direction (RD). The width and depth of the notch introduced by an electric discharge machine (EDM) were 0.1 mm and 0.5 mm, respectively. Before the test, all specimen surfaces were ground by abrasive papers and polished by diamond suspension to achieve mirror-like surface and then etched with 2% nital acid to reveal microstructure for in-situ SEM observation.
2.2. ΔK-constant Fatigue Crack Growth Test
In order to investigate the fatigue crack growth behavior in Stage II, ΔK-constant fatigue crack growth tests of the two steels were carried out under a sinusoidal wave form of cyclic loading with a stress ratio R = 0.1 and a frequency of 2 Hz. Since the present case of specimen geometry and loading form could be assumed as the single-edge-cracked plate under remote uniform tension, Brown’s equation20) was used for calculating stress intensity factor K.
|
K
I
=σ
πα
F
I
(α), α=α/W
| (1) |
Where when KI is the mode I stress intensity factor, a is the crack length, W is the specimen width and σ is the remote uniform stress applied to the specimen and FI is a geometrical correction factor21) and given as:
|
F
I
(α)=1.12-0.231α+10.55
α
2
-21.72
α
3
+30.39
α
4
| (2) |
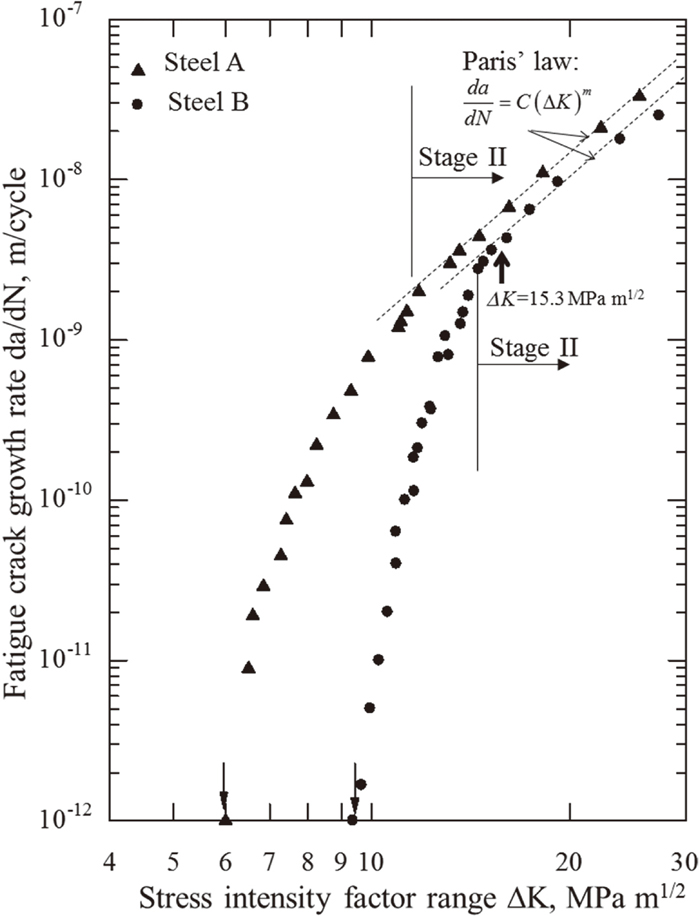
In the present fatigue crack growth tests, since the range of a/W was 0.2 to 0.3, the accuracy of Eq. (1) was within ±0.5%.21) The value of ΔK = 15.3 MPa m1/2 was selected for the ΔK-constant fatigue crack growth test in Stage II by referring the whole range of fatigue crack growth curve obtained in the preliminary test, as can be shown in Fig. 3. In the ΔK-constant fatigue crack growth test, a constant cyclic load was first applied to obtain a certain length of pre-crack (about 0.8 mm, which is about 8 times of notch width), and then the constant stress intensity factor range of ΔK = 15.3 MPa m1/2 was applied. During the test, the cyclic load was reduced from the previous load to maintain the constant ΔK value every crack increment of 400 μm. For calculating fatigue crack growth rate, the number of cycles for every crack increment of 400 μm was collected during the ΔK-constant fatigue crack growth test. In the present fatigue crack growth tests, the small scale yielding condition for fatigue crack22) was satisfied.
To investigate the influence of the ratio of cyclic plastic zone size (rcp) and grain size (av) on fatigue crack growth behavior, where the ratio of rcp/av means how many grains are in the cyclic plastic zone, the cyclic yield stress for calculating the cyclic plastic zone size was estimated as follows: As shown in Table 3, the cyclic yield stresses of the same grade low carbon steel plates were obtained by the incremental step method in the previous study.23) The average value of the ratios of cyclic yield stress (σcy) and static yield stress (σy) for two steels (N/B and D) can be obtained to be about 0.655. The cyclic yield stresses of the present materials were estimated by applying this ratio to the static yield stresses. The estimated cyclic yield stresses are shown in Table 3. Using the estimated cyclic yield stresses, the cyclic plastic zone sizes at ΔK = 15.3 MPa m1/.2 can be estimated as 84 μm and 109 μm for Steel A and Steel B, respectively. Therefore, the ratios of rcp/av can be obtained as 16.8 and 3.6 for Steel A and Steel B, respectively.
Table 3. Cyclic yield stress estimated based on the previous study.
| Yield Stress, σy (MPa) | Experimental cyclic yield stress, σcy (MPa) | σcy/σy | Estimated cyclic yield stress σcy | rcp/av |
|---|
| Steel N/B[21] | 367 | 243 | 0.662 | – | – |
| Steel D[21] | 406 | 263 | 0.648 | – | – |
| Steel A | 508 | – | 0.655 | 333 | 16.8 |
| Steel B | 446 | – | 0.655 | 292 | 3.6 |
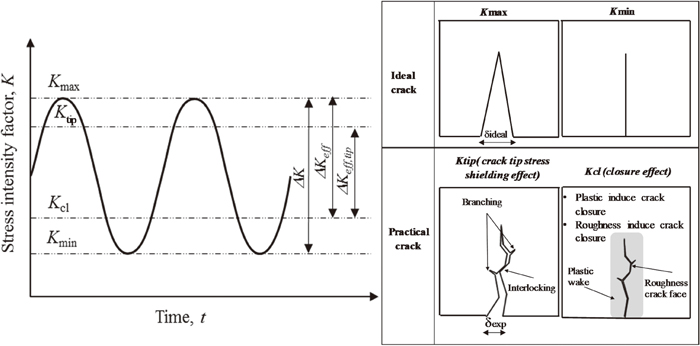
SEM micrographs of crack path were taken to discuss detail crack path morphologies contributing to the fatigue crack growth resistance. A strain gauge was attached in front of the crack tip for measuring crack opening/closing load according to the elastic unloading compliance method24) to estimate the crack closing stress intensity factor Kcl and then the effective stress intensity factor range, ΔKeff (= Kmax − Kcl). Crack mouth opening displacement was also measured from SEM micrographs of the crack mouth at the maximum load for estimating the crack tip stress intensity factor, Ktip according to the previous study.14) The effective crack tip stress intensity factor range ΔKeff,tip was obtained by (Ktip − Kcl), which includes both the crack closure effect and the crack tip stress shielding effect, as illustrated in Fig. 4.
Since the crack deflections for Steel B with coarse grain were observed not only at hard second phase particle but also inside a ferrite grain, EBSD analysis was carried out before the test within the area of 0.5 mm width and 2 mm length in front of the notch tip, as shown in Fig. 2(b). After the test, the crack path was reconstructed in the EBSD Orientation Image Mapping (OIM) which was conducted on surface which is perpendicular to TD (transversal direction) to investigate effect of crystal orientation on crack deflection and crack branching behavior.
3. Results and Discussion
3.1. In Situ Observation of Fatigue Crack Growth Behavior in Steel A with Fine Grain
Figure 5 shows the crack path and fatigue crack growth rates at various local points under the ΔK-constant fatigue crack growth test for Steel A, where about 17 ferrite grains are included in the cyclic plastic zone of about 84 μm as stated in the section 2.2. The average value of crack growth rates for Steel A was 3.15 × 10⁻⁹ m/cycle under the constant-ΔK of 15.3 MPa m1/2. As can be seen from the figure, fatigue crack growth rates lower than the average value were found at the 5th, 9th, 11th and 13th local points. On the other hand, higher fatigue crack growth rates were observed at the 4th, 6th, 7th, 10th and 12th local points, where flat crack paths were observed. In order to investigate the reasons for the lower fatigue crack growth rate, detail SEM observation was performed.

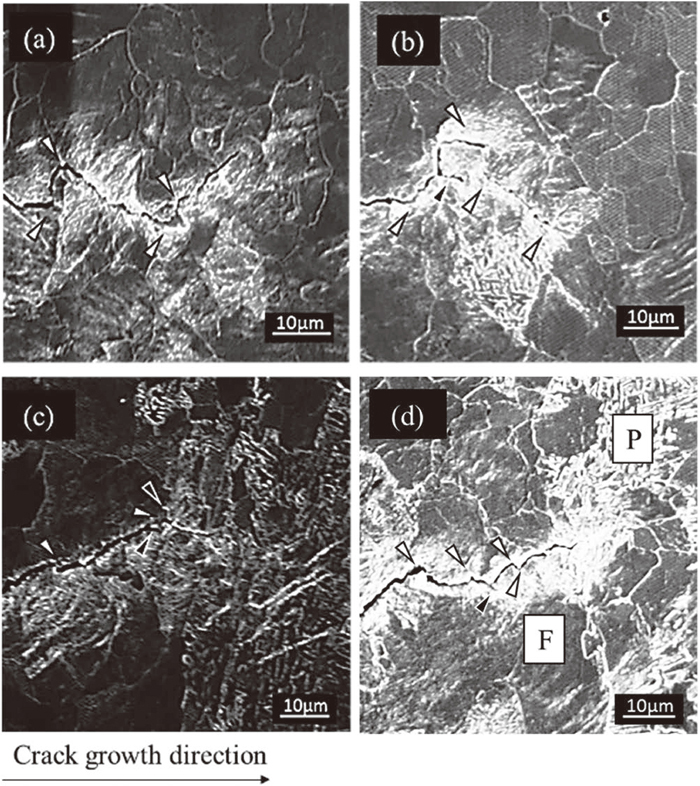
As examples, the SEM micrographs at some specific local points are shown in Figs. 6(a)–6(d). Figures 6(a) and 6(b) shows the crack paths at the 5th and 9th local points, in which zigzag crack path (frequent small crack deflections) and micro crack branches induced by high density of small hard particles (bainite/pearlite particles) can be observed. In the figures, white triangles show crack deflections, and black ones denote micro crack branches. These zigzag crack paths will be a possible cause for the roughness induced crack closure, while the roughness induced crack closure would take place under conjoint action of crack surface roughness and local crack surface distortion.25) On the other hand, the crack deflections could also induce crack interlocking due to friction contact between deflected crack surfaces, which will be a possible cause for the crack tip stress shielding, as schematically shown in Fig. 4. The opening of branched crack could also reduce the crack tip stress intensity factor of the main crack, which will be another cause for reducing the crack tip stress intensity factor.
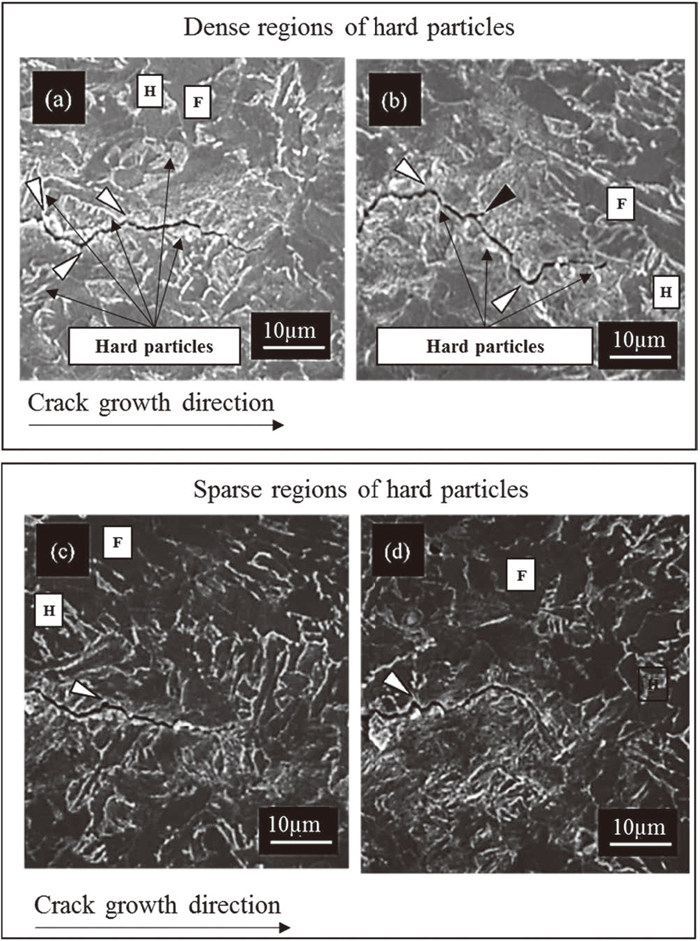
Figures 6(c) and 6(d) shows the crack paths at the 11th and 13th local points. The frequent small crack deflections (zigzag crack paths) similar to the 5th and 9th local points are also observed, although the microstructures in these 11th and 13th local points show lower density of second phase particles compared to those in the 5th and 9th local points. Therefore, in addition to second phase particles, grain boundary and crystal orientation of the grains would play a role in formation of crack deflection.
3.2. In Situ Observation of Fatigue Crack Growth Behavior in Steel B with Coarse Grain
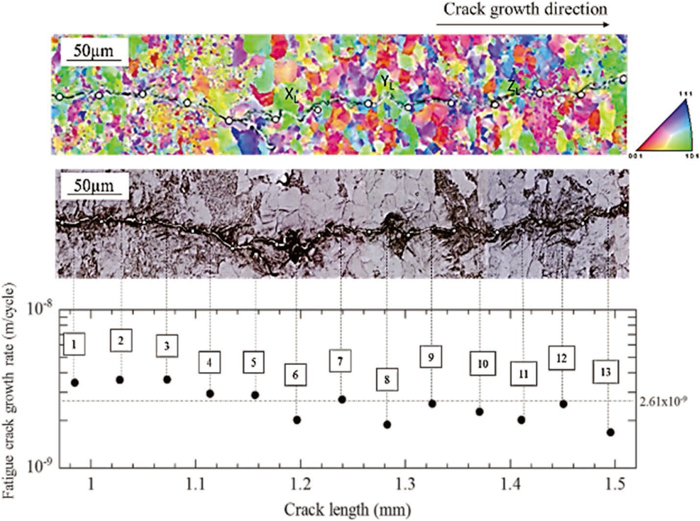
Figure 7 shows the crack path and fatigue crack growth rates at various local points under the ΔK-constant fatigue crack growth test for Steel B, where about 4 grains are included in the cyclic plastic zone of 109 μm. The microstructure before the fatigue crack growth test is also shown in the figure for avoiding the disturbance of heavy plastic deformation along the crack wake and identifying the crack path in association with the microstructure. The average fatigue crack growth rate for Steel B was 2.61 × 10⁻⁹ m/cycle, which was lower than that of Steel A. A flat crack path without large deflection could be observed at the 1st to 3rd local points, where the crack growth rates were higher than the average value. While the crack branching was found at the 5th local point, the crack growth rate at this point didn’t become low compared to the average value. However, the significant reduction of crack growth rate was found at the following 6th local point after passing through the 5th local point. Similar lower crack growth rates were also found at the 8th, 11th and 13th local points.

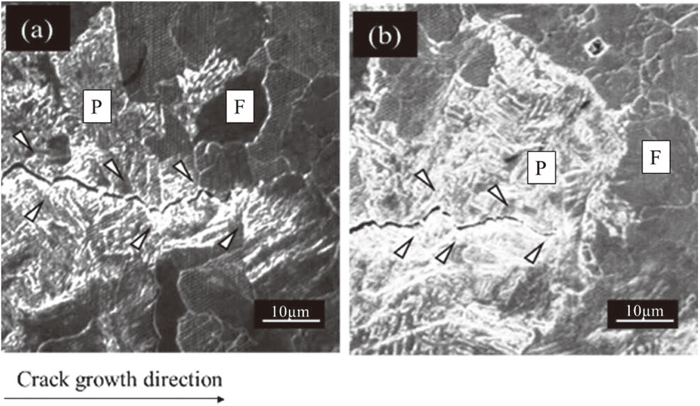
The crack deflections of large angle with some friction contacts between deflected crack surfaces were observed at the 6th, 8th and 11th local points, as seen from Figs. 8(a), 8(b) and 8(c), respectively. Micro branches as well as crack deflections could be also found at the 8th and 13th local points, as seen from Figs. 7(b) and 7(d), respectively. As found from Fig. 8, the crack deflection and branching at these local points were induced without hard particles. At the 10th and 12th local points, the crack propagated in the hard second phase particle and the crack path exhibited crack deflections with small angle, as seen from Figs. 9(a) and 9(b). As a result, the fatigue crack growth rates at these local points were rather low compared to the average value.
3.3. Effects of Crack Closure and Crack Tip Stress Shielding
As explained in the previous sections, crack deflections and crack branches were observed in the present steels, which would induce the crack closure as well as the crack tip stress shielding.14,15,16) It is known that crack closure and crack tip stress shielding can significantly reduce the stress intensity factor range from ΔK to ΔKeff,tip, and then enhance fatigue crack growth resistance, as shown in Fig. 4. In the present section, effects of crack closure and crack tip stress shielding have been investigated based on the experimental fracture mechanics approach.
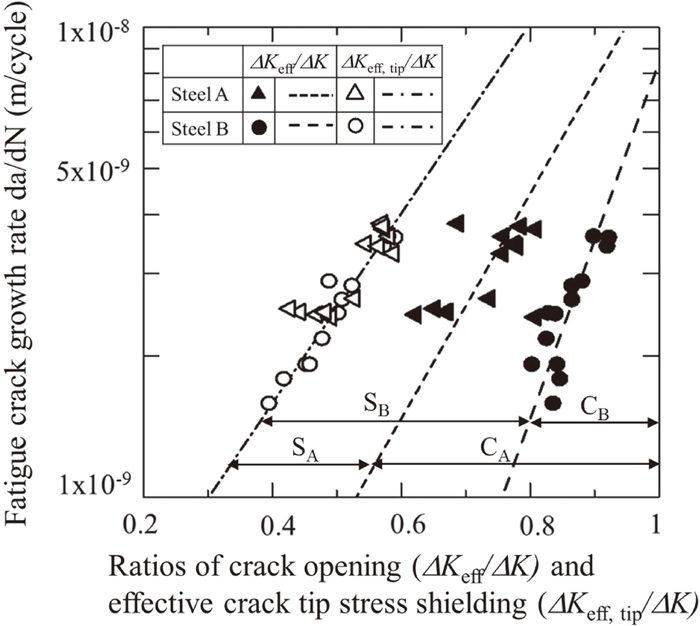
The relationships between fatigue crack growth rate and crack opening ratio (ΔKeff/ΔK) obtained at each local point for both Steel A and Steel B are shown in Fig. 10. In the figure, CA and CB represent the reduction of the stress intensity factor range due to the crack closure effect for Steel A and Steel B, respectively. As found from the figure, Steel A with larger CA has the pronounced crack closure effect compared to Steel B. As well-known, there are various kinds of crack closure mechanisms, such as plasticity-induced, roughness-induced, phasetransformation- induced, corrosion-products-induced, etc. Since Steel A has smaller plastic zone along the crack wake due to high yield stress compared to Steel B, the plasticity-induced crack closure will not be the main reason for larger CA. The phase-transformation-induced and corrosion-products-induced crack closure are not the cases for the present steels and the test condition, respectively. Finally, the roughness-induced crack closure will be the possible cause for larger CA, which will be induced by the zigzag crack path (frequent small crack deflections) as found in the section 3.1. Small grain size and large ratio of cyclic plastic zone size and average grain size (rcp/av = 16.8) may contribute to the small frequent crack deflections and then the significant crack closure effect.
Although the crack closure effect was significant in Steel A, the average fatigue crack growth rate of Steel A was high compared to Steel B. Therefore, the lower crack growth rate of Steel B compared to Steel A cannot be explained based only on the crack closure behavior. As mentioned in the sections 3.1 and 3.2, crack tip stress shielding elements such as interlocking due to friction contact between two crack surfaces of deflected crack could be observed in the crack wake for both Steel A and Steel B. Therefore, as one of the reasons other than crack closure, the effect of crack tip stress shielding should be taken into consideration for understanding fatigue crack growth behavior of the present steels.
The relationships between fatigue crack growth rate and the ratio ΔKeff,tip/ΔK for both Steel A and Steel B are also shown in Fig. 10. As can be seen from the figure, the relationships for both Steel A and Steel B are laid in the same line, which indicates that the parameter ΔKeff,tip would be the intrinsic parameter for controlling fatigue crack growth of the present steels, as proposed in the previous paper for the different TMCP steels.14) In the figure, SA and SB represent the reduction of the stress intensity factor range due to the crack tip stress shielding effect for Steel A and Steel B, respectively. As found from the figure, Steel B with larger SB has the significant crack tip stress shielding effect compared to Steel A, which is consistent with the crack path observations explained in the sections 3.1 and 3.2: Based on the observations, significant deflections to form interlocking elements as well as crack branching were found in Steel B with coarse grain (30 μm) and smaller ratio of rcp/av (3.6) compared to Steel A. In case of smaller ratio of rcp/av, the deformation of the grain ahead of crack tip would be significantly affected by the deformation of surrounding grains, which would enhance to form crack deflection and crack branching in the grain or at the grain boundary.
The foregoing results and discussion for the two steels are comparatively summarized in Table 4 for clarifying the relationships among microstructure, crack growth behavior and effects of crack closure and crack tip stress shielding. As found from the table, for fine grain Steel A with a large number of grains in the cyclic plastic zone, frequent zigzag crack path intensively induces crack closure, which is the dominant factor for improving the fatigue crack growth resistance in Steel A. On the other hand, for coarse grain Steel B with only a few number of grains in the cyclic plastic zone, interlocking due to friction contact of crack surfaces of deflected crack in ferrite grains as well as in island-like second phase pearlite intensively induces crack tip stress shielding, which is the dominant factor for improving the fatigue crack growth resistance in Steel B.
Table 4. Summary of the fatigue crack growth test results and the observations of crack growth behavior.
| Steel A | Steel B |
|---|
| Applied ΔK | 15.3 MPa m1/.2 | 15.3 MPa m1/.2 |
| Average fatigue crack growth rate | 3.15×10⁻⁹ m/cycle | 2.61×10⁻⁹ m/cycle |
| Average grain size | 5 μm | 30 μm |
| Ratio of rcp/av | 16.8 (About 17 grains in the cyclic plastic zone) | 3.6 (About 4 grains in the cyclic plastic zone) |
| Average second phase particle size | 4 μm | 28 μm |
| Volume fraction of second phase particle | 30% | 25% |
| Dominant phenomena influencing fatigue crack growth resistance | Crack closure | Crack tip stress shielding |
| Fatigue crack growth behavior corresponding to the dominant phenomena | Frequent zigzag crack path induced by small hard particles and grain boundary | Interlocking due to friction contact of deflected crack surfaces in ferrite grains under influence of crystal orientation and in island-like second phase pearlites |
| Secondary phenomena influencing fatigue crack growth resistance | Crack tip stress shielding | Crack closure |
Since the fatigue cracks dominantly propagated in the ferrite grains but less in the second phase particles and the ratio of grain size (av) and cyclic plastic zone size (rcp) is an important mechanical parameter influencing fatigue crack growth behavior, the effect of ferrite grain size has been mainly considered for discussing fatigue crack growth behavior, while the second phase particle sizes for Steel A and Steel B were different, as shown in Table 4, and the second phase particles contributed to crack deflection and crack tip stress shielding as discussed above.
As discussed above, in Steel B with smaller ratio of rcp/av, where less than four grains are in the cyclic plastic zone, the difference in deformation of each grain with different crystal orientation ahead of the crack will influence the crack growth behavior, such as crack deflection and crack branching. Therefore, the effect of crystal orientation of the grains ahead of the crack on fatigue crack growth behavior will be investigated in the following section.
3.4. Effect of Crystal Orientation on Crack Deflection and Branching Behavior
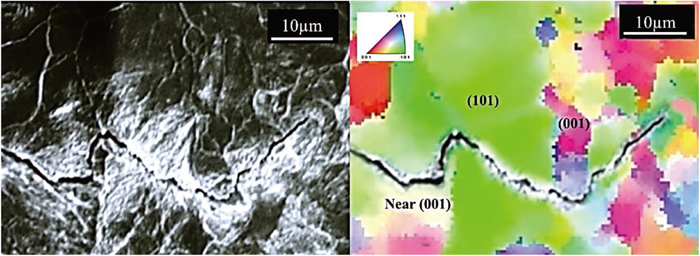
Figure 11 shows the crystallographic orientation mapping with fatigue crack path and fatigue crack growth rate under the ΔK-constant fatigue crack growth test of Steel B. Flatter crack path with fine grains and absence of red color grains with near (001) orientation were observed in the locations from the 1st to 4th local points, where the fatigue crack growth rates were higher than the average value. At the 5th local point, the crack deflection was observed, where the red color grains with near (001) orientation were presented near the crack path. The locations indicated by X and Y at the 6th and 8th local points included green color grains with near (101) orientation and the crack deflections were observed, where the fatigue crack growth rates were lower than the average value.
For understanding the effect of crystal orientation on fatigue crack growth behavior in detail, some examples of higher magnification micrographs are shown in Figs. 12 and 13. In Fig. 12, the crack path combined with crystal orientation analyzed by the EBSD at the 6th local point is shown. As seen from the figure, the crack dominantly propagated in the green color grains with near (101) orientation, where small deflections in the grain and larger deflections along the grain boundary were formed. In Fig. 13, the crack path at the 11th local point is shown, where small crack deflections and a branching in the grain with near (101) orientation and large deflection along the grain boundary between the grains with near (101) and near (001) orientations were observed. Similar small crack deflections and branching in the grain and large deflection along the grain boundary were also observed in other local points with low crack growth rates such as the 8th and 13th local points.
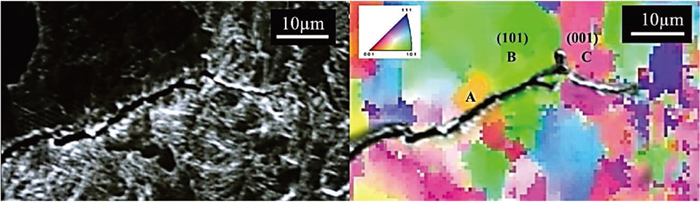
The crack path shown in Fig. 13 is schematically presented in Fig. 14 for explaining the speculated crack propagation process. The main crack propagates from the grain A into the grain B with near (101) orientation, where small crack deflection can be found at the grain boundary. The crack tortuously propagates in the grain B along the crack path ① and is arrested when it approaches the grain boundary between the grain B and the grain C with near (001) orientation. And then a crack nucleates and propagates along the crack path ②. The crack cannot successively propagate into the grain C and then deflects along the grain boundary ③. However, the crack propagated along the grain boundary cannot propagate further because the grain boundary is parallel to the loading direction and the stress intensity factor at the crack tip is reducing as it is propagating along the grain boundary. After the crack is arrested, a crack restarts from the root of deflected point at the grain boundary to propagate along the crack path ④ into the grain C. As explained above, the crystal orientation significantly influences the fatigue crack growth behavior.
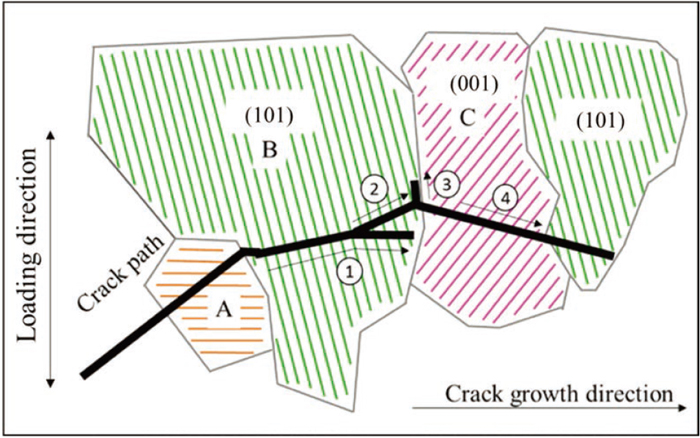
Based on the above observations, it is suggested that crack deflection can happen mainly inside the grains with near (101) orientation and at the grain boundary to the counter grain with near (001) orientation. It is also suggested that the crack branching can mainly occur inside the grains with near (101) orientation due to the existence of the grain with near (001) orientation next to the grain with near (101) orientation. In the BCC structure, the near (101) plane is known as the highest atomic density with the in-plane slip direction <111>.26,27,28,29) Thus, the slip systems can be easily activated. On the other hand, the slip direction of near (001) plane is out-plane and has lower atom density compared to the near (101) plane. Therefore, the grain with near (001) orientation is hard to plastically deform. Consequently, since the grain with near (001) crystal orientation constrains the deformation of the grain with (101) crystal orientation, co-existence of these two grains with near (001) and near (101) orientations would contribute to form the crack deflection and crack branching in the grain with near (101) orientation and at the grain boundary between the grains with near (101) and near (001) orientations.
From the foregoing results and discussion, it is speculated that if the plastic zone size is large enough compared to grain size like a case of Steel A, the material deforms more like a homogeneous and continuous body. In this case, the crack deflection is mainly caused by hard second phase particles. On the other hand, if the grain size is large and the plastic zone size is not large enough compared to the grain size like Steel B, the material deforms more like a heterogeneous and discontinuous material. Therefore, the crystal orientation of grain tends to take a role to induce the crack deflection and branching. In this way, the grain size and the crystal orientation influence fatigue crack growth behavior and then the fatigue crack growth resistance.
3.5. Percentages of Three Groups with Different Crystal Orientations and Fatigue Crack Growth Resistance
The influence of crystal orientation on local fatigue crack growth behavior has been discussed in the previous section. In order to confirm its effect on fatigue crack growth resistance further, additional ΔK-constant fatigue crack growth tests along with the EBSD analysis were carried out for another two specimens under the same fatigue crack growth test condition as Steel B. The specimens were subtracted from the different portions of the same plate of Steel B, which are named Steel B1 and Steel B2. From the results, the average crack growth rates of Steel B1 and Steel B2 were 4.84 × 10⁻⁹ m/cycle and 2.6 × 10⁻⁹ m/cycle, respectively. Those of Steel B and Steel B2 were almost identical, while that of Steel B1 was higher than Steel B and Steel B2. From the results of EBSD analysis, the percentages of typical three groups with dominant crystal orientations of near (111), (101) and (001) were estimated as shown in Fig. 15.
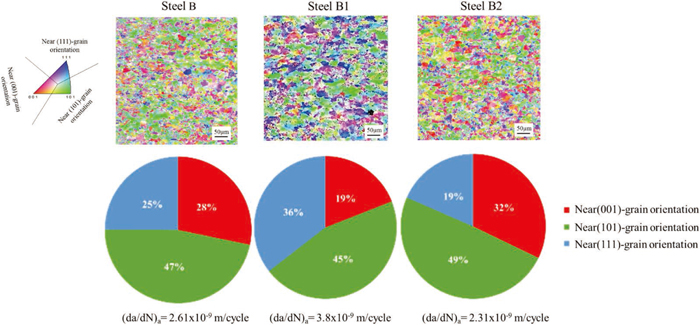
As seen from the figure, Steel B and B2 with lower average crack growth rates have the higher percentages of the grains with near (001) dominant crystal orientation compared to Steel B1 with a higher average crack growth rate. As discussed in the previous section, the grain with near (001) dominant crystal orientation constrains deformation of the grain next to it and enhances the formation of crack deflection and crack branching. Therefore, the higher percentage of the grains with near (001) dominant crystal orientation for Steel B and B2 will contribute to formation of crack deflection and crack branching more than the lower percentage of the grains with near (001) dominant crystal orientation for Steel B1. The intensive crack deflection and crack bringing behavior will induce significant crack tip stress shielding effect and then contribute to the lower average crack growth rate for Steel B and Steel B2.
4. Conclusions
The ΔK-constant fatigue crack growth tests with SEM in situ observation were carried out for two structure steels with two different grain sizes (namely, two different ratios of rcp/av) produced by the TMCP. The EBSD analysis was also carried out along with the fatigue crack growth tests. From the results, the effects of grain size and crystal orientation on fatigue crack growth behavior, such as crack deflection, crack branching and interlocking due to friction contacts between two crack surfaces, were investigated in detail. The main conclusions obtained are summarized as follows:
(1) For the specimen with fine grain and high ratio of rcp/av, the zigzag crack paths (frequent small crack deflections) induced by small second phase particles and grain boundaries were observed. On the other hand, for the specimen with coarse grain and low ratio of rcp/av, crack deflections induced not only inside the large ferrite grains and at the grain boundaries but also inside the large pearlite particles were observed. The crack branching is also observed inside the large ferrite grains as well as at the grain boundaries.
(2) For the specimen with fine grain and high ratio of rcp/av, crack closure effect was more significant compared to the specimen with coarse grain and low ratio of rcp/av due to significant roughness induced crack closure induced by frequent small zigzag crack path. On the other hand, for the specimen with coarse grain and low ratio of rcp/av, crack tip stress shielding effect was more significant compared to the specimen with fine grain and high ratio of rcp/av. The significant crack tip stress shielding effect would be induced by the interlocking elements formed by large grade of crack deflection and branching in the ferrite grain as well as at grain boundaries.
(3) For the material with coarse grain and low ratio of rcp/av, crack deflection and branching are found in the grains with near (101) crystal orientation next to the grain with near (001) crystal orientation and at the grain boundaries between the grains with (101) and (001) crystal orientations. Therefore, co-existence of these two grains with near (001) and near (101) orientations would contribute to form the crack deflection and crack branching in the grain with near (101) orientation and at the grain boundary between the grains with (101) and (001) orientations.
(4) From the results of fatigue crack growth tests and EBSD analysis for three specimens subtracting from different locations of the same steel plate, it is found that the higher percentage of the grains with near (001) dominant crystal orientation, which are hard to slip and then can induce crack deflection and branching in the grain with near (101) crystal orientation co-existing with the grain with near (001) crystal orientation, would contribute to the higher fatigue crack growth resistance.
References
- 1) K. Nishioka: Steel World, 5 (2000), 61.
- 2) A. Yoshie, M. Fujioka, Y. Watanabe, K. Nishioka and H. Morikawa: ISIJ Int., 32 (1992), 395. https://doi.org/10.2355/isijinternational.32.395
- 3) S. Endo and N. Nakata: JFE Tech. Rep., 20 (2015), 1.
- 4) Y. M. Kim, S. K. Kim, Y. J. Lim and N. J. Kim: ISIJ Int., 42 (2002), 1571. https://doi.org/10.2355/isijinternational.42.1571
- 5) N. J. Kim and G. Thomas: Metall. Trans. A, 12 (1981), 483. https://doi.org/10.1007/BF02648546
- 6) N. Shikanai, H. Kagawa and M. Kurihara: ISIJ Int., 32 (1992), 335. https://doi.org/10.2355/isijinternational.32.335
- 7) A. A. Korda, Y. Mutoh, Y. Miyashita, T. Sadasue and S. L. Mannan: Scr. Mater., 54 (2006), 1835. https://doi.org/10.1016/j.scriptamat.2006.02.025
- 8) A. A. Korda, Y. Miyashita, Y. Mutoh and T. Sadasue: Int. J. Fatigue, 29 (2007), 1140. https://doi.org/10.1016/j.ijfatigue.2006.09.008
- 9) M. S. Mustapa and Y. Mutoh: Mater. Sci. Eng. A, 527 (2010), 2592. https://doi.org/10.1016/j.msea.2009.12.023
- 10) M. S. Mustapa and Y. Mutoh: Adv. Mater. Res., 129–131 (2010), 775. https://doi.org/10.4028/www.scientific.net/AMR.129-131.775
- 11) Y. Ma, Z. Guo, L. Wang, J. Zhang and Y. Liu: J. Mater. Civ. Eng., 30 (2018), 04017314. https://doi.org/10.1061/(ASCE)MT.1943-5533.0002193
- 12) D. F. Laurito, C. A. R. P. Baptista, M. A. S. Torres and A. J. Abdalla: Procedia Eng., 2 (2010), No. 1, 1915. https://doi.org/10.1016/j.proeng.2010.03.206
- 13) K. Nakashima, H. Shimanuki, T. Nose and T. Ishikawa: Q. J. Jpn. Weld. Soc., 27 (2009), 13 (in Japanese). https://doi.org/10.2207/qjjws.27.13
- 14) Y. Mutoh, A. A. Korda, Y. Miyashita and T. Sadasue: Mater. Sci. Eng. A, 468–470 (2007), 114. https://doi.org/10.1016/j.msea.2006.07.171
- 15) W. Elber: Eng. Fract. Mech., 2 (1970), 37. https://doi.org/10.1016/0013-7944(70)90028-7
- 16) R. O. Ritchie: Mater. Sci. Eng. A, 103 (1988), 15. https://doi.org/10.1016/0025-5416(88)90547-2
- 17) Z. G. Wang, Z. F. Zhang, X. W. Li, W. P. Jia and S. X. Li: Mater. Sci. Eng. A, 319–321 (2001), 63. https://doi.org/10.1016/S0921-5093(01)01055-3
- 18) T. Zhai, A. J. Wilkinson and J. W. Martin: Acta Mater., 48 (2000), 4917. https://doi.org/10.1016/S1359-6454(00)00214-7
- 19) T. Zhai, X. P. Jiang, J. X. Li, M. D. Garratt and G. H. Bray: Int. J. Fatigue, 27 (2005), 1202. https://doi.org/10.1016/j.ijfatigue.2005.06.021
- 20) W. F. Brown, Jr. and J. E. Srawley: Plane Strain Crack Toughness Testing of High Strength Metallic Materials, ASTM Special Technical Publication No. 410, ASTM, Philadelphia, PA, (1966), 12. https://doi.org/10.1520/STP44663S
- 21) Y. Murakami: Stress Intensity Factors Handbook, Vol. 1, Pergamon, Oxford, UK, (1987) 9.
- 22) ASTM E647-08: 2008, Standard Test Method for Measurement of Fatigue Crack Growth Rates.
- 23) A. A. Korda, Y. Mutoh, Y. Miyashita and T. Sadasue: Mater. Sci. Eng. A, 428 (2006), 262. https://doi.org/10.1016/j.msea.2006.05.015
- 24) M. Kikukawa, M. Jono, K. Tanaka and M. Takatani: J. Soc. Mater. Sci., Jpn., 25 (1976), 899 (in Japanese). https://doi.org/10.2472/jsms.25.899
- 25) S. Suresh: Metall. Trans. A, 16 (1985), 249.
- 26) A. J. Opinsky and R. Smoluchowski: J. Appl. Phys., 22 (1951), 1488. https://doi.org/10.1063/1.1699897
- 27) N. P. Allen, B. E. Hopkins and J. E. McLennan: Proc. R. Soc. Lond. A, 234 (1956), 221.
- 28) T. Taoka, S. Takeuchi and E. Furubayashi: J. Phys. Soc. Jpn., 19 (1964), 701. https://doi.org/10.1143/JPSJ.19.701
- 29) W. A. Spitzig and A. S. Keh: Metall. Trans., 1 (1970), 2751.