Abstract
To understand the formation mechanism of degenerate pearlite, the effect of carbon concentration on the cementite morphology in pearlite was investigated in hypoeutectoid C–Mn steels with fully pearlite and ferrite–pearlite duplex microstructures. The carbon concentration in untransformed austenite was enriched by the precipitation of proeutectoid ferrite during isothermal holding after austenitization and could be controlled based on local equilibrium theory. Consequently, it was found that the morphology of cementite in the pearlite formed by the decomposition of the untransformed austenite continuously changed from lamellar to fine rod or spherical shapes by decreasing the carbon concentration. The critical carbon concentration for the cementite morphology transition was evaluated at approximately 0.42 mass% at 773 K. The ferrite growth rate increases with decreasing carbon concentration in austenite, which leads to non-cooperative growth between ferrite and cementite in the eutectoid reaction, resulting in the formation of degenerate pearlite. The critical carbon concentration and its temperature dependence for lamellar and degenerate pearlite transition can be estimated by a simple competition model of growth kinetics between ferrite and pearlite formations. In addition, it was found that the softening of degenerate pearlite during annealing after the decomposition was much faster than that of lamellar pearlite because the constrictions of cementite lamella do not exist for Ostwald ripening.
1. Introduction
Pearlite (P) is a fine lamellar structure formed through the eutectoid reaction from austenite (γ) to ferrite (α) and cementite (θ) in Fe–C alloys. It is a major microstructure in carbon steels, and thus there have been many studies on the microstructure and mechanical properties of pearlite. During pearlitic transformation, cooperative growth between ferrite and cementite is controlled by carbon (C) diffusion. On the contrary, it is known that cementite is sometimes discretely distributed in pearlite with a fine rod or platelet shape, which is called “degenerate pearlite” or “nodular bainite”.1,2,3) Furuhara et al. investigated the microstructural characteristics of degenerate pearlite formed in a Fe–0.38 mass% C alloy by means of transmission electron microscopy and electron backscatter diffractometry.4) They concluded that cementite in degenerate pearlite precipitates at the growing γ/P interface with a spherical shape, and degenerate pearlite has hierarchical substructures, for example, pearlite blocks and colonies, similarly to lamellar pearlite. Their report proves that degenerate pearlite is regarded as a pearlite where ferrite and cementite grow under non-cooperative reactions.
However, the conditions and mechanisms for the formation of degenerate pearlite are unclear, although it has an influence on the mechanical properties of carbon steels. Based on microstructural observations, Ohmori and Honeycombe reported that degenerate pearlite (DP) tends to form at lower temperatures and lower carbon regions compared with lamellar pearlite (LP), and they suggested that non-cooperative growth should be classified as interphase boundary precipitation.5,6) Their suggestion seems to be reasonable because both the reduction in carbon concentration in the austenite matrix and the lowering of the transformation temperature increase the driving force for ferrite formation relative to that for cementite, which makes the cooperative growth between them difficult. Although other investigations7,8) have been reported, further comparisons of transformation kinetics between ferrite and cementite formation in eutectoid reactions and the transition conditions of lamellar/degenerate pearlite have been insufficient.
In this study, the cementite morphology in pearlite decomposed from untransformed austenite with different carbon concentrations was investigated at 773 K in C–Mn steels to identify the transition between lamellar and degenerate pearlite. The critical carbon concentration is discussed in terms of the competition between the transformation kinetics of ferrite and pearlite.
2. Experimental Procedure
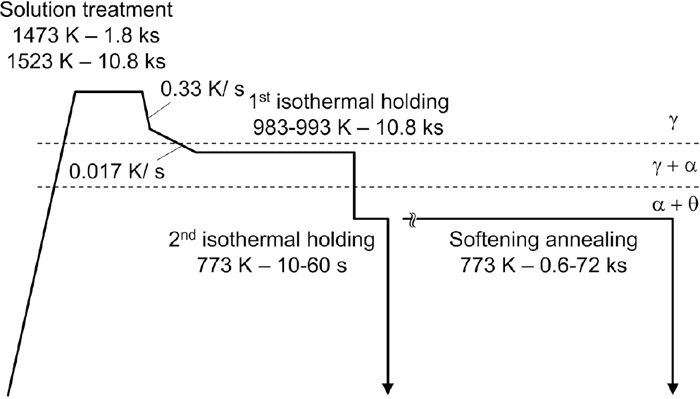
0.25%C–1.2%Mn and 0.44%C–0.8%Mn hypoeutectoid steels whose chemical compositions are given in Table 1 were used in this study (mass%). The Mn concentration was optimized to control the nucleation site, morphology, and growth mode of proeutectoid ferrite and to enhance quench hardenability, as mentioned later. Samples cut from a hot-rolled steel sheet that had been sufficiently homogenized at 1573 K for many hours were subjected to the following heat treatment as shown in Fig. 1. First, 0.25%C–1.2%Mn and 0.44%C–0.8%Mn steels were solution treated at 1473 K for 1.8 ks and at 1523 K for 10.8 ks, respectively. After austenitization, each steel was isothermally held at 983–993 K in the (γ + α) two-phase region for 10.8 ks to precipitate proeutectoid ferrite associated with carbon enrichment in untransformed austenite (the first isothermal holding). Upon cooling to the first isothermal holding temperature, the solution-treated material was cooled at a rate of 0.33 K/s (20 K/min) to 1123 K, followed by slower cooling at 0.017 K/s (1 K/min) in order to promote intergranular precipitation of the proeutectoid ferrite grains. After the first isothermal holding in the (γ + α) two-phase region, the material was isothermally held further at 773 K for 10–60 s in a salt bath furnace to decompose the untransformed austenite (the second isothermal holding). In addition to the ferrite–pearlite duplex microstructure, a microstructure that was fully pearlite was obtained by direct isothermal holding at 773 K after the solution treatment. Furthermore, the second isothermal holding time was extended up to 72 ks to investigate the softening behavior of the pearlite. Hardness was measured using a Vickers hardness tester developed by Matsuzawa, MMT-X7. The microstructure was observed by optical and scanning electron microscopy (OM and SEM, respectively). SEM observation was conducted by using a field emission electron microscope developed by JEOL, JSM-7001F, and the accelerating voltage and working distance were 15.0 kV and 15.0 mm, respectively. The identification of pearlite was performed objectively from the viewpoint of cementite morphology by image processing using Image J.9) The morphology of individual cementite particles was assumed to be a circumscribed ellipse on a binarized SEM image by the plugin “Analyze particle” and then cementite particles with an aspect ratio higher than 4.0 were regarded as lamellar cementite. The area fraction of the pearlite where lamellar cementite particles are distributed was evaluated as the fraction of lamellar pearlite, FLP. However, FLP tended to be underestimated due to some artifacts, therefore, it was used for a relative comparison between samples.
Table 1. Chemical composition of hypoeutectoid Mn–C steels used in this study.
| mass% | C | Si | Mn | P | S | N | Al | Fe |
|---|
| 0.25C-1.2Mn | 0.25 | 0.006 | 1.20 | 0.001 | 0.0005 | 0.0012 | 0.290 | Bal. |
| 0.44C-0.8Mn | 0.44 | 0.18 | 0.79 | 0.016 | 0.016 | – | – | Bal. |
3. Results
3.1. Effect of Carbon Concentration in Untransformed Austenite on Cementite Morphology
The 0.25%C–1.2%Mn and 0.44%C–0.8%Mn steels had fully martensitic structures by direct quenching after solution treatment, and their prior austenite grain sizes were approximately 500 μm and 300 μm, respectively. It was found that proeutectoid ferrite grains mostly characterized as allotriomorph ferrite decorated the prior austenite grain boundaries by the first isothermal holding in the (γ + α) two-phase region. The average carbon concentration enriched in untransformed austenite during isothermal holding was estimated from the proeutectoid ferrite fraction and the results are listed in Table 2. The carbon enrichment behavior during the first isothermal holding is also indicated in the Fe–C–Mn pseudo-binary diagram (Fig. 2). In this diagram, the phase boundary of γ/(γ + α) under ortho-equilibrium and the boundary of ferrite formation under partitioning/non-partitioning local equilibrium (PLE/NPLE) mode are shown by solid, Ae3, and dashed, A3LE, lines, respectively, which were calculated by Thermo-Calc with the TCFE9 database. The enriched carbon concentration in untransformed austenite is clearly lower than that in Ae3 and corresponds to A3LE. This suggests that proeutectoid ferrite formation takes place without long-range Mn diffusion. That is, the fast ferrite formation in the NPLE mode was completed after the first isothermal holding for 10.8 ks and the enriched carbon was uniformly distributed in the untransformed austenite. In the following, each sample is referred to as 0.25C, 0.39C, 0.42C, 0.44C, and 0.54C materials to indicate the carbon concentration in untransformed austenite.
Table 2. Carbon concentration in untransformed austenite after the first isothermal holding. The name of each material indicates the enriched carbon concentration.
| Steel | 0.25C-1.2Mn | 0.44C-0.8Mn |
|---|
| Material | 0.25C | 0.39C | 0.42C | 0.44C | 0.54C |
| The first Isothermal holding temperature (K) | N/A | 988 | 983 | N/A | 993 |
| Area fraction of proeutectoid α | 0 | 0.37 | 0.42 | 0 | 0.19 |
| Carbon concentration in untransformed γ (mass%) | 0.25 | 0.39 | 0.42 | 0.44 | 0.54 |
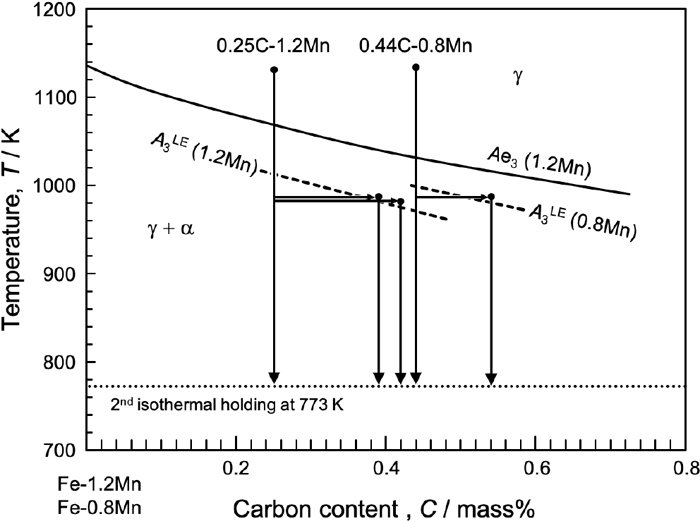
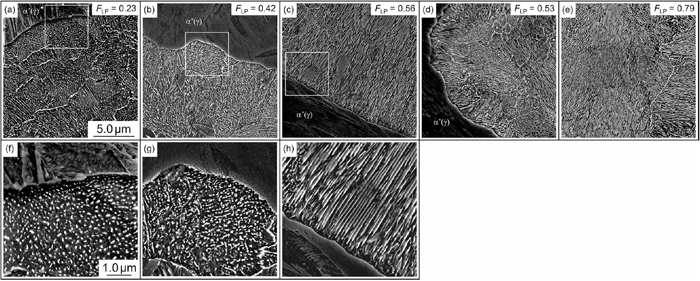
Figure 3 shows SEM images of pearlite transformed from untransformed austenite in the 0.25C, 0.39C, 0.42C, 0.44C, and 0.54C materials, which were isothermally transformed at 773 K. It was confirmed that the proeutectoid ferrite did not grow further and that pearlite preferred to nucleate at the interphase between the proeutectoid ferrite and untransformed austenite during the second isothermal holding. In addition, these SEM images focused on the growing interface of pearlite for the microstructural characterization of pearlite, which had just transformed. Especially, the images (f), (g), and (h) are magnified images to characterize the morphology and arrangement of cementite precipitates. Cementite particles were frequently observed when the carbon concentration in untransformed austenite was relatively low [(a, f) and (b, g)]. Such cementite particles were observed even in the extreme vicinity of the growing P/γ interface with curvature, which suggests that these cementite particles were not spheroidized from cementite lamellae after pearlitic transformation but rather precipitated at the growing interface directly. Additional, the cementite particles seem to have sheet-like distribution parallel to the growing interface (f). However, the cementite had a mostly lamellar shape when the carbon concentration in untransformed austenite increased, as shown in (h). FLP evaluated from some observations revealed that the cementite morphology continuously changed from lamellar to spherical with decreasing carbon concentration in untransformed austenite, regardless of the difference in bulk composition. These results demonstrate that pearlite tends to exhibit degenerate pearlite in the lower carbon region, as proposed by Ohmori and Honeycombe.5,6) However, the transition of cementite morphology continuously changed. If FLP = 0.50 is assumed to indicate the transition of cementite morphology, the critical carbon concentration for the transition is evaluated at 0.42% at 773 K in carbon steels with approximately 1.0%Mn. This value agrees well with the comparison between images (g) and (h).
The microstructural evolution of pearlite during the extended annealing at 773 K in the 0.25C and 0.42C materials obtained from 0.25%C–1.2%Mn steel is displayed in Fig. 4. The extended annealing was continuously conducted for both materials after the isothermal holding for 60 s. In addition to the initial hardness, the reduction in hardness, ΔHv, during the annealing is indicated in each image. The 0.25C material was characterized as degenerate pearlite in the initial state, and the number density of cementite particles monotonically decreased from (a) 2.1×10¹³ m−2 to (d) 1.4×10¹³ m−2 without a change in morphology. That is, Ostwald ripening occurred from the beginning of annealing in the degenerate pearlite. However, cementite in the 0.42C material remained lamellar pearlite, even after 10.8 ks (g), and finally the spheroidization started after a long period of annealing for 72 ks (h). In response to the change in cementite morphology, the softening behavior in the pearlite region was obviously different between these materials, although the absolute hardness was different due to the difference in carbon concentration in the untransformed austenite. From these results, it can be concluded that the softening of pearlite is strongly dependent on the initial cementite morphology, and degenerate pearlite shows more rapid softening compared with lamellar pearlite.
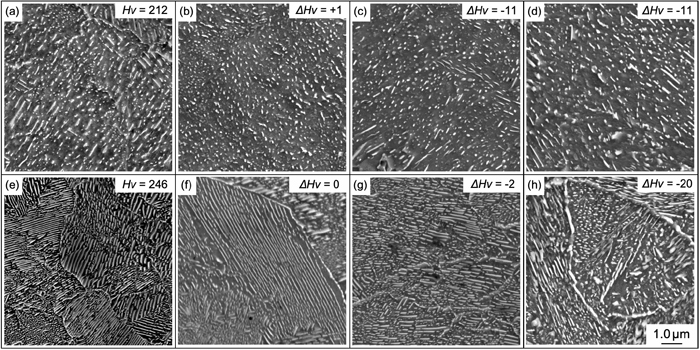
In general, the spheroidization of lamellar cementite is discussed in terms of the decrease in the total interfacial energy. The spheroidization model for rod-shaped precipitates proposed by Stüwe and Kolednik10) and the phase field modeling of spheroidization of lamellar cementite reported by Amos et al.11) pointed out the importance of constrictions of rod or lamellar cementite for spheroidization. When some constrictions form to divide the cementite lamellae, the total area of the α/θ interphase increases temporally. In other words, conventional spheroidization from lamellar to spheroidized pearlite passes through an unstable state with higher energy. However, cementite particles can reduce the interfacial energy monotonically by Ostwald ripening without an unstable state. It is therefore reasonable that degenerate pearlite can be spheroidized more rapidly than lamellar pearlite.
4. Discussion
4.1. Formation Mechanism of Degenerate Pearlite by Kinetic Competition
Some researchers1,2,3,4,5,6) proposed interphase boundary precipitation as the formation mechanism of degenerate pearlite. Interphase boundary precipitation is the transformation processed by the nucleation of the carbide on the γ/α growing interphase boundaries during ferrite formation, leading to high strengthening in alloy steels bearing V, Ti, and Nb.12,13,14) To enhance the particle dispersion strengthening by nanosized alloy carbide, the precipitation behavior, especially the size, density, intersheet spacing, and thermal stability of alloy carbides has been investigated.2,3,5,6,7,8,12,13,14,15,16,17) Although the discussion on the mechanism of interphase boundary precipitation continues, the nature is repeated precipitation of carbide at the growing interface accompanied by the diffusion of alloy elements. That is, when the growth rate of ferrite is higher than that of carbide, non-cooperative growth between them might occur. Ohmori also pointed out the importance of the crystallography of pearlite. He proposed that the coherency of the γ/α interphase boundary affects both the morphology of cementite and the orientation relationship between ferrite and cementite.18) Recently, Miyamoto et al.19) investigated the cementite morphology in pearlite adjacent to grain boundary ferrite formed at prior austenite grain boundaries, and they reported that degenerate pearlite tends to form at a semicoherent γ/α interphase with near Kurdjumov–Sachs (K–S) orientation relationship. However, it is also true that degenerate pearlite is formed by the migration of an incoherent γ/α interphase boundary without the K–S orientation relationship, as reported by Furuhara et al.4) Their studies suggest that the coherency of the γ/α interphase boundary is not the primary factor determining the formation of degenerate pearlite. Therefore, the transition of cementite morphology in pearlite is discussed below from the point of view of transformation kinetics.
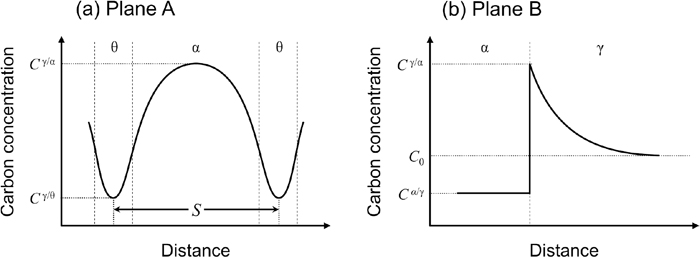
Figure 5 shows a schematic illustration of the two-dimensional distribution of the carbon concentration within the austenite in the growth front of pearlite, where the local equilibrium is satisfied at the γ/α and γ/θ interfaces. Carbon that builds up in front of the ferrite diffuses parallel to the P/γ interface; it is then taken into cementite, which contributes to the cooperative growth between ferrite and cementite. Looking at the carbon distribution in the growth front of ferrite again, there is a large gradient of carbon concentration toward the inside of the untransformed austenite. This indicates that two different carbon fluxes parallel and perpendicular to the P/γ interface, JCP and JCα, occur simultaneously and that they control the pearlite and ferrite formation, respectively. If ferrite formation is preferred to pearlite, it is necessary to break up and isolate the cementite phase. Therefore, it is expected that cementite morphology can be discussed as competition between the transformation kinetics of pearlite and ferrite formation controlled by JCP and JCα, respectively.
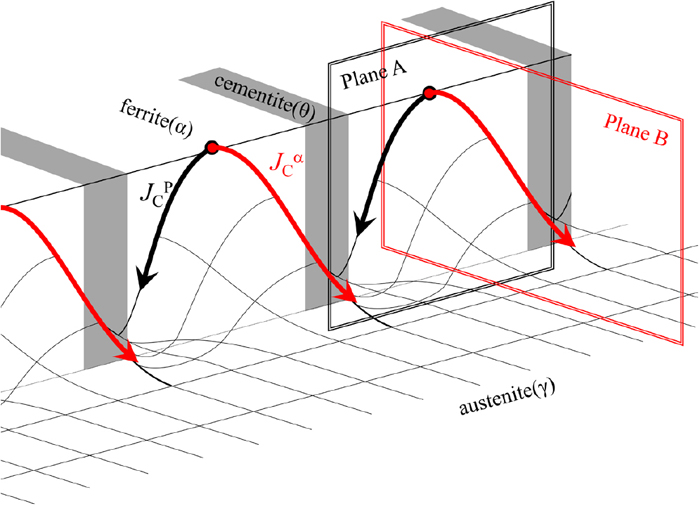
Figure 6 shows the one-dimensional carbon profile controlling pearlite and ferrite formation, which corresponds to the carbon profiles of Planes A and B, respectively, in Fig. 5. When lamellar pearlite grows in the steady state, the growth rate of pearlite, vP, can be described by Eq. (1).20,21)
|
v
P
=
D
f
α
f
θ
C
γ/α
-
C
γ/θ
C
θ/γ
-
C
α/γ
1
S
| (1) |
Here, fα, fθ, and S are the ferrite, cementite volume fractions, and lamellar spacing in pearlite, respectively. D is the diffusion coefficient of carbon. Although the possible diffusion path of carbon is the austenite matrix and P/γ interface,22) bulk diffusion in austenite was considered only to simplify the discussion. In addition, CI/II is the carbon concentration in phase I at the I/II interphase. Because lamellar pearlite grows in the steady state by carbon partitioning between ferrite and cementite in the vicinity of the growing interface, vP is independent of time t. However, the growth thickness, dα, and velocity, vα, of ferrite formation are given by Eqs. (2) and (3), respectively.
|
d
α
=
D
(
C
γ/α
-
C
0
)
2
(
C
0
-
C
α/γ
)
(
C
γ/α
-
C
α/γ
)
t
1/2
| (2) |
|
v
α
=
1
2
D
(
C
γ/α
-
C
0
)
2
(
C
0
-
C
α/γ
)
(
C
γ/α
-
C
α/γ
)
t
-1/2
| (3) |
In these equations, C0 corresponds to the bulk carbon composition. When local equilibrium is satisfied, Cγ/α and Cα/γ are constant; therefore, vα varies depending on t and C0. The time dependences of vP and vα, calculated by Eqs. (1) and (3) in the Fe–C–1.2%Mn alloy, respectively, are represented in Fig. 7. The temperature was 773 K and C0 was 0.1 and 0.8%C. In addition, Cγ/θ (0.289%C), Cθ/γ (6.67%C), Cγ/α (2.28%C), and Cα/γ (3.55 × 10⁻³%C) under the NPLE mode, the so-called nonpartitioning pearlite, were calculated according to a previous study23) using Thermo-Calc. D was estimated with the molar fraction of carbon at the interphase, xC, using Eqs. (4) and (5).24)
|
D=4.53×
10
-7
{
1+
y
C
(
1-
y
C
)
8 339.9
T
)
}
exp{
-(
1
T
-2.221×
10
-4
)
(
17 767-
y
C
26 436
)
}
| (4) |
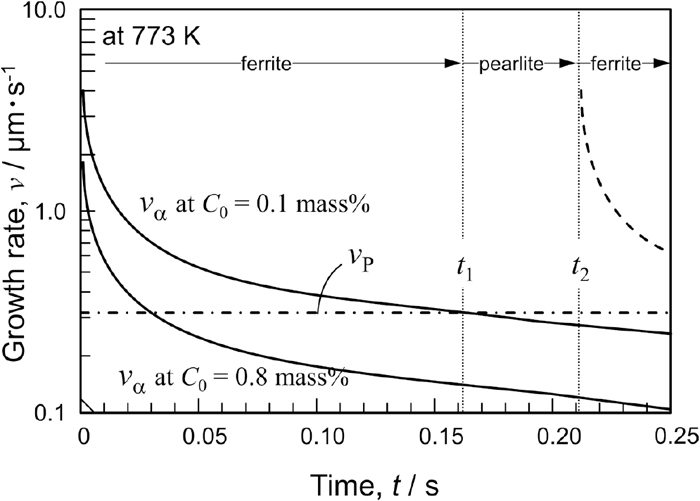
The calculated vP seems to be slightly lower than the measured value.23,25,26) When C0 is 0.8%, vP is always higher than vα except for an extremely short period after the nucleation. This reveals that austenite can be decomposed efficiently by the cooperative growth between ferrite and cementite on pearlite formation. However, if C0 is 0.1%, vα becomes higher than vP within a certain period of the early stage of ferrite formation. In this case, ferrite formation competes with pearlite formation, and the preferential transformation might change from ferrite to pearlite formation, when vα becomes lower than vP (at t = t1). Consequently, the cementite precipitation on pearlite formation consumes carbon built up at the growth front, which enables ferrite formation again, as indicated by the dashed line, due to the recovery of the driving force (at t = t2 for instance). As a result, the formation of ferrite and pearlite might be repeated. Because cementite precipitates not on ferrite formation but on pearlite formation, cementite is eventually distributed with a rod or spherical shape in the transformed microstructure.
In the above simulation, the transformation kinetics were compared between ferrite and pearlite formation; however, the ability of cementite nucleation at the growing γ/α interphase should be considered as well. Spanos3) proposed that the relative nucleation and growth rates of the product phases control the evolution of eutectoid microstructures. The nucleation rate of cementite, Js*, can be estimated using the following equations based on classical nucleation theory:
|
J
s
*
=
N
v
β
*
Zexp(
-
Δ
g
*
kT
)
| (6) |
|
β
*
~
16π
σ
θ
/M
2
D
x
C
a
4
(
ΔGv
)
2
| (7) |
|
Z=
V
a
(
Δ
G
v
)
2
8π
(
kT
σ
θ
/M
3
)
1/2
| (8) |
|
Δ
g
*
=
4π
r
*3
3
ΔGv+π
r
*2
(
4
σ
θ/M
-
σ
α/γ
)
| (9) |
|
r
*
=
4
σ
θ/M
-
σ
α/γ
2ΔGv
| (10) |
Here, NV, β*, Z, Δg*, k, Va, a, D, ΔGv, σθ/M, and σα/γ are the number of potential nucleation sites per unit volume, frequency factor, Zeldovich factor, activation energy for nucleation, Boltzmann coefficient, volume per atom in a cluster, a distance per jump, diffusion coefficient of carbon in austenite, driving force per unit volume for nucleation, interfacial energy per unit area of θ/Matrix and α/γ, respectively. The critical radius of the nucleus, r*, was estimated under the condition where a spherical cementite particle nucleated at the γ/α interphase.17) Each parameter related with crystal structure was estimated at NV = 8.29 × 1028 m−3, Va = 8.92 × 10⁻³⁰ m3, and a = 2.48 × 10⁻¹⁰ m from the crystal unit of face-centered cubic austenite with lattice parameter 0.364 nm. ΔGv was calculated as 8.745 × 10⁷ J m−3 by using Thermo-Calc with the chemical composition in austenite at the growth front. In addition, σθ/M, and σα/γ were assumed to be 0.3 and 1.1 J m−2, respectively. Substituting these parameters into the equations, Js* was estimated at ~1026 s−1 m−3. The actual nucleation rate of cementite, Js, was evaluated as follows. Given that a pearlite colony with a diameter of Dc and lamellar spacing of S grows in one direction by an edgewise growth mechanism, it takes t* = 3.8 ms to pass through the distance corresponding to the diameter of the cementite nucleus (2r* = 1.14 nm). Because the growth rate is 0.32 μm s−1, when ferrite formation occurs in competition with pearlite formation (see Fig. 7). At this time, the volume of the pearlite colony is roughly calculated at π × (Dc/2)2 × 2r*. If cementite lamellae nucleate within the small pearlite colony while maintaining S, the number of cementite nuclei is given by DC/S. Therefore, Js is estimated as 1.5 × 1024 s−1 m−3 [Js = (DC/S)/{π × (Dc/2)2 × 2r* × t*}] by substituting Dc = 1.0 μm and S = 100 nm, which are representative values in conventional pearlite. The fact that Js* is much higher than Js reveals that cementite can nucleate at the growing γ/α interphase if the growth rate is sufficiently low. Therefore, the cementite morphology should be affected preferentially by the growth rate.
4.2. Estimation of Transition of Cementite Morphology in Pearlite
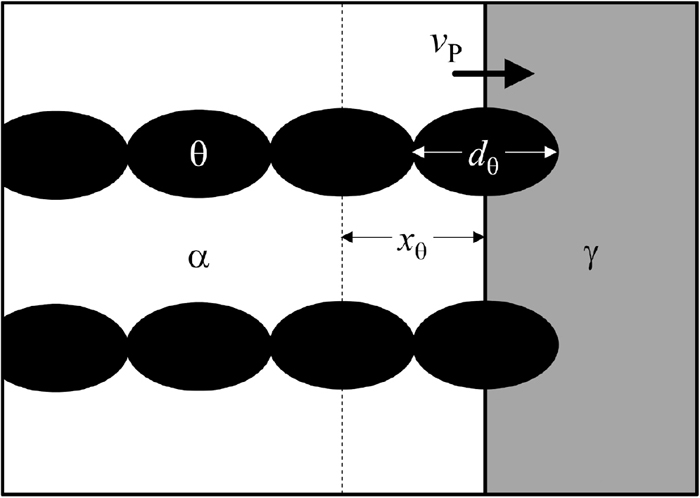
Let us estimate the critical carbon concentration, C*, for the transition of cementite morphology from lamellar to a spherical shape according to the above kinetic competition model. Based on the above microstructural observation of degenerate pearlite, it is considered that ellipsoid cementite particles with long diameters, dθ, form at the growing γ/α interphase in a row while maintaining the longitudinal direction perpendicular to the interphase, as shown in Fig. 8. When the rows of cementite particles with intersheet spacing xθ corresponds to the one-time growth of ferrite, dα, cementite particles connect with each other (dθ = xθ), and thus a lamellar structure is developed. That is, given that the time when vα becomes equal to vP is t1* (see Fig. 7), vα(t1*) = vP and dα(t1*) = xθ are the equations used to solve C*. These equations are described by Eqs. (11) and (12), as follows:
|
1
2
D
(
C
γ/α
-
C
*
)
2
(
C
*
-
C
α/γ
)
(
C
γ/α
-
C
α/γ
)
t
1
*-1/2
=
D
f
α
f
θ
C
γ/α
-
C
γ/θ
C
θ/γ
-
C
α/γ
1
S
| (11) |
|
D
(
C
γ/α
-
C
*
)
2
(
C
*
-
C
α/γ
)
(
C
γ/α
-
C
α/γ
)
t
1
*1/2
=
x
θ
| (12) |
Solving these simultaneous equations with dθ = 30 nm and S = 83 nm, which were the observation results (see Fig. 4(a)), C* = 0.41% and t1* = 47 ms were obtained at 773 K under the condition of C* > 0. This calculated C* agrees well with the experimental value of 0.42%.
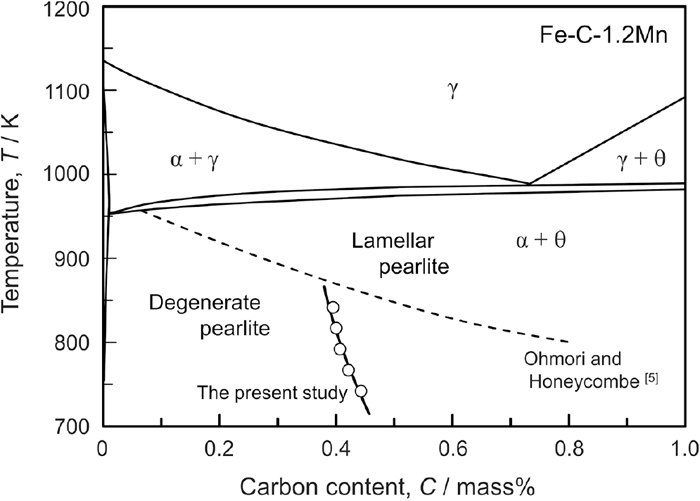
The estimation of C* was extended to the temperature range 748–848 K. In the estimation, both the long direction of the cementite particle (dθ) and the lamellar spacing (S) were assumed to be constant independent of temperature because it was reported that S hardly changed below 873 K.27,28) The calculated results are plotted as open circles with the solid line in the Fe–C–1.2%Mn pseudo-binary diagram (Fig. 9). The calculated C* exhibits a clear temperature dependence and increases with decreasing temperature, which corresponds to the trend reported by Ohmori and Honeycombe.5) However, our calculation results showed a smaller temperature dependence compared with their report, as indicated by the dashed line. Although it is unclear which is correct so far, a possible reason why our prediction is different from theirs is an ambiguity in the characterization of cementite morphology, as mentioned above, as well as the Mn addition. However, our estimation is not inconsistent with the experimental reports that degenerate pearlite was formed at 848–898 K in 0.3%C–2.0%Mn steel29) and that lamellar pearlite was observed at 873 K in 0.4%C–2.0%Mn steel.23)
From these results, the model of kinetic competition between ferrite and pearlite formations can predict the composition and temperature range where degenerate pearlite forms semi-quantitatively. However, in conventional steels containing a certain amount of Si and Mn, these elements change the condition of phase equilibrium between γ, α, θ, and the diffusion coefficient of carbon in a complicated manner. In addition, the mobility of the interphases is expected to be lower due to the solute drag effect, affecting the growth rates of ferrite and pearlite formation. To control the cementite morphology and the mechanical properties of pearlite in conventional steels accurately, further investigations are needed.
5. Conclusions
To understand the formation mechanism of degenerate pearlite, the effect of carbon concentration on the cementite morphology was investigated in hypoeutectoid Mn–C steels with fully pearlite and ferrite–pearlite duplex microstructures. The obtained results are as follows:
(1) The carbon concentration in austenite can be controlled by the proeutectoid ferrite formed through isothermal holding in the austenite and ferrite two-phase regions based on the local equilibrium theory.
(2) The cementite morphology in the pearlite decomposed from untransformed austenite continuously changes from a lamellar to a spherical shape with decreasing carbon concentration in the austenite, and the critical carbon concentration for the cementite morphology transition is approximately 0.42 mass% at 773 K. Cementite in degenerate pearlite shows Ostwald ripening from the beginning of annealing, which results in more rapid softening compared with lamellar pearlite.
(3) The change in the cementite morphology in pearlite depending on the carbon concentration in austenite can be explained by a simple competition model of the transformation kinetics between ferrite and pearlite formation. The model indicates the temperature dependence of the critical carbon concentration for the transition of cementite morphology.
Acknowledgment
The authors would like to thank Mr. Shouhei Yabu at Nippon Steel Corp. for supplying the steels used in the present study.
References
- 1) L. J. Habraken and M. Economopoulos: Transformation and Hardenability in Steels, Climax Molybdenum Company of Michigan, Ann Arbor, MI, (1967), 69.
- 2) D. N. Shackleton and P. M. Kelly: Acta Metall., 15 (1967), 979. https://doi.org/10.1016/0001-6160(67)90263-5
- 3) G. Spanos: Metall. Trans. A, 23 (1992), 171. https://doi.org/10.1007/BF02660863
- 4) T. Furuhara, T. Moritani, K. Sakamoto and T. Maki: Mater. Sci. Forum, 539–543 (2007), 4832. https://doi.org/10.4028/www.scientific.net/MSF.539-543.4832
- 5) Y. Ohmori and R. W. K. Honeycombe: Proc. ICSTIS, Trans. Iron Steel Inst. Jpn., 11 (1971), Suppl., 1160.
- 6) Y. Ohmori: Materia Jpn., 15 (1976), 93. https://doi.org/10.2320/materia1962.15.93
- 7) Y. Ohmori, A. T. Davenport and R. W. K. Honeycombe: Trans. Iron Steel Inst. Jpn., 12 (1972), 128. https://doi.org/10.2355/isijinternational1966.12.128
- 8) R. W. K. Honeycombe: Metall. Trans. A, 7 (1976), 915. https://doi.org/10.1007/BF02644057
- 9) C. A. Schneider, W. S. Rasband and K. W. Eliceiri: Nat. Methods, 9 (2012), 671. https://doi.org/10.1038/nmeth.2089
- 10) H. P. Stüwe and O. Kolednik: Acta Metall., 36 (1988), 1705. https://doi.org/10.1016/0001-6160(88)90237-4
- 11) P. G. K. Amos, A. Bhattacharya, B. Nestler and K. Ankit: Acta Mater., 161 (2018), 400. https://doi.org/10.1016/j.actamat.2018.09.043
- 12) J. M. Gray and R. B. G. Yeo: Trans. Am. Soc. Met., 61 (1968), 255.
- 13) A. D. Batte and R. W. K. Honeycombe: J. Iron Steel Inst., 211 (1973), 284.
- 14) J. A. Todd, P. Li and S. M. Copley: Metall. Trans. A, 19 (1988), 2133. https://doi.org/10.1007/BF02645038
- 15) W. J. Liu: Metall. Trans. A, 24 (1993), 2195. https://doi.org/10.1007/BF02648594
- 16) R. Okamoto, A. Borgenstam and J. Ågren: Acta Mater., 58 (2010), 4783. https://doi.org/10.1016/j.actamat.2010.05.016
- 17) T. Murakami, H. Hatano, G. Miyamoto and T. Furuhara: ISIJ Int., 52 (2012), 616. https://doi.org/10.2355/isijinternational.52.616
- 18) Y. Ohmori: Tetsu-to-Hagané, 69 (1983), 1095 (in Japanese). https://doi.org/10.2355/tetsutohagane1955.69.9_1095
- 19) G. Miyamoto, Y. Karube and T. Furuhara: Acta Mater., 103 (2016), 370. https://doi.org/10.1016/j.actamat.2015.10.032
- 20) C. Zener: Trans. AIME, 167 (1946), 550.
- 21) M. Hillert: Jernkontorets Ann., 141 (1957), 757.
- 22) M. Hillert: Metall. Trans., 3 (1972), 2729. https://doi.org/10.1007/BF02652840
- 23) H. Ishigami, N. Nakada, T. Kochi and S. Nanba: ISIJ Int., 59 (2019), 1667. https://doi.org/10.2355/isijinternational.ISIJINT-2019-022
- 24) J. Ågren: Scr. Metall., 20 (1986), 1507. https://doi.org/10.1016/0036-9748(86)90384-4
- 25) J. Chance and N. Ridley: Metall. Trans. A, 12 (1981), 1205. https://doi.org/10.1007/BF02642334
- 26) C. Capdevila, F. G. Caballero and C. García de Andrés: ISIJ Int., 45 (2005), 238. https://doi.org/10.2355/isijinternational.45.238
- 27) D. D. Pearson and J. D. Verhoeven: Metall. Trans. A, 15 (1984), 1037. https://doi.org/10.1007/BF02644695
- 28) N. Ridley: Metall. Trans. A, 15 (1984), 1019. https://doi.org/10.1007/BF02644694
- 29) Z. Q. Liu, G. Miyamoto, Z. G. Yang and T. Furuhara: Metall. Mater. Trans. A, 44 (2013), 5456. https://doi.org/10.1007/s11661-013-1885-6