Abstract
Outdoor exposure tests of prepainted 55% Al–Zn steel sheets are performed for 24 months at five different exposure sites: Tokyo, Kagoshima, and Okinawa in Japan, and Arizona and Florida in the United States. The anticorrosive pigments in the primer with topcoat are strontium chromate (Cr), magnesium vanadate + zinc phosphate (MgV/ZnP), calcium silicate (Si), and magnesium vanadate (MgV). The edge creep is evaluated by measuring the creep width every six months. The electrochemical impedance and polarization curves of the non-coated 55% Al–Zn steel and carbon steel (CS) are measured in a 3% NaCl solution suspended with the anticorrosive pigments. The corrosion products at the cut edge are analyzed by scanning electron microscopy and energy dispersive X-ray spectrometry.
The edge creep for all the specimens did not progress at all in Arizona (dry desert), although red rust appears on the CS surface at the cut edge. At Kagoshima and Okinawa (marine atmospheres), the progress of the edge creep is fast for all the specimens. It is especially significant in Okinawa where temperature and humidity are high. When comparing the effects of the pigments on the edge creep properties, the results show that Si is poor at all exposure sites except Arizona, and MgV/ZnP shows edge creep properties comparable to Cr. From the anodic polarization characteristics of 55% Al–Zn steel and the cathodic polarization curve of CS, the effect of the pigments on edge creep is successfully described.
1. Introduction
Prepainted steel sheets for exterior building materials are made for roofing and siding projects; 55% Al–Zn steel1,2) is painted on both sides with a chemical conversion treatment. Generally, specifications for the front side include a double coat of primer and topcoat with a total dry film thickness of approximately 20 μm. The general specification for the backside is a single or double coat of primer and back coat with a total dry film thickness of 5–7 μm. Prepainted steel sheets for exterior building materials are required to have long-term corrosion and weather resistance in the painted flat areas, molded parts, and in the cut edge where the metal parts are exposed. A common anticorrosive pigment is hexavalent chromium.
Recently, to reduce environmentally hazardous substances, it is required to establish technology for chemical conversion and chromate-free primers that do not contain hexavalent chromium. Prepainted steel sheets used for home appliances already utilize chromate-free primers.3,4) However, for building materials, it will take a long time to establish chromate-free technology5,6) as evaluation of long-term durability and corrosion resistance are required.
In Europe, the use of environmentally hazardous substances such as hexavalent chromium is controlled and regulated through the Restriction of Hazardous Substances and the Registration Evaluation Authorization and Restriction of Chemicals (REACH). Therefore, in many European countries, the use of chromate-free materials for building materials is progressing. REACH has designated chromate pigments that are used as anticorrosive pigments for primers as controlled substances, and in the European Union region restrictions have been in place since January 2019.7) In Japan, the standard specifications for public building construction (Ministry of Land, Infrastructure, Transport and Tourism) were revised in 2013, and paint containing lead and chromium was completely eliminated for after-coated steel sheets (on-site painting). Additionally, chromate-free specifications were standardized in the Japanese Industrial Standards for prepainted steel sheets in 2013.8)
The anticorrosion performance of chromate-free coating systems was evaluated by comparing it with conventional chromate systems in outdoor exposure tests. Comparative evaluation results of the degradation of painted 55% Al–Zn steel and galvanized steel sheets at exposure sites located at Okinawa, Akita, and Niigata were available.9) Proskek et al. studied one effect of climatic parameters on the cut edge corrosion of painted Zn–Mg and Zn–Al–Mg alloy steel.10) Ueda et al. studied the corrosion mechanism of the cut edge from the results of an exposure test at Okinawa for Zn–11% Al–3% Mg–0.2% Si alloy steel.11) Shinohara reported on the corrosion-protection mechanism of zinc-coated steel sheets compared with carbon steel (CS) sheets in a natural exposure test.12) Sugawara et al. compared the role of magnesium phosphate and strontium chromate pigments in accelerated tests on the corrosion resistance of 55% Al–Zn steel.13) Townsend reported on the corrosion resistance of galvanized steel sheets and 55% Al–Zn steel with natural exposure tests in different environments.14) Nomura et al. reported on an example of the corrosion resistance of 55% Al–2% Mg–Zn alloy steel sheets compared with 55% Al–Zn steel.15) However, there are only a few reports of systematic exposure tests of chromate-free prepainted steel sheets in different climatic environments. Accelerated tests such as the salt spray test (SST)16) and the cyclic corrosion test (CCT)17) are also applied to evaluate the chromate-free prepainted steel sheets. Kajiyama et al. studied new accelerated corrosion test methods by alternating SST and CCT.18) Matsuda et al. studied the relationship between accelerated test results and 44-month outdoor exposure test results.19) However, in general, test results did not always highly correlate with natural environment long-term exposure tests.
Electrochemical methods20,21) were applied to evaluate the corrosion behavior after exposure tests and accelerated tests.10,22,23) Regarding the cut edge corrosion, Nishikata et al. proposed a method for measuring the local electrochemical impedance spectroscopy (EIS) near the cut edge that appeared intact to the naked eye and evaluated the degree of the degradation of the paint via EIS.22) Research results of Zn and 55% Al–Zn steel sheets as well as the role of chromate pigments were discussed. This paper discussed the effects of the differences in the anticorrosive pigments contained in the primer on 55% Al–Zn steel sheets based on the results of exposure tests in Japan and in the United States.
2. Experimental
2.1. Precoated Steel Sheets
This study used 55% Al–Zn steel sheets (GL, alloy metal weight 150 g/m2) with a substrate thickness of 0.4 mm. On the surface, the primer and topcoat were applied with a 2-coat-2-bake process. Figure 1 shows the structure of the prepainted steel sheet. Four different precoated steel sheets were used in each exposure test. Table 1 describes the details of the precoatings. Each sheet had a different pigment in the primer; strontium chromate (Cr), a mixture of magnesium vanadate and zinc phosphate (MgV/ZnP), calcium ion-exchange silica (Si), and magnesium vanadate (MgV). The topcoats were conventional polyester/melamine paint or polyester/urethane paint. The backside of all the test pieces was painted with an epoxy primer of MgV/ZnP (5 μm thick) and an epoxy topcoat (6 μm thick).

Table 1. Coating specifications.
| Name | Primer | Topcoat |
|---|
| Binder | ACP* | DFT*/μm | Binder | DFT*/μm |
|---|
| CR | Epoxy | Cr | 5 | Polyester | 15 |
| CF-1 | Epoxy | MgV/ZnP | 5 | Polyurethane | 15 |
| CF-2 | Polyurethane | Si | 25 | Polyurethane | 15 |
| CF-3 | Polyurethane | MgV | 25 | Polyurethane | 15 |
* ACP: Anti corrosive pigment, DFT: Dry film thickness
The exposure tests were performed at five different sites: (1) Shinjuku, Tokyo, Japan; (2) Kirishima, Kagoshima, Japan; (3) Miyakojima, Okinawa, Japan; (4) South Florida, USA; (5) Arizona, USA. The exposure period was 24 months. Tokyo (TYO) is classified as an urban area in a temperate zone (19 km from the coast). Kagoshima (KAG) is a volcanic area in a temperate zone (2 km from the coast). Okinawa (OK) is a marine area in a subtropical zone (2 km from the coast). South Florida (FL) is in a subtropical zone (19 km from the coast), and Arizona (AZ) is a desert area in a dry zone (200 km from the coast). Table 2 shows the average outside temperature, the average relative humidity, and the radiation-exposure levels monitored at the exposure sites. The average temperature was higher at the exposure sites of OK, FL, and AZ. The average humidity was higher at KAG, OK, and FL, and was extremely low in AZ. It was expected that KAG and OK would have the largest amount of airborne sea salt due to their low distance from the coast. Therefore, it was predicted from these climate conditions that OK would be the most aggressive, KAG and FL would be moderate, TYO would be relatively mild, and AZ would be the least corrosive.
Table 2. Weathering data measured at the exposure sites.
| Location | Tokyo (TYO) Shinjuku | Kagoshima (KAG) Kirishima | Okinawa (OK) Miyako | America (FL) S. Florida | America (AZ) Arizona |
|---|
| Classification | Temparate Urban | Temparate Marine, Volcano | Subtropical Marine | Subtropical | Desert |
|---|
| Distance from coast (km) | 19 | 2 | 2 | 19 | 200 |
| Exposure angle (degree) | 45 | 30 | 20 | 25 | 45 |
| Average temperature (°C) | 15.1 | 16.2 | 23.8 | 24.6 | 21.4 |
| Average humidity (%RH) | 61.5 | 88.9 | 79.4 | 75.8 | 35.9 |
| Radiant exposure (MJ·m−2) | 21.5 | 27.8 | 29.4 | 24.8 | 25.4 |
The test pieces were cut from the painted steel plates in Table 1 to 150 × 35 mm with a shear cutter so that the burrs were on one edge and the other edge faced up and down, respectively. The schematic drawing of this is shown in Fig. 2. Four cuts of each test piece were exposed at each site, and one was removed every 6 months to measure the edge creep width. The creep widths (both at the upward and downward burrs) were randomly selected and measured at 10 points, 100 mm in length, along the cut edges. The progress of the cut edge corrosion was evaluated via the average value.
2.3. Cross-section Analysis of the Cut Edge
The cross-section of the cut edge, after 24 months of exposure, was observed and analyzed with a scanning electron microscope (SEM, S-3400N, Hitachi) and energy dispersive X-ray spectrometry (EDS).
2.4. Electrochemical Tests
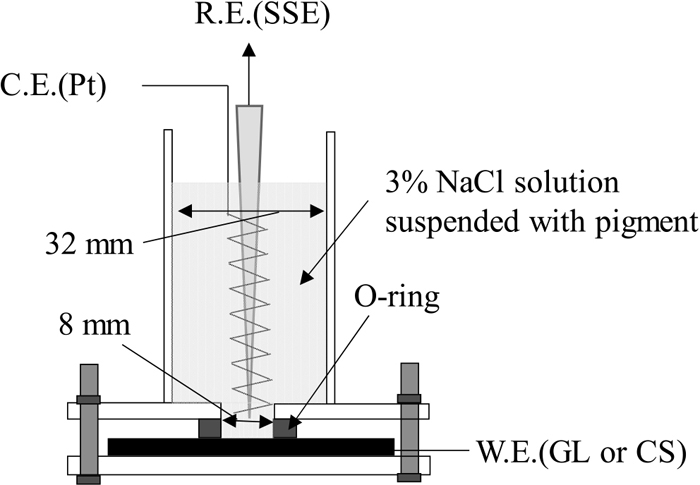
As shown in Fig. 3, the anticorrosion ability of the pigment for the 55% Al–Zn coating and carbon steel (CS) substrate was evaluated via electrochemical methods using a three-electrode cell. A silicone ring with an inner diameter of 8 mm was placed on the working electrode surface of the 55% Al–Zn steel sheet or CS sheet, and an acrylic tube with an inner diameter of 32 mm with an acrylic flange was fixed vertically on it. A 3% NaCl solution suspended with the pigments was poured into the acrylic tube as the test solution. A silver/silver chloride electrode (Ag/AgCl, sat. KCl, SSE) and a platinum electrode were used as the reference electrode and counter electrode, respectively. After the open circuit potential (OCP) was stabilized (approximately 30 min.), the EIS was first measured using an electrochemical measurement unit (IVUIM STAT). Next, the anodic polarization curve was measured at 1 mV·s−1 from Ecorr in a positive direction. Similarly, the cathodic polarization curve was measured from Ecorr using a fresh working electrode. The EIS was measured at the OCP with a 10 mV amplitude and in the frequency range of 100 kHz–10 mHz.
3. Results
3.1. Outdoor Exposure Test
3.1.1. Edge Creep
Figure 4 shows the changes in the edge creep width (ECW) with time for each exposure site. The ECW values obtained at the upper and lower burrs of the cut edges were not largely different. Therefore, the average value is plotted in the figure. The progress of the edge creep stopped within 24 months in some cases and not in others. For example, at OK, the ECW of CF-1 increased to about 0.5 mm in the first 12 months and then stayed constant. The ECW of CF-2 became constant at 2.5 mm after 18 months. Conversely, CR and CF-3 continued to progress even after 24 months. Although the edge creep may still progress after 24 months of exposure, the differences in the cut edge corrosion characteristics using the 24-month ECW values are discussed in this article.
When comparing the ECW at the exposure sites, it increased in the order of AZ < TYO < FL < KAG < OK. The order can be predicted from the differences in the environmental factors shown in Table 2.
The edge creep did not progress at all for all of the specimens exposed in AZ, even after two years of exposure, although red rust was observed at the cut edge. This result indicates that the sacrificial protection by the 55% Al–Zn coating did not work in AZ where the average relative humidity is 35.9% (a dry zone). At the other sites, no visible red rust was observed at the cut edges of the specimens. In TYO and FL, the edge creep for all the specimens (except CF-2) barely progressed at 12 months of exposure. It then slightly progressed to ~0.25 mm at 24 months. At KAG, a volcanic and marine environment, the ECW of all the specimens began to increase after six months of exposure. These results indicate that KAG is a more aggressive environment than TYO and FL are. At OK, the highest exposure site in average temperature, humidity, and airborne sea salt, the edge creep of all the specimens progressed significantly (especially that of CF-2), reaching 2.5 mm at 18 months. When comparing the edge creep resistance of all the specimens, it is clear that CF-2 is the worst at all exposure sites (except AZ, where the edge creep of all the specimens did not progress). The difference in the creep resistance among CF-1, CF-3, and CR is slightly complicated. At TYO, there was no significant difference in ECW except for CF-2. In FL and KAG, CF-3 showed better creep resistance than CF-1 and CR. In particular, the edge creep of CF-3 did not progress for 24 months in FL. On the other hand, at OK, the edge creep of CF-3 progressed at a considerably higher rate than that of CF-1 and CR. CF-3 showed excellent creep resistance at the moderately corrosive sites in FL and KAG, but it may not have been sufficient at the most corrosive site in OK. Finally, when comparing the performance of CF-1 with CR, CF-1 showed edge creep resistance equivalent to CR at all exposed sites. The ECW value of CF-1 at 24 months was almost the same as CR at KAG whereas CR reached an almost constant value after 18 months of exposure. However, CF-1 was still progressing even after 24 months. In contrast, at OK, the ECW of CF-1 at 24 months was slightly smaller than that of CR. The ECW of CF-1 converges to a constant value at 12 months, whereas the edge creep of CR hardly progressed until 12 months, when it started to progress (and it may continue to progress even after 24 months).
In summary, the MgV/ZnP pigment (CF-1) had equivalent cut-edge corrosion resistance to the Cr pigment (CR) at all exposure sites. The Si pigment (CF-2) had the worst corrosion resistance at the cut edge. The MgV pigment (CF-3) was poorly corrosion resistant in high temperature, high humidity, and high airborne sea salt environments such as OK, but was highly corrosion resistant in a moderate environment like FL and/or KAG.
3.1.2. Cross-section Observation
The cross-sections near the cut edge of the upward burr side on the specimens exposed in OK for two years were observed. Figure 5 shows the SEM images of the cross-sections of the cut edge of (1) CR (Cr), (2) CF-1 (MgV/ZnP), (3) CF-2 (Si), and (4) CF-3 (MgV). This photo is a cross-sectional view of approximately 400 μm from the tip of the cut edge. Since the actual edge creep width was approximately 500 μm for CR and CF-1, 2500 μm for CF-2 and 1500 μm for CF-3 (Fig. 4), the photos of CR and CF-1 are of almost whole peeled parts, and the photos of CF-2 and CF-3 are only of the tip of the peeled parts. The amount of corrosion products under the coating film was relatively small for CR and CF-1 and large for CF-2 and CF-3. Additionally, the corrosion products are observed in the area slightly away from the tip in CF-2, but in the part near the tip in CF-3. In all cases, the plating layer remained intact up to the tip of the cut edge. Only the Zn-rich layer preferentially dissolved and the Al-rich layer remained. The exposed steel surface of the cut edge was completely covered with the corrosion products of the Zn–Al coating. Among all the test specimens, CR had the thickest corrosion product layer (approximately 20 μm) on the cut edge surface.

Table 3 shows the EDS point analysis results of the corrosion products of CR (Cr) and CF-1 (MgV/ZnP). The point analysis was performed on the steel surface of the cut edge [Point (A)] and under the paint [Point (B)]. In all cases, Al and Zn were detected. A mixture of Al oxide (Al2O3), Al hydroxide [Al(OH)3], Al oxyhydroxide (AlOOH) and Zn oxide (ZnO), Zn hydroxide [Zn(OH)2] formed both at the cut edge and under the paint. Since they were exposed to the marine environment, Simonkolleite (Zn5(OH)8Cl2(H2O))24,25) may be present. Additionally, since a relatively large amount of carbon was detected (especially under the paint of CF-1), ZnCO3 may also form. When the amounts of the Al oxides and the Zn oxides are compared on the steel surface of the cut edge [Point (A)], a larger amount of Zn oxides forms on CR and a larger amount of Al oxides forms on CF-1. A larger amount of Al oxides formed under the paint on both CR and CF-1. At the edge of CR, more iron oxide was detected than at the edge of CF-1. A larger amount of Al on the sheets with the MgV/ZnP primer may correspond with better protection than the sheets with the Cr primer.
Table 3. EDS point analysis of corrosion products on the steel surface at cut edge (Point (A) in
Fig. 5) and under painted film (Point (B)).
| Analysis part | Sample name | Al | Zn | Fe | C | O |
|---|
| Cut edge | CR (Cr) | 11.7 | 27.8 | 12.9 | 12 | 29.9 |
| CF-1 (MgV/ZnP) | 24.5 | 12.4 | 6 | 16.9 | 29 |
| Under the paint | CR (Cr) | 28.7 | 12.4 | 1.3 | 11.9 | 37.9 |
| CF-1 (MgV/ZnP) | 13.5 | 6.6 | 2.6 | 37 | 28.1 |
To elucidate the effect of pigment on the edge creep, the polarization curve and EIS of 55% Al–Zn were measured in a 3% NaCl solution suspended with various pigments. Figure 6 shows the polarization curves of 55% Al–Zn [(a) cathode and (b) anode]. The oxygen reduction reaction (ORR) on 55% Al–Zn was significantly suppressed by all the pigments. When only ZnP was added, a rapid increase in current was observed from around −1.2 V. This current increase was attributed to the reduction of zinc oxide or zinc hydroxide [ZnO or Zn(OH)2] film.26,27) However, the current did not appear in the solution suspended with (MgV/ZnP). Note that electrochemically active zinc oxide does not form under the coexistence with MgV.

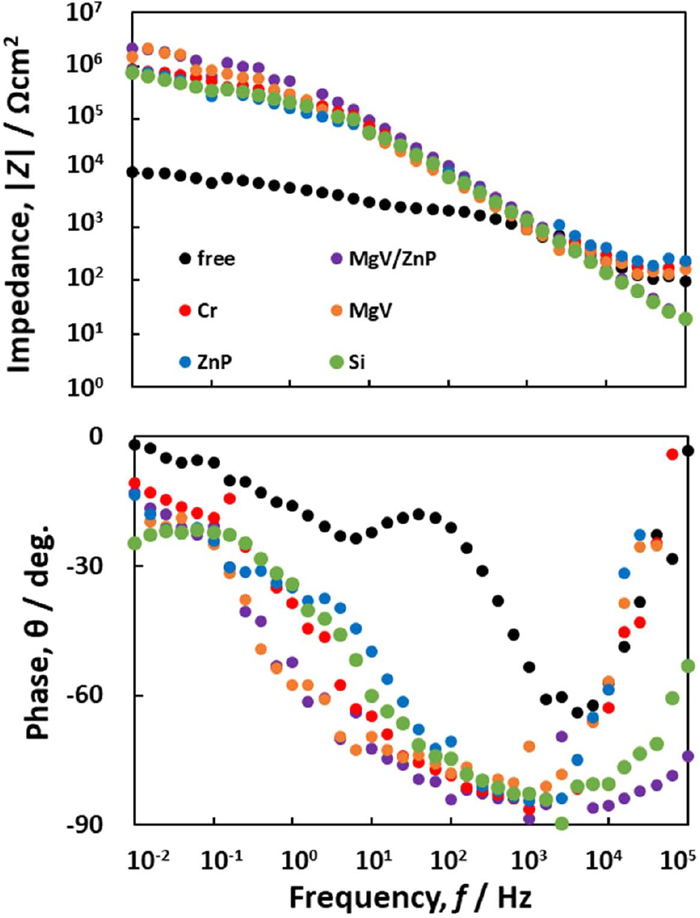
When 55% Al–Zn was anodically polarized from OCP, a passive potential region appeared, followed by a rapid increase in anodic current. The passive current was significantly suppressed by the addition of the pigments. This rapid increase in the anodic current was mainly due to the dissolution of zinc from the Zn-rich phase of the Zn–Al coating.22) The breakdown potential (Eb) at which the zinc dissolution starts shifted in the noble direction after the addition of the pigments. In other words, the pigments stabilized the passivation film. The Eb shifted to the higher potential in the order of free < Si ≈ ZnP < MgV ≈ MgV/ZnP < Cr. This anodic polarization behavior suggests that the MgV and Cr are highly effective in suppressing the dissolution of zinc from the Zn-rich phase. Figure 7 shows the EIS of 55% Al–Zn steel sheet in a 3% NaCl solution suspended with the various pigments. These are the EIS characteristics in OCP. In the absence of pigment, two time constants appear in the frequency range of 100 kHz–10 mHz. The time constant appearing in the higher frequency may be related to the film resistance and capacitance of Al oxides and the time constant in the lower frequency may be due to the charge transfer resistance and electric double-layer capacitance.22,28) In the presence of the pigments, the two time constants were not clearly separated in the frequency domain. The reciprocal of impedance at the low frequency is generally used as an index of the corrosion rate.29,30,31) The low-frequency impedance indicates that all the pigment significantly suppresses the corrosion rate of 55% Al–Zn. The EIS measurements at OCP indicate that when 55% Al–Zn is not electrically coupled with CS, the corrosion resistance of 55% Al–Zn is significantly improved by all pigments used in this experiment. Additionally, its anticorrosive effect does not depend on the pigments.
In the early stages of the corrosion of 55% Al–Zn steel sheet, the bare steel surface at the cut edge is directly exposed to the environment. Therefore, the effect of the pigments on the corrosion of CS was investigated. Figure 8 shows the polarization curves [(a) cathode and (b) anode] of CS in a 3% NaCl solution suspended with Cr and MgV/ZnP. The cathode polarization curve clearly demonstrates (a) the effect of the pigment on the ORR was extremely small compared to that on 55% Al–Zn. Cr slightly inhibited the ORR on the CS surface, whereas MgV/ZnP did not reduce the ORR. On the other hand, the anodic polarization curves (b) indicate that iron dissolution was considerably suppressed by the MgV/ZnP, and slightly by the Cr.
From the EIS for CS (Fig. 9), the corrosion rate of CS decreased with Cr and MgV/ZnP. Since the corrosion rate was reduced by almost an order of magnitude with both pigments, they may protect the CS at the cut edge when it is not electrically coupled with 55%Al–Zn.
4. Discussion
When the CS at the cut edge and the 55% Al–Zn are electrically connected through a water film (when a galvanic couple is formed between them), the cathodic reaction (the ORR) and the anodic dissolution occur at different sites. Figures 10(a) and 10(b) respectively show the schematic drawings of the corrosion at the cut edge during the early stage and the later stage.

During the early stage, the CS surface at the cut edge is not covered with the corrosion products. The bare surface of CS is directly exposed to the environment. Under the galvanic couple, the anodic dissolution occurs on the 55% Al–Zn surface. The 55% Al–Zn consists of two phases; a Zn-rich phase and an Al-rich phase, and the zinc-rich phase selectively dissolves.22) The ORR takes place on the CS surface because it is very active to the ORR, as shown in Figs. 6(a) and 8(a). At this stage, the CS at the cut edge is galvanically protected by 55% Al–Zn. Figure 11(a) shows a schematic diagram of the internal polarization curve at the early stage that describes the corrosion of 55% Al–Zn coupled with CS. As shown in Fig. 6(b), the surface of 55% Al–Zn is spontaneously passivated in a 3% NaCl solution. When it is anodically polarized to the Eb, the anodic current rapidly increases due to the onset of selective dissolution of zinc from the Zn-rich phase because the passive film in the Zn-rich phase should be less protective than that in the Al-rich phase. On the other hand, since the surface of CS is significantly active to the ORR, the cathodic polarization curve of CS shows the diffusion-controlled limiting current [Fig. 8(a)]. In Fig. 11(a), the internal polarization curves in the absence and presence of an anticorrosive pigment are indicated by the red and black lines, respectively. The potential at the intersection of the two is the corrosion potential (Ecorr) and the current at the intersection is the corrosion current (icorr) of 55% Al–Zn. Since the Eb shifts to Eb(p) by the addition of an anticorrosive pigment in the noble direction [Fig. 6(b)], Ecorr of the couple of the 55% Al–Zn and the CS will shift to a more positive value (Ecorr(p)) in the presence of the pigment. However, since the inhibitory effect of the pigment to the ORR on the CS surface is very weak [Fig. 8(a)], the corrosion current icorr(p) of 55% Al–Zn with the pigment is not that different from that of the icorr without the pigment. At the early stage, the corrosion of 55% Al–Zn is expected to proceed from the cut edge at a relatively high rate, with or without anticorrosive pigment.

In Fig. 10(b), the edge corrosion during the later stage is schematically drawn. A large amount of Al-rich porous corrosion products (Table 3) accumulated on the 55% Al–Zn surface under the paint, and the CS surface at the cut edge is completely covered with a Zn-rich corrosion product film (Fig. 5). The main reaction of the anodic reaction of corrosion is the selective dissolution of zinc from the Zn-rich phase of 55% Al–Zn. The dissolved zinc ions move through the porous corrosion product to the CS surface at the cut edge by migration and/or diffusion. A smaller amount of dissolved Al ions remains under the polymer coating as aluminum oxides, leading to the formation of the Al-rich corrosion products (Table 3). The cathodic reaction progresses on the cut edge of the CS surface, but the activity against the ORR is significantly reduced by the corrosion product deposition. Therefore, the ORR of the galvanic couple proceeds not only on the CS cut edge surface, but also on the 55% Al–Zn surface. As a result, the CS at the cut edge is protected by both the barrier effect of the mixed Al–Zn corrosion products (Zn-rich) and the galvanic coupling with 55% Al–Zn. Figure 11(b) shows the internal polarization curve when the CS at the cut edge is fully covered with the corrosion products and describes the cut edge corrosion at the later stage. The ORR on the CS surface is significantly suppressed by the deposit of the Al–Zn corrosion products. In this case, the ORR is no longer diffusion-controlled, and the ORR current is dependent on potential, as shown by the red curve in Fig. 11(b). The anodic dissolution of 55% Al–Zn is also slightly suppressed by the deposit of the corrosion products. As a result, the corrosion current (icorr) of 55% Al–Zn is expected to be slightly smaller than the curve at the early stage. The black curve in Fig. 11(b) is the internal polarization curve in the presence of the anticorrosive pigment. Since the ORR on the 55% Al–Zn surface is strongly suppressed by the pigment (Fig. 6), the ORR on the CS surface covered with the Al–Zn corrosion products is also suppressed by the pigment, unlike the bare CS surface. Additionally, the onset potential (Eb) of the zinc dissolution shifts significantly in the positive direction by the addition of pigment. Therefore, from Fig. 11(b), it is predicted that the corrosion rate (icorr(p)) in the presence of the pigment will be considerably smaller than that of the pigment-free material (icorr). Thus, the progress of the cut edge corrosion is increasingly suppressed as Eb becomes higher. The Eb values of MgV, MgV/ZnP, and Cr are clearly higher than those of ZnP and Si [Fig. 6(b)]. In the evaluation of the edge creep by the 24-month exposure test (Fig. 4), MgV/ZnP and Cr showed excellent edge creep resistances, and Si showed a poor resistance. The Eb obtained from the anodic polarization curve demonstrated a good correlation with the evaluation results of edge creep. Therefore, the difference in the anticorrosion effect of the pigments in the primer of 55% Al–Zn is due to the difference in the ability to suppress the selective dissolution of zinc from the Zn-rich phase. Additionally, the inhibitory effect of the Al–Zn oxide film that forms on the CS surface on the ORR plays an important role in reducing the galvanic current. From the analysis of the oxide films (Fig. 5), those with a different composition ratio of Al and Zn were formed on CS in MgV/ZnP and Cr. In the future, it is necessary to investigate the ORR inhibitory ability of the Al–Zn corrosion product film formed on CS by electrically coupling it with 55% Al–Zn.
5. Conclusions
The prepainted 55% Al–Zn steel sheets with four different anticorrosive pigments (Cr, MgV/ZnP, Si, and MgV) in the primer were exposed at five locations (AZ, TYO, FL, KAG, and OK) for 24 months to evaluate the anticorrosion property of the pigments. Electrochemical tests of the 55% Al–Zn steel and the CS were performed in 3% NaCl solution suspended with the pigments to describe the edge creep resistance of the pigments. The following conclusions were drawn.
(1) The cut edge creep did not progress in any of the pigments in AZ (dry desert), but red rust was observed on the CS at the cut edge. At all the other exposure sites, the cut edge creep property of Si was the worst, and MgV/ZnP was comparable to that of Cr.
(2) EDS analysis indicated Al-rich corrosion product was deposited on the 55% Al–Zn surface under the paint. EDS analysis also indicated that Zn-rich Al–Zn mixed oxide films formed on the CS surface at the cut edge. The mixed oxide film for MgV/ZnP contained a higher content of Al than the other pigments.
(3) The effect of the pigment on the creep property at the cut edge was successfully explained by the anodic polarization curve of 55% Al–Zn steel and the cathodic polarization curve of CS. The anticorrosive pigment strongly suppressed the zinc dissolution during the Zn-rich phase. The Al–Zn oxide film that formed on the CS surface at the cut edge may also play an essential role in the progress of the edge creep.
Acknowledgment
The authors acknowledge SUGA Weathering Technology Foundation for providing the outdoor exposure test sites and meteorological data.
References
- 1) D. J. Blickwede: Tetsu-to-Hagané, 66 (1980), 821 (in Japanese).
- 2) T. Ooi: J. Surf. Finish. Soc. Jpn., 62 (2011), 8 (in Japanese).
- 3) M. Sagiyama: J. Surf. Finish. Soc. Jpn., 54 (2003), 316 (in Japanese).
- 4) H. Furukawa and H. Kanai: J. Jpn. Coat. Technol. Assoc., 48 (2013), 543 (in Japanese).
- 5) M. Ehara: J. Jpn. Inst. Light Met., 50 (2000), 584 (in Japanese).
- 6) T. Aoe: J. Surf. Finish. Soc. Jpn., 49 (1998), 221 (in Japanese).
- 7) O. Gharbi, S. Thomas, C. Smith and N. Birbilis: npj Mater. Degrad., 2 (2018), 12.
- 8) JIS G 3322: 2019, Prepainted hot-dip 55% aluminium-zinc alloy-coated steel sheet and strip (in Japanese).
- 9) T. Tsujita, N. Nishida, Y. Takeuchi and K. Ohsawa: J. Jpn. Coat. Technol. Assoc., 49 (2014), 232 (in Japanese).
- 10) T. Prosek, A. Nazarov, A. Le Gac and D. Thierry: Prog. Org. Coat., 83 (2015), 26.
- 11) K. Ueda, A. Takahashi and Y. Kubo: Proc. 8th Int. Conf. on Zinc and Zinc Alloy Coated Steel Sheet (Galvatech 2011), (Genova), AIM, Milano, (2012), 13.
- 12) T. Shinohara: J. Surf. Finish. Soc. Jpn., 62 (2011), 25 (in Japanese).
- 13) Y. Sugawara, K. Araake, I. Muto, M. Takahashi, M. Matsumoto and N. Hara: ISIJ Int., 56 (2016), 2267. https://doi.org/10.2355/isijinternational.ISIJINT-2016-336
- 14) H. E. Townsend: Corrosion, 54 (1998), 561. https://doi.org/10.5006/1.3284884
- 15) H. Nomura: J. Surf. Finish. Soc. Jpn., 70 (2019), 588 (in Japanese).
- 16) JIS Z 2371: 2015, Methods of salt spray testing (in Japanese).
- 17) JASO M609-91: 1991, Corrosion test method for automotive materials (in Japanese).
- 18) H. Kajiyama, S. Fujita, K. Fujii and M. Sakai: Zairyo-to-Kankyo, 55 (2006), 356 (in Japanese).
- 19) H. Matsuda, A. Sakamoto, M. Hayashi and Y. Miyoshi: Zairyo-to-Kankyo, 61 (2012), 64 (in Japanese).
- 20) Y. Sato: Corros. Eng. (Jpn.), 32 (1983), 166 (in Japanese).
- 21) I. Sekine, Y. Toshima and M. Yuasa: J. Jpn. Soc. Colour Mater., 66 (1993), 724 (in Japanese).
- 22) A. Nishikata, T. Tsuda and T. Tsuru: Tetsu-to-Hagané, 95 (2009), 565 (in Japanese).
- 23) F. Deflorian, L. Fedrizzi and S. Rossi: Corrosion, 54 (1998), 598. https://doi.org/10.5006/1.3287635
- 24) W. Feitknecht: Chem. Ind., 36 (1959), 1102.
- 25) T. E. Graedel: J. Electrochem. Soc., 136 (1989), 193C.
- 26) A. P. Yadav, A. Nishikata and T. Tsuru: J. Electroanal. Chem., 585 (2005), 142.
- 27) C. Deslouis, M. Duprat and C. Tulet-Tournillon: J. Electroanal. Chem. Interfacial Electrochem., 181 (1984), 119.
- 28) H. Katayama, Y. Tay, A. S. Viloria, A. Nishikata and T. Tsuru: Mater. Trans., JIM, 38 (1997), 1089.
- 29) M. Stern and A. L. Geary: J. Electrochem. Soc., 104 (1957), 56.
- 30) M. Maeda, X. Y. Li, A. Ooi, E. Tada and A. Nishikata: ISIJ Int., 60 (2020), 337.
- 31) A. P. Yadav, A. Nishikata and T. Tsuru: ISIJ Int., 44 (2004), 1727.


