Abstract
In order to clarify the mechanism of abnormal grain growth of austenite in case hardening steel, in-situ observation using high temperature EBSD was performed with JIS SCM420 containing Nb (0.2C-0.2Si-0.8Mn-1.1Cr-0.2Mo-0.024Nb steel in mass%). After heating at 1143 K, two growing grains several times larger than the surrounding grains were observed. These growing grains grew abnormally at 1193 K and became adjacent to each other. The abnormal grains were observed as if they were one larger abnormal grain since the boundary between the two abnormal grains is a twin boundary. The growth rate of abnormal grain growth of austenite is faster in the early stage of growth and negligibly small in the latter stage of growth. The grain size in abnormal grain growth is decided by rapid grain growth during a short period in the early stage. The formation of growing grains in abnormal grain growth of austenite is not affected by orientation and strain distribution. When distantly located grains with a twin relationship inherently are adjacent to each other during the grain growth process, the new interface becomes twin, resulting in austenite grain connection, which doubles the area surrounded by the high angle grain boundary excluding twin boundaries. In addition to encroachment of surrounding grains by larger grains, austenite grain connection also affects abnormal grain growth of austenite.
1. Introduction
Carburizing, quenching and tempering is a surface-hardening heat treatment process for improving fatigue properties and is widely applied to automobile gears and other parts. During carburizing, abnormal grain growth of austenite (γ) would occur due to higher temperature and longer holding time in the γ region. Because abnormal grain growth of γ causes a decrease in the toughness1) and fatigue strength2) of carburized parts, it is necessary to prevent the occurrence of abnormal grain growth.
Gladman proposed the conditions for abnormal grain growth by considering the pinning force against grain boundaries exerted by precipitate particles and the driving force of grain growth.3) According to this theory, abnormal grain growth occurs when the driving force of grain growth is larger than the pinning force. The driving force of grain growth increases with becoming finer average grain size, and becoming larger grain size ratio between growing and average sized grain. As a result, encroachment of fine grains by the growing grain progresses and abnormal grain growth occurs. Based on this theory, abnormal grain growth of γ has been mainly discussed from the viewpoint of the pinning force and the driving force of grain growth.
Regarding the pinning force against the grain boundaries exerted by precipitates, there have been many studies4,5,6,7,8,9,10) on fine precipitate particles with sizes of several nm to several tens of nm such as NbC, TiC and AlN, and some studies11,12) on spheroidized cementite. In those studies, the effects of the precipitation or dissolution behavior of pinning particles, the Ostwald ripening behavior of pinning particles, and the size distribution of pinning particles on abnormal grain growth has been reported. With respect to the driving force of grain growth, heat treatment and processing conditions such as normalizing, hot forging, and cold forging would affect the abnormal grain growth of γ by changing the grain size distribution after reverse transformation (α → γ) during carburizing heating.5,7,13,14,15)
Abnormal grain growth is an important metallurgy not only in γ but also in ferrite (α). In particular, grain-oriented electrical steel sheets have been studied a lot to improve magnetic properties by utilizing abnormal grain growth of α. The pinning force and the driving force of grain growth have been discussed also in electrical steel sheets.16,17) In addition, the preferential growth orientation called the Goss grain18) has been studied for its growth mechanism19,20) and the specificity of interfacial properties such as the frequency of the coincidence site lattice.21,22)
Incidentally, since there are no studies which directly observes the crystal orientation of abnormal grain growth of γ during carburizing, the existence of a preferential growth orientation has not been clarified. In γ as well as in α, the interfacial properties are considered to affect the driving force of grain growth through the effect on grain boundary energy, however no studies have been mentioned it so far. That is mainly because the γ in case hardening steel is a phase which exists only at a high temperature above the transformation temperature, and it is difficult to directly observe the crystal orientation. A method of observing prior γ grain was the mainstream which a sample was quenched from a carburizing temperature and the prior γ grain boundary was revealed with etching technique.23) However, since martensitic transformation accompanies for quenching, the orientation of γ during carburizing cannot make clear by etching method. Recently, the method of predicting and reconstructing the orientation of γ from the measured orientation of martensite using the orientation relationship between γ and martensite has also been developed.24) This method is useful for analyzing the microstructure after grain growth, however it is a crucial problem that the same crystal grains cannot be observed continuously during carburizing, because the sample is quenched to observe prior γ grain.
As described above, many studies have been reported on abnormal grain growth of γ, nevertheless in the conventional methods, the same grains in the same test piece have never been observed continuously. Therefore, the actual behaviors of abnormal grain growth of γ regarding its orientation, interfacial properties, growth rate, and position of initiation has not been made clear. Clarifying the mechanism of abnormal grain growth of γ by investigating these actual behaviors is important to obtain a solution to prevent abnormal grain growth during carburizing. In this study, the microstructural changes of a case hardening steel were observed in-situ at the same position in the same test piece, and the features and actual behaviors of abnormal grain growth of γ were investigated.
2. Experimental Procedure
2.1. Sample Steel
Table 1 shows the chemical compositions of the steel used in this study. JIS SCM42025) is a normal standard case hardening steel which has AlN precipitates as pinning particles to suppress abnormal grain growth. Therefore about 0.01% of N is added in SCM420. However, in a high temperature and vacuumed environment, as in-situ observation described later, the N in the steel escapes from the surface, which decreases the amount of AlN.26) As a result, the pinning force decreases unstably during in-situ observation. In order to minimize this phenomenon, in this study, the amount of AlN dispersed in the sample was reduced as much as possible by reducing the N content in the steel to 0.0016%, and then NbC was mainly dispersed as pinning particles by adding 0.024% of Nb. The sample steel was melted to obtain a 100 kg steel ingot by vacuum induction melting. After heating to 1493 K, the ingot was forged into a round bar having a diameter of 40 mm, which normalizing was performed in the condition of holding at 1173 K for 3.6 ks followed by air cooling.
Table 1. Chemical compositions of steel used in this study.
| (Mass%) |
|---|
| Steel | C | Si | Mn | Cr | Mo | Al | N | Nb |
|---|
| SCM420+Nb | 0.20 | 0.20 | 0.81 | 1.06 | 0.16 | 0.023 | 0.0016 | 0.024 |
In order to promote abnormal grain growth during in-situ observation, the sample steel was subjected to the following cold working and heat treatment. The reason is that cold working promotes finer reverse transformed γ due to finer recrystallized α in following heat treatment, and uniform and large strain is introduced into the specimen by quenching to cause martensitic transformation. Cold working was conducted in accordance with the cold upset compression test method established by the Cold Forging Subcommittee of the Japan Society for Technology of Plasticity.27) Cylindrical specimens with a diameter of 15 mm and a height of 22.5 mm were cut from the sample steel, and compressed by using a die with concentric grooves. The specimen was compressed at a height reduction of 70%, and α recrystallization could promote in the following heat treatment.7) After holding at 1173 K for 180 s, the specimen was quenched by water to obtain martensite having fine grains and uniform large strain. As shown in Fig. 1, a plate having a height of 5 mm, a width of 7 mm, and a thickness of 0.8 mm was cut out from the center of the specimen for the in-situ observation test.

Precipitate particles were observed with a transmission electron microscope (TEM). The specimens were prepared by replica method from the center of the test piece before and after in-situ observation. The precipitate particles were identified with an energy dispersive X-ray spectroscope (TEM-EDX) mounted in the TEM. Precipitate particle size was evaluated as the average equivalent circle radius by analyzing two hundred precipitate particle areas using image analysis software Image-Pro PLUS (developed by Media Cybernetics).
In order to confirm changes in the alloy concentration near the surface during in-situ observation process, the cross section passing through the center of the test piece after in-situ observation was analyzed with an electron probe micro analyzer (EPMA).
2.4. In-situ Observation Method
When manufacturing parts, the gas carburizing conditions are generally adjusted in response to the required specifications of the parts. For example, the temperature is applied from 1163 K to 1223 K, while the holding time may vary from 3.6 ks to 144 ks. In this study, the in-situ observation test was conducted according to the procedure shown in Fig. 2, assuming gas carburizing at a temperature of 1193 K and a holding time of 3.6 ks. The test piece was placed in a scanning electron microscope (SEM) with a special holder for heating. Firstly, the crystal orientation was measured by the electron back scattering diffraction pattern method (EBSD) at room temperature. Then, the test piece was heated once to 1143 K at a heating rate of 0.53 K/s and immediately cooled to 1103 K at a cooling rate of 0.53 K/s, and the crystal orientation was measured at that temperature. As A3 temperature of the sample steel is 1076 K (calculated by Thermo-Calc), the EBSD measurement temperature of 1103 K is a relatively low temperature of the γ single phase region for the sample steel. Therefore, the grain growth during the EBSD measurement is negligible. Subsequently, EBSD measurement was also performed after cooling to 1103 K, followed by EBSD measurement immediately after heating to the general carburizing temperature of 1193 K at a rate of 0.53 K/s holding a total of 3.6 ks at the same temperature. In order to fix the measurement position of the in-situ observation accurately, Vickers hardness indentations as marks were made in the vicinity of observation position in advance. Since it is difficult to predict the location of abnormal grain growth, in-situ observations were carried out for many fields. The measurement time per one field at 1103 K was about 180 s, and the total measurement time for each field was about 1.6 ks. In the following observation results, the grain growth behavior was compared at the position where normal grain growth and abnormal grain growth were observed.

The conditions for EBSD measurement were an acceleration voltage of 20 kV, and a step size of 0.3 μm at room temperature and 0.7 μm at 1103 K. The inverse pole figure map (IPF map), intensity distribution of IPF (IPF distribution), grain boundary map (GB map), kernel average misorientation map (KAM map), and γ grain size were analyzed and outputted by the crystal orientation analysis software OIM Analysis version 8.0 (manufactured by TSL). The IPF map and IPF distribution were referred to the direction parallel to the cold compression axis. The grain size was evaluated by converting the area surrounded by high angle grain boundaries with a misorientation of 15° or more with equivalent circle radius (Twin boundary was excluded from the area).
3. Experimental Results
3.1. Precipitate Particles before and after In-situ Observation
The observation results of the precipitate particles before and after the in-situ observation are shown in Figs. 3(a) and 3(b), respectively. As a result of the TEM-EDX analysis, the precipitate particles were identified as NbC. The size distributions of the NbC particles before and after observation are shown in Figs. 3(c) and 3(d), respectively. Comparing with before and after the in-situ observation, the size of the NbC particles increased from an average radius of 3.3 nm to 3.5 nm due to Ostwald ripening. The size of Ostwald ripening is reasonable compared with a previous study.11) It is considered that the Ostwald ripening of the NbC particles during in-situ observation makes abnormal grain growth more likely because it decreases the pinning force by decreasing the number of pinning particles.

The volume fraction of NbC during in-situ observation is estimated to be 2.4 × 10⁻⁴ by the densities of γ29) and NbC30) and the amount of Nb used for precipitates at 1193 K calculated from the NbC solubility product.28) On the other hand, it is calculated that all AlN is solid-soluted at 1193 K from the solubility product of AlN31) in γ, and AlN precipitates were not observed in the TEM observation. Based on these facts, the pinning particles in the sample steel are mainly NbC precipitates, and those are dispersed very finely and uniformly compared to crystal grain size of micrometre order. Therefore, the pinning force against the grain boundaries by the NbC particles is considered to act uniformly in the test piece because a large number of NbC particles exist inside each crystal grain. It is judged to be same condition in the pinning force at the position where normal grain growth and abnormal grain growth were observed.
3.2. Changes in Alloy Distribution due to In-situ Observation
Figure 4 shows the results of the EPMA analysis of the test piece after in-situ observation. It shows that the volume fraction of NbC particles did not change significantly in the surface of test piece during the in-situ observation test because the concentrations of C and Nb were almost the same in the surface and inside the test piece (Figs. 4(a), 4(c)). On the other hand, the Mn concentration showed a slight decrease in the surface. The possibility of Mn evaporation from the surface has been reported in a study of high temperature in-situ observation with a steel containing Mn.32) Also in this study, Mn is considered to have evaporated from the surface during in-situ observation test. However the effect on the grain growth of γ was judged to be negligible because the decrease in the Mn concentration on the surface was very small (Fig. 4(b)) and γ single phase was maintained during in-situ observation.
3.3. In-situ Observation of Grain Growth of γ
Figure 5 shows the results of in-situ observation. In each field of view, the typical martensitic microstructure was observed in the room temperature measurement, while a γ single phase was clearly observed in in-situ observation at high temperature. As the holding time at 1193 K increased, γ grain growth was observed, and in some fields of view, extremely coarse γ grains were observed compared to the surrounding grains, indicating abnormal grain growth of γ. In addition, the measurement results at room temperature show a vertical stripe pattern (Figs. 5(a), 5(g)). This may have been caused by the drift of the sample during room temperature measurement, and the carbon paste on the back of the specimen may not have solidified sufficiently to adhere to the sample holder for heating. In the measurement of γ grains at high temperature, the vertical stripe pattern was disappeared and relatively good quality images were obtained.

The linear boundaries often found inside equiaxed γ grains are annealing twins. Annealing twins are commonly observed in non-ferrous metals with fcc structure such as Cu and Al, and austenitic stainless steels, and is related with smaller stacking fault energy.33) In the following, annealing twins are simply described as twins.
In general, twin boundaries have excellent corrosion resistance due to their low interfacial energy,34) and are difficult to be revealed by normal etching. Then, in the conventional studies on abnormal grain growth of γ, where the prior γ grain boundary was revealed by etching, the γ grain size has been evaluated as the area surrounded by the high angle grain boundary excluding the twin boundary or its equivalent circle radius.
The grain boundary maps of the field of view where the abnormal grain growth occurred are shown in Fig. 6, where the misorientation difference of 15° or more, excluding the twin boundary, is indicated by a black line. Microstructures similar to that of the prior γ revealed by the conventional etching method and observed by optical microscopy were obtained. The grain size is defined by converting the area surrounded by high angle grain boundaries with a misorientation of 15° or more with equivalent circle radius (Twin boundary was excluded from the area).

In the field of view with abnormal grain growth, two grains several times larger than the surrounding average grain size were observed immediately after heating to 1143 K and 1193 K (Figs. 5(h), 5(i), 6(a), 6(b)). These two larger γ grains grew by increasing the holding time at 1193 K and are adjacent to the two (Figs. 5(j), 6(c)). The boundary created by neighboring of these larger grains consists of a twin boundary, which is observed as if two abnormal grains are combined to form abnormally coarse grain.
In the following, these two grains immediately after heating at 1143 K are referred to as growing grain GN1 and GN2 of abnormal grain growth of γ. GN1 or GN2 after 1193 K heating are then referred to as G1 or G2. After G1 and G2 were adjacent, the grain consisting of a high angle grain boundary excluding twin boundary is referred as a connected grain.
3.4. Growth Rate of Abnormal Grain Growth of γ
Direct and continuous observation of abnormal grain growth of γ was difficult in the conventional study. Therefore, it was not clear whether the abnormal increase in the grain growth rate occurred only for a very short time or whether the grain growth rate increased over a long period. The growth rate of abnormal grain growth was verified based on the in-situ observation results.
The EBSD data obtained by in-situ observation was analyzed to determine the area surrounded by high angle grain boundaries with a misorientation of 15° or more, excluding the twin boundaries. Then the γ grain size was evaluated by converting the area with equivalent circle radius. Figure 7 shows the change of the γ grain radius in the in-situ observation. The grain sizes of growing grains GN1(G1) and GN2(G2) and their connected grain, and the average grain size in the field of normal grain growth were compared. After reaching 1143 K, GN1 and GN2 were already coarse compared to the average grain. G1 and G2 grew rapidly to the same extent. Then, they shifted to slow growth after they were adjacent*.

Figure 8 shows the growth rate of the γ grain radius. The growth rate in heating from 1143 K to 1193 K was calculated by dividing the change in grain size by the heating time, and the growth rate holding at 1193 K was calculated by dividing the change in grain size by the holding time. The growth rates of the average grain and the growing grains GN1(G1) and GN2(G2) are either highest at the beginning of heating and show a tendency to decrease with increasing holding time. The growth rates of GN1(G1) and GN2(G2) were 10 to 20 times faster than that of the average grain during heating and holding. The growth rates of G1 and G2 decreases after they were connected, nevertheless it is still more than 10 times higher than the average grain. G1 and G2 were connected between the temperature reached 1193 K and held for 0.9 ks at that temperature (Figs. 6(b), 6(c)). The growth rate of the abnormal grain growth of G1 is calculated to be 45 times faster than that of the average grain if the γ grain connection is included in calculation. Thus, the connection of γ grains causes a sudden increase in the grain size. At the time of connection of G1 and G2, another new orientation is connected via twin boundaries, which also affects the increase in the growth rate.

Now we need to pay attention to the fact the growth rate of abnormal grain itself decreases as the holding time increases even though the growth rate of abnormal grain is always higher than that of average grain. That is, in the abnormal grain growth of γ, the growth rate is negligibly small in the latter stage, and the final grain size is decided by rapid grain growth for a short period in the early stage.
* Area after holding for 0.9 ks (equivalent circle radius): G
1=3453
μm
2 (33.2
μm), G
2=4049
μm
2 (35.9
μm)
Area of connected grain (equivalent circle radius): G1+G2=7502 μm2 (48.9 μm)
4. Discussion
4.1. Conventional Theory of Abnormal Grain Growth
The abnormal grain growth of γ observed in the in-situ observation was discussed as follows based on the conventional theory.
4.1.1. Gladman’s Theory3)
The conditions for abnormal grain growth due to encroachment of neighbor grains by specific growing grains have been proposed as follows from the relationship between the driving force of grain growth and the pinning force by precipitate particles.
|
r*=
6
R
0
f
π
(
3
2
-
2
Z
)
-1
| (1) |
r* is the critical radius of a precipitate particle which causes abnormal grain growth, R0 is the average γ grain radius, and f is the volume fraction of the precipitate particles. Z can be considered to be 1.7 in a two-dimensional field of view.35,36) According to this equation, abnormal grain growth occurs when precipitate particles having a radius larger than the critical radius of precipitate particle r* are dispersed.
The critical precipitate particle radius r* was calculated by using the actual measured average grain radius R0 (Fig. 7) and the volume fraction of NbC (f=2.4 × 10⁻⁴) obtained from the solubility product. Figure 9 shows the transition of r* in the in-situ observation. The figure also shows the measured NbC particle radius before and after the in-situ observation (Fig. 3). Immediately after heating to 1143 K, the measured NbC particle radius is larger than the critical precipitate particle radius r*, satisfying the condition for abnormal grain growth. Therefore, it is reasonable that the growing grains GN1 and GN2, which are several times larger than the surrounding grains observed in Fig. 6(a), will show abnormal grain growth. On the other hand, after heating at 1193 K, the measured NbC particle radius is smaller than the critical precipitate particle radius r*, not satisfying the condition for abnormal grain growth. Ogino37) discussed the growth or shrinkage rate of crystal grains by applying Gladman’s idea3) of pinning force to Hillert’s35) “Defect model,” which considered the opposition between large grains and average grains. According to this, abnormal grain growth proceeds when the grain having three times larger size than average grain size exists. The growing grains GN1 and GN2 observed immediately after heating to 1143 K satisfied this condition. Therefore, they showed abnormal grain growth during subsequent heat treatment.

In grain-oriented electrical steel sheets, Goss grain is well known as preferential growth grain. In the theoretical analysis38) by the statistical grain growth model, the criterion of abnormal grain growth is explained by treating the grain boundary energy of abnormal grain and average grain separately for considering the driving force of grain growth and pinning force. In the analysis, the specific oriented grain grows preferentially when normal grain growth is suppressed by the pinning force. In addition, specificity in the grain boundary energy of the growing grain is also required. Preferential growth occurs due to the high frequency of the coincidence boundaries having low-energy interfaces in the case of Goss grain. On the contrary, it has been pointed out that abnormal grain growth does not occur when there is no specificity in grain orientation. In the following, the characteristics of the growing grain of abnormal grain growth of γ are discussed.
Figure 10 shows the IPF distribution of γ immediately after heating to 1143 K. The positions of normal grain growth and abnormal grain growth develop the texture with the orientation of (101)γ and (012)γ. The accumulation degree is also the same degree. The authors have already confirmed the similar texture with (101)γ and (012)γ is obtained when cold compression and subsequent heating.39) This texture is considered to be inherited through martensitic transformation by quenching before in-situ observation and reverse transformation to γ in heating during in-situ observation test. The growing grains GN1 and GN2 of the abnormal grain growth observed in in-situ test have different orientations from each other: the growing grain GN1 is close to (111)γ and does not belong to the accumulated orientation, while the growing grain GN2 is close to (101)γ and belongs to the accumulated orientation (Fig. 5(h)). Although, each becomes a growing grain and causes abnormal grain growth. Therefore, there is no preferential growth orientation in the abnormal grain growth of γ, and the effect of the texture is also small.

Figure 11 shows the KAM map immediately after heating to 1143 K of the position where abnormal grain growth will occur later. The white lines in this figure show the outlines of the growing grains GN1 and GN2. The KAM value is an indicator showing the local strain based on the local change in crystal orientation among analyzed points. GN1 has almost the same strain as the surrounding grains, however GN2 has a slightly smaller strain. Although GN1 and GN2 have different strain distributions, each of them becomes a growing grain and causes abnormal grain growth. Therefore, the effect of the strain distribution on the growing grain of abnormal grain growth of γ is small.

The orientation immediately after the γ reverse transformation was not measured in this study. In order to consider the location where the growing grains occur, we analyzed the previous microstructure. Figure 12 shows the IPF map and KAM map obtained by room temperature measurement before in-situ observation of the position where the abnormal grain growth occurs later. The outlines of the white and black lines in the figure correspond to the positions where the growing grains GN1 and GN2 occur later. The size of the previouse microstructure and the intragranular strain affect the γ grain size through the effect on the nucleation behavior of reverse transformation of γ. However, the distribution of the γ grain size after the reverse transformation is not considered to be extraordinary since the positions of GN1 and GN2 have almost the same microstructural size and intragranular strain as the surrounding region. It suggests that the effect of the γ grain size distribution on the formation of growing grains of abnormal grain growth of γ is small. However, just after finishing the γ reverse transformation, grain size variation is considered to be large because it is the initial stage of grain growth. We cannot deny the possibility that the large and small grains are adjacent to each other, causing an increase in the grain size difference. In the case, the driving force of grain growth increases locally, thereby resulting in the abnormal grain growth.

From the above, the growing grains of abnormal grain growth of γ are not affected by the texture and have no specificity in terms of crystal orientation and intragranular strain. Therefore, the abnormal grain growth of γ cannot be explained by the statistical grain growth model of grain-oriented electrical steel sheets. The location where the growing grains occurred may have been a place where the grain size difference was accidentally large.
4.2. Effect of Twin Formation on γ Grain Growth
Figure 13 shows an IPF map focusing on the connecting part of abnormal grains after holding for 1.8 ks and 3.6 ks at 1193 K. The figure also includes a grain boundary map that shows the twin boundaries separately. Each grain is named as shown in Fig. 13(a). TGN1 is a grain that is adjacent to and has twin relationship with the growing grain GN1. T’GN1 is another grain that is adjacent to and has twin relationship with TGN1. The abnormal grain G1, which consists of high angle grain boundaries excluding twin boundaries, is composed of GN1, TGN1 and T’GN1. Similarly, TGN2 is a grain that is adjacent to and has twin relationship with the growing grain GN2. The abnormal grain G2 is composed of GN2 and TGN2. After holding for 1.8 ks (Figs. 13(b), 13(d)), the grain indicated as “Other grain” in the figure existing between T’GN1 and TGN2 has the relationships of high angle grain boundaries to T’GN1 and TGN2. This “Other grain” disappeared after holding for 3.6 ks (Figs. 13(c), 13(e)), and a new grain boundary consisting of T’GN1 and TGN2 appeared. The orientation relationship between T’GN1 and TGN2 was inherently a twin relationship because the new grain boundary was a twin boundary. The probability that the interface has a twin (Σ3) relationship in randomly oriented grains is calculated to be 3.5%.40) It is not negligible. The combination of T’GN1 and TGN2 is considered to fall under this. Even if it happens to be, such twin boundaries are important as a factor of γ grain growth because it increases the area surrounded by high angle grain boundaries excluding twin boundaries, and hence increases the grain size. As shown in Fig. 13(e), the interface between T’GN1 and TGN2 is not an ideal twin relationship compared to other twin boundaries and has a large deviation (about 4°) from the ideal angle. The deviation from the ideal angle of the twin boundary is inferred to be a sign of relaxing the interfacial strain accompanying the neighboring of T’GN1 and TGN2 by the introduction of dislocations.
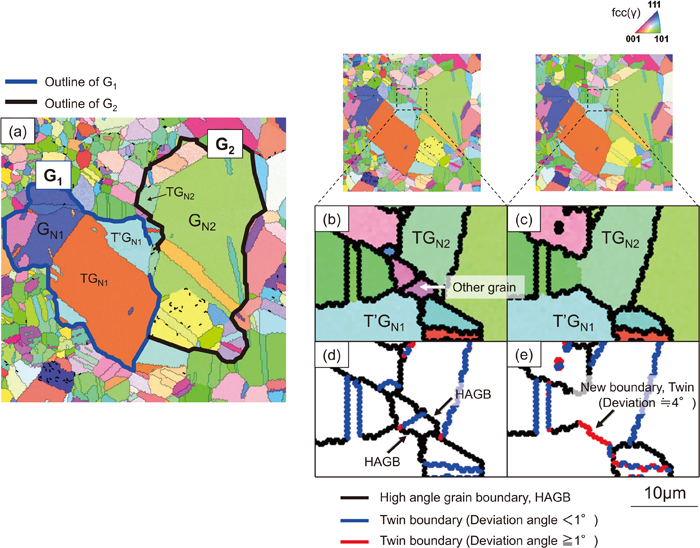
Figure 14 is a schematic illustration of the γ grain growth process observed in the in-situ test. In most usual cases during the grain growth process as shown in Fig. 14(a), Grain 2 shrinks and disappears while Grain 1 and 3 grow in order to reduce the total area of high angle grain boundaries. However, in some cases, as shown in Fig. 14(b), there are combinations of grains having a twin relationship inherently, such as Grain 1 and Grain 3. In this case, when Grain 2 shrinks and disappears, the interface between Grain 1 and Grain 3 becomes a twin boundary, and γ grain connection occurs, which doubles the area surrounded by the high angle grain boundaries excluding twin boundaries. Such γ grain connection certainly affects the abnormal grain growth behavior of γ because it was confirmed at the interface of the abnormal grains G1 and G2 observed in this study (Fig. 13).
5. Conclusions
The microstructural changes in abnormal grain growth of γ in case hardening steel were considered throughout in-situ observation of the same position in the same test piece. As the results, the following conclusions were obtained. In this study, the γ grain size is defined as the area surrounded by high angle grain boundaries excluding twin boundaries or its equivalent circle radius.
• Immediately after heating at 1143 K, two growing grains which are several times larger than the surrounding grains were observed. These grains grew abnormally at 1193 K and became adjacent each other. Since the boundary of the neighboring grains was a twin boundary, the two abnormal grains of γ were connected and observed as much a larger abnormal grain.
• The growth rate of abnormal grain growth of γ is faster in the early stage of growth and negligibly small in the latter stage of growth. That is, the grain size in abnormal grain growth is decided by rapid grain growth during a short period in the early stage.
• It was considered that the crystal orientation and intragranular strain do not affect the formation of growing grains of abnormal grain growth of γ.
• When distantly located grains with a twin relationship inherently are adjacent to each other during the grain growth process, the new interface becomes twin, resulting in γ grain connection, which doubles the area surrounded by the high angle grain boundary excluding twin boundaries. In addition to encroachment of surrounding grains by larger grains, γ grain connection also affects abnormal grain growth of γ.
References
- 1) M. Nishikawa and K. Hiraoka: Sanyo Tech. Rep., 14 (2007), 42 (in Japanese).
- 2) T. Urita, K. Namiki and T. Iikubo: Electr. Furn. Steel, 59 (1988), 33 (in Japanese).
- 3) T. Gladman: Proc. R. Soc. Lond. A, 294 (1966), 298.
- 4) T. Murakami, H. Hatano and H. Yaguchi: Kobe Steel Eng. Rep., 56 (2006), No. 3, 59 (in Japanese).
- 5) K. Hashimoto: J. Jpn. Soc. Technol. Plast., 46 (2005), 304 (in Japanese).
- 6) K. A. AlOgab, D. K. Matlock, J. G. Speer and H. J. Kleebe: ISIJ Int., 47 (2007), 1034.
- 7) T. Fujimatsu, M. Nakasaki, S. Fukumoto and A. Yamamoto: Tetsu-to-Hagané, 95 (2009), 161 (in Japanese).
- 8) M. Kubota and T. Ochi: Shinnittetsu Giho, 378 (2003), 72 (in Japanese).
- 9) N. Kamiya, Y. Tanaka, K. Inoue and R. Ishikura: Electr. Furn. Steel, 88 (2017), 85 (in Japanese).
- 10) N. Kamiya, Y. Tanaka and R. Ishikura: Electr. Furn. Steel, 89 (2018), 3 (in Japanese).
- 11) Y. Imanami, T. Yamashita, K. Tomita and K. Hase: Tetsu-to-Hagané, 103 (2017), 36 (in Japanese).
- 12) M. Tsukahara, Y. Misaka and K. Kawasaki: J. Jpn. Soc. Heat Treat., 57 (2017), 281 (in Japanese).
- 13) T. Tamatani, M. Iguchi, T. Sato and K. Tsubota: J. Jpn. Soc. Heat Treat., 37 (1997), 356 (in Japanese).
- 14) T. Miyazaki, T. Fujimatsu, G. Miyamoto and T. Furuhara: Tetsu-to-Hagané, 106 (2020), 108 (in Japanese).
- 15) H. Yoshimura, Y. Mihara, K. Okauchi, M. Kasai, K. Maruta and H. Kimura: JFE Giho, 23 (2009), 30 (in Japanese).
- 16) T. Takamiya, M. Muraki and Y. Ozaki: Kawasaki Steel Giho, 29 (1997), 142 (in Japanese).
- 17) J. E. May and D. Turnbull: Trans. Metall. Soc. AIME, 212 (1958), 769.
- 18) N. P. Goss: Electrical Sheet and Method and Apparatus for its Manufacture and Test, U. S. Patent 1965559, (1934).
- 19) J. Harase, R. Shimizu and D. J. Dingley: Acta Metall. Mater., 39 (1991), 763.
- 20) Y. Hayakawa and J. A. Szpunar: Acta Mater., 45 (1997), 1285.
- 21) Y. Hayakawa, T. Omura and T. Imamura: Tetsu-to-Hagané, 101 (2015), 536 (in Japanese).
- 22) Y. Ushigami, S. Nakamura and S. Takebayashi: J. Jpn. Soc. Heat Treat., 50 (2010), 179 (in Japanese).
- 23) JIS G0551: 2013, Steels-Micrographic determination of the apparent grain size (in Japanese).
- 24) G. Miyamoto, N. Iwata, N. Takayama and T. Furuhara: Acta Mater., 58 (2010), 6393.
- 25) JIS G4053: 2008, Low-alloyed steels for machine structural use (in Japanese).
- 26) T. Ando, T. Morita and K. Inoue: Electr. Furn. Steel, 84 (2013), 13 (in Japanese).
- 27) Y. Tozawa: J. Jpn. Soc. Technol. Plast., 22 (1981), 139 (in Japanese).
- 28) K. J. Irvine, F. B. Pickering and T. Gladman: J. Iron Steel Inst., 205 (1967), 161.
- 29) S. Watanabe, Y. Tsu, K. Takano and Y. Shiraishi: J. Jpn. Inst. Met., 45 (1981), 242 (in Japanese).
- 30) Handbook of Iron and Steel, 5th ed., Vol. III, ed. by ISIJ, Maruzen, Tokyo, (2014), 603 (in Japanese).
- 31) T. Shimose and K. Narita: Tetsu-to-Hagané, 40 (1954), 242 (in Japanese).
- 32) K. Hata: Ph.D. thesis, Osaka University, (2018), https://ir.library.osaka-u.ac.jp/repo/ouka/all/69574/29765_Dissertation.pdf, (accessed 2020-03-09).
- 33) S. Dash and N. Brown: Acta Metall., 11 (1963), 1067.
- 34) Y. Wang, J. Kaneda, S. Kasahara and N. Shigenaka: Zairyo-to-Kankyo, 61 (2012), 359 (in Japanese).
- 35) M. Hillert: Acta Metall., 13 (1965), 227.
- 36) H. Abe: Saikessho (Recrystallization), Kyoritsu Shuppan, Tokyo, (1969), 147 (in Japanese).
- 37) Y. Ogino, H. Tanida, M. Kitaura and A. Adachi: Tetsu-to-Hagané, 57 (1971), 533 (in Japanese).
- 38) Y. Ushigami: Shinnittetsu Giho, 392 (2012), 26 (in Japanese).
- 39) Y. Imanami, T. Iwamoto and K. Nishimura: CAMP-ISIJ, 32 (2019), 301, CD-ROM (in Japanese).
- 40) Y. Ishida and T. Hasegawa: Seisan Kenkyu, 21 (1969), No. 4, 10 (in Japanese).

