Special Issue on "Advances in TRIP Effect Research"
Spot-Welded Tensile Properties in Automobile Ultrahigh-Strength TRIP-Aided Martensitic Steel Sheet
2021 Volume 61 Issue 2 Pages 599-607
Details
2021 Volume 61 Issue 2 Pages 599-607
Effect of heat-affected zone (HAZ) softening on tensile strength (TS) and total elongation (TEl) of spot-welded automobile ultrahigh strength TRIP-aided martensitic (TM) steel sheet was investigated for automobile applications. Tensile test was performed on an Instron type tensile testing machine at a crosshead speed of 3 mm/min (strain rate of 8.3×10⁻⁴ s−1), using spot-welded specimen.
The results are as follows.
(1) The spot-welded specimen at the current value (I) of 6.5 kA for the TM steel with the maximum tensile stress (TS*) of 1450 MPa and the fracture elongation (TEl*) of 7.0% was superior to that of hot stampted (HS1) steel sheet and it was found that the TS* and the TEl* for the TM steel possessed same level as those of base metal specimen for the HS1 steel with the tensile strength (TS) of 1469 MPa and the total elongation (TEl) of 7.7%.
(2) The TRIP effect for the TM steel with an excellent strength-ductility balance (TS×TEl) of 14.4 GPa% (i.e. the tensile strength (TS) of 1532 MPa and the total elongation (TEl) of 9.4%) suppressed the HAZ softening and was able to express a high maximum stress (TS*) of 1450 MPa of the spot-welded specimen for the TM steel.
In recent years, the ultrahigh-strength of steel sheets for automobiles has been undertaken attempting the weight reduction and the improvement of crash safety. However, the hot stamped (HS) steel sheets, with the tensile strength of more than 1470 MPa, have been applied to the B-pillar and the bumper beams.1) On the other hand, in consideration of the crash safety and press formability, it is expected that the low-alloy Transformation-Induced Plasticity (TRIP)2)-aided steel sheets associated with the strain-induced martensitic transformation of retained austenite, are applied to the automotive frame components.3,4) When the HS and low-alloy TRIP-aided steel sheets are applied as the impact safety parts for automobiles, in most cases the parts are assembled by the spot welding. Therefore, it is important to clarify the spot weldability of high-strength steel sheets. However, the investigation of spot weldability of 1470 MPa grade ultrahigh strength TRIP-aided steel sheets is not sufficiently conducted although the research on spot weldability of 1180 MPa grade TRIP-aided steel sheets has been reported.5,6,7) For example, it has been reported that the effect of heat-affected zone (HAZ) softening, caused by a decrease in the hardness distribution of the notch shape at HAZ, on the maximum stress (strength) and fracture elongation of the spot-welded joints of the high-strength steel sheets conducted an in-plane tensile test were verified, considering the factors at spot-welded and base material sides.8) The effect of HAZ softening on the mechanical properties of welded joints is not considered to be a problem in the tensile shear strength test (TSS) and the cross tensile strength test (CTS), which are the evaluation methods for spot-welded joints based on JIS standards.9) On the other hand, in the evaluation of lateral side impact of automobiles, since the steel sheet containing the spot welding part at the flange of the center pillar may be subjected to the similar deformation mode as the tensile stress of the in-plane in the steel sheet, the risk of occurrence of fracture at the HAZ-softened part of the spot-welded part is expected.8,10) In addition, the fracture behavior of spot-welded part has been elucidated using numerical analysis consideirng the fracture surface observation and the crack initiation and progression observation of the CTS.11)
Therefore, in this study, the tensile properties of spot-welded TRIP-aided martensitic (TM)3,4) steel sheets were investigated to improve the formability (ductility and toughness) of ultrahigh-strength steel sheets after the hot stamping, and to clarify the tensile properties of TM steel sheet with spot-welded joints.
Table 1 shows the chemical composition of the steel sheets used. Two kinds of cold-rolled steel sheets (t = 1.4 mm) with different silicon contents were used in this study. The steel sheets were produced by a rought hot rolling (thickness t = 60 → t = 30 mm), finishing hot rolling (t = 30 → t = 4 mm), followed by a cold rolling after pickling (t = 4 → t = 1.4 mm). The heat treatment of annealing at 900°C for 1200 s and isothermal transformation treatment at 250°C for 200 s in salt baths were conducted to produce the TM steel. For comparison, two types of hot stamped (HS) steel sheets were also prepared by a die-quenching for holding time of 15 s after heating at 900°C for 240 s and followed by a tempering at 700°C for 1 h with air cooling. Hereafter, the die-quenched and the die-quenched + tempered hot stamped steels were named as HS1 and HS7 steels, respectively.
| steel | C | Si | Mn | Ti | Cr | B |
|---|---|---|---|---|---|---|
| TM | 0.22 | 1.51 | 1.51 | 0.020 | 0.21 | 0.003 |
| HS1, HS7 | 0.22 | – | 1.21 | 0.038 | 0.25 | 0.004 |
Figure 1 shows a spot-welded specimen for tensile test.1) A tub material was spot-welded at the center of parallel part of the tensile specimen to prepare the spot-welded tensile specimen. Table 2 shows the condition of spot welding. Spot welding tests were performed on a stationary DC inverter spot welder (Daihen, SLAI 65-601(S-1)), using the electrode caps (DR16×60, 40R Cu–Cr alloy) at a electrode force of 3.0 kN, a welding time of 333 ms, and a welding current (I) of 6.5 kA or 9.5 kA.
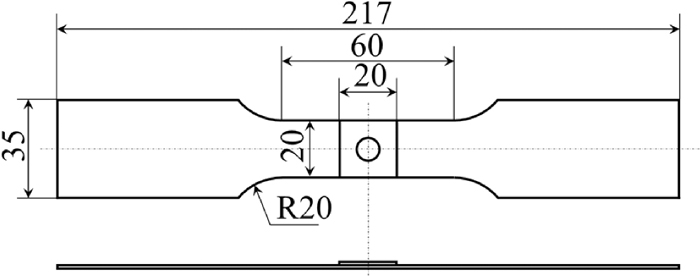
Geometry of spot-welded specimen.
| Electrode cap | Electrode force | Welding time | Welding current (I) |
|---|---|---|---|
| Cu–Cr DR16×60, 40R | 3.0 kN (0.25 MPa) | 333 ms (20 cycles/60 Hz) | 6.5 kA 9.5 kA |
The microstructure of the steels was obseved by scanning electron microscope (SEM)- electron backscatter diffraction (EBSD) measurement. The volume fraction of retained austenite (fγ (vol%)) was quantified by a X-ray diffractometry using Cu-Kα radiation on the basis of integrated intensity of diffraction peaks of (200)α, (211)α, (200)γ, (220)γ, and (311)γ.12) The carbon concentration in retained austenite (Cγ (mass%)) was estimated by the following equation13) using a lattice parameter (aγ) (× 10−10 m) measured from (200)γ, (220)γ, and (311)γ diffraction peaks of Cu-Kα radiation.
| (1) |
Tensile tests were performed on an Instron type of tensile testing machine using the base metal specimen with width of 20 mm, length of parallel part of 60 mm, gauge length of 50 mm and a spot-welded specimen for tensile test (i.e., welded specimen with tub sheet of 20 × 20 × 1.4 mm)1) at a crosshead speed of 3 mm/min (i.e., strain rate of 8.3×10⁻⁴/s), as shown in Fig. 1.
The Vickers hardness tests were performed on a dynamic ultra micro-Vickers hardness tester at a load of 98.1 mN, and a holding time of 5 s and the hardness distribution at an interval of x = 0.1 mm on the surface of the steel sheet in the parallel direction at t/4 = 0.35 mm from the overlapped surface of the steel sheet was measured.
Acoustic emission (AE) measurements were performed using an AE sensor with an operating frequency range of 100 to 1000 kHz, a wideband differential piezo-electric transducer (WD, diameter of 18 mm, threshold amplitude of 30 dB).14) For the root mean square (RMS) voltage of AE waves, the time constant was set to 0.8 s.
Figure 2 shows the SEM images of the steel sheets used. The microstructure of Fig. 2(a) shows the TM steel, Fig. 2(b) shows the HS1 steel, and Fig. 2(c) shows HS7 steel, respectively. With etching by 3% nital solution, it was revealed that the TM steel consisted of martensite and retained austenite (fγ = 1.52 vol%, Cγ = 0.79 mass%), HS1 steel was composed of martensite, and HS7 steel was composed of tempered martensite, respectively.
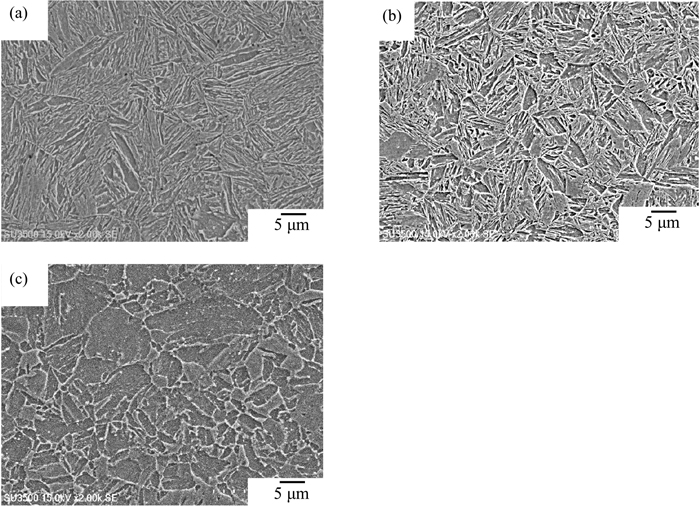
Scanning electron micrographs of (a) TM, (b) HS1 and (c) HS7 steels.
Table 3 shows the mechanical properties and carbon equivalent (Ceq) of base metal specimens of steel sheets used.15) The carbon equivalent was calculated from the following equation and was in a range of 0.47 to 0.58 mass%, where [C], [Si], [Mn] and [Cr] denote the content (mass%).
| (2) |
| steel | YS (MPa) | TS (MPa) | UEl (%) | TEl (%) | TS×TEl (GPa%) | Ceq (mass%) |
|---|---|---|---|---|---|---|
| TM | 1180 | 1532 | 5.6 | 9.4 | 14.4 | 0.58 |
| HS1 | 1095 | 1469 | 6.5 | 7.7 | 11.3 | 0.47 |
| HS7 | 521 | 559 | 13.7 | 22.4 | 12.5 | 0.47 |
YS: yield stress or 0.2% offset proof stress, TS: tensile strength, UEl: uniform elongation, TEl: total elongation, TS×TEl: strength-ductility balance and Ceq: carbon equivalent.
Figure 3 shows the nominal stress (σ)-nominal strain (ε) curves of the base metal specimens for the TM, HS1, and HS7 steels. Figures 4, 5 and 6 show the σ-ε curves of the base metal and welded specimens for the TM, the HS1, and the HS7 steels, respectively. Table 4 shows the mechanical properties of the welded specimens. In addition, Fig. 7 shows the appearance of the welded specimen for the TM steel after fracture (I=6.5 kA). Here, the tensile strength difference (ΔTS) and the total elongation difference (ΔTEl) were defined as ΔTS = TS*−TS and ΔTEl = TEl*−TEl, respectively, using the tensile strength (TS) and the total elongation (TEl) of the base metal specimen and the maximum stress (TS*) and the fracture elongation (TEl*) of the welded specimens (Tables 3, 4). The TS of the base metal specimens possessed 1470 MPa grade in the TM and HS1 steels and 590 MPa grade in the HS7 steel, respectively. On the other hand, the large TEl was obtained in the HS7 steel in comparison with that of the TM and HS1 steels. The TEl of the TM steel exhibited larger than that of the HS1 steel, although the TS of the TM steels was comparable to that of the HS1 steel. In the TM and HS1 steels, the TS and TEl of the welded specimens (I=6.5 kA and 9.5 kA) were lower than those of the base metal specimens, respectively. (Tables 3, 4, Figs. 4, 5). The welded specimens for the TM and HS1 steels fractured at the outer circumference of the electrode indentation (Fig. 7). On the other hand, the welded specimens for the HS7 steel fractured at the base metal at parallel portion. In the HS7 steel, the TS* of welded specimen did not change compared to the TS of base metal specimen, whereas the TEl* of welded specimen slightly decreased compared to the TEl of base metal specimen (Table 4). From these results, it was confirmed that the TS* of 1450 MPa and the TEl* of 7.0% of the welded specimen at the welding current (I) of 6.5 kA for the TM steel were superior to the TEl* for the HS1 steel, and it was found that the TS* and the TEl* for the TM steel possessed those of the base metal specimen for the HS1 steel with the TS of 1469 MPa (Tables 3, 4). In addition, it was noted that the strength-ductility balance (TS*×TEl*) of the welded specimen for the TM steel was superior to that of the HS1 steel.

Stress (σ)-strain (ε) curves of base metal specimens for TM, HS1 and HS7 steels.

Stress (σ)-strain (ε) curves of base metal and spot-welded specimens for TM steel.

Stress (σ)-strain (ε) curves of base metal and spot-welded specimens for HS1 steel.

Stress (σ)-strain (ε) curves of base metal and spot-welded specimens for HS7 steel.
| spot-welded specimen | I (kA) | TS* (MPa) | TEl* (%) | TS*×TEl* (GPa%) | ΔTS (MPa) | ΔTEl (%) |
|---|---|---|---|---|---|---|
| TM | 6.5 | 1450 | 7.0 | 10.2 | −82 | −2.4 |
| 9.5 | 1430 | 7.0 | 10.0 | −102 | −2.4 | |
| HS1 | 6.5 | 1388 | 6.2 | 8.6 | −81 | −1.5 |
| 9.5 | 1326 | 5.1 | 6.8 | −143 | −2.6 | |
| HS7 | 6.5 | 557 | 21.7 | 12.1 | −2 | −0.7 |
| 9.5 | 549 | 21.6 | 11.9 | −10 | −0.8 |
I: welding current, TS*: tensile strength of spot-welded specimen, TEl*: total elongation of spot-welded specimen, TS*×TEl*: strength-ductility balance of spot-welded specimen, ΔTS: tensile strength difference (ΔTS=TS*−TS) and ΔTEl: total elongation difference (ΔTEl= TEl*−TEl).

Spot-welded specimen for TM steel (I=6.5 kA). (Online version in color.)
Figure 8 shows the cross sectional image of the spot-welded TM steel (I=9.5 kA). Figures 9, 10 and 11 show the Vickers hardness (HV) distribution of welded cross section for the TM ((a) I= 6.5 kA, (b) I= 9.5 kA), the HS1 ((a) I= 6.5 kA, (b) I= 9.5 kA) and the HS7 steels ((a) I= 6.5 kA, (b) I= 9.5 kA), respectively. The welded cross section consisted of the base metal zone, the heat-affected zone (HAZ), and the fusion zone. The welded specimen for the TM steel (I=6.5 kA) was appropriate because the nugget diameter (d) of 5.60 mm was between 4
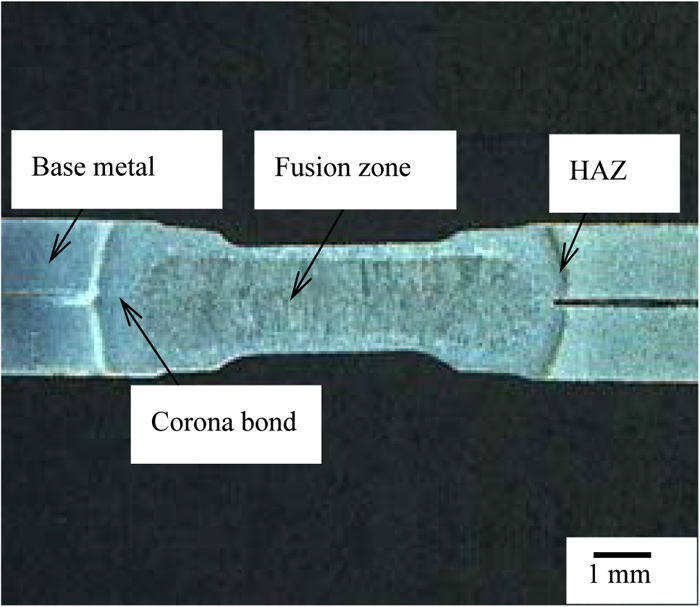
Cross-sectional image of spot-welded specimen for TM steel (I=9.5 kA). (Online version in color.)
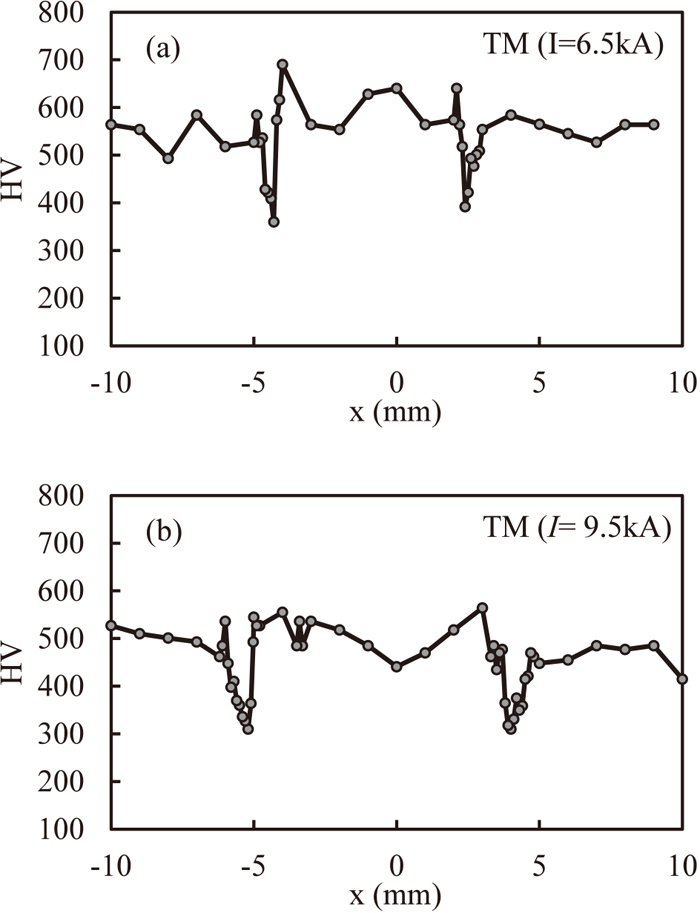
Vickers hardness (HV) distribution for TM steel ((a) I= 6.5 kA, (b) I= 9.5 kA).

Vickers hardness (HV) distribution for HS1 steel ((a) I= 6.5 kA, (b) I= 9.5 kA).

Vickers hardness (HV) distribution for HS7 steel ((a) I= 6.5 kA, (b) I= 9.5 kA).
Figures 12(a), 12(d), Figs. 12(b), 12(e) and Figs. 12(c), 12(f) show the results of EBSD analysis (inverse pole figure (IPF) map and phase distribution map) for the TM steel (I=6.5 kA) of the base metal zone, the HAZ and the fusion zone, respectively. The base metal zone consisted of a martensitic matrix (blue) and fine retained austenite (red) (Fig. 12(d)). On the other hand, the spot-welded zone exhibited very fine microstructure due to the melting of the base metal during spot welding and the solidification of the weld metal by rapid cooling (Fig. 12(f)). The microstructure of HAZ appeared to be coarsened (Fig. 12(e)). However, no significant difference in the amount of retained austenite (γR) was found in the base metal, spot weld, and HAZ.
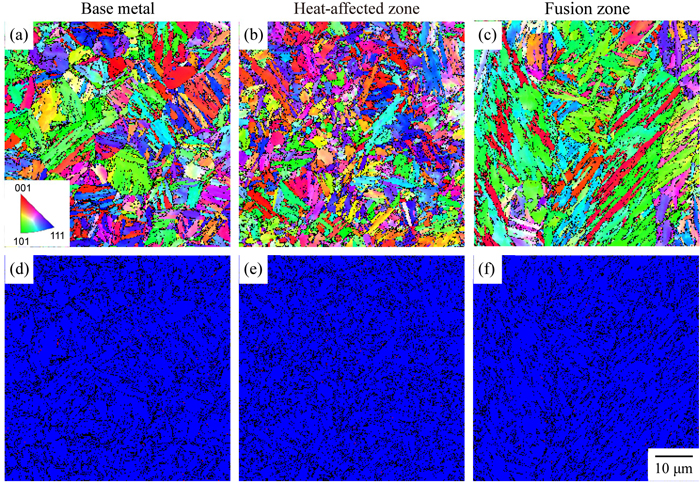
(a, b and c) inverse pole figure maps and (d, e and f) phase maps of bcc and fcc in (a and d) base metal, (b and e) heat-affected zone and (c and f) fusion zone for TM steel. Red and blue portions in phase maps represent retained austenite and martensite, respectively. (Online version in color.)
Figure 13 shows the variation of root mean square (RMS) voltage and stress (σ) with time (T) of the welded specimen (I=6.5 kA) for the TM steel during the tensile test. Figure 14 shows the variation of RMS voltage and σ with T of the base metal specimen for the TM steel during the tensile test. Figures 15 and 16 show the fracture surface of welded specimen (I=6.5 kA and I=9.5 kA) for the TM steel, and Fig. 17 shows the fracture surface of welded specimen (I=9.5 kA) for the HS1 steel, respectively.

Variation of stress (σ) and RMS voltage with time (T) in spot-welded specimen for TM steel, in which (a) is from 0 to 140 s and (b) is from 125 to 135 s. (I=6.5 kA). (Online version in color.)

Variation of stress (σ) and RMS voltage with time (T) in base metal specimen for TM steel. (Online version in color.)

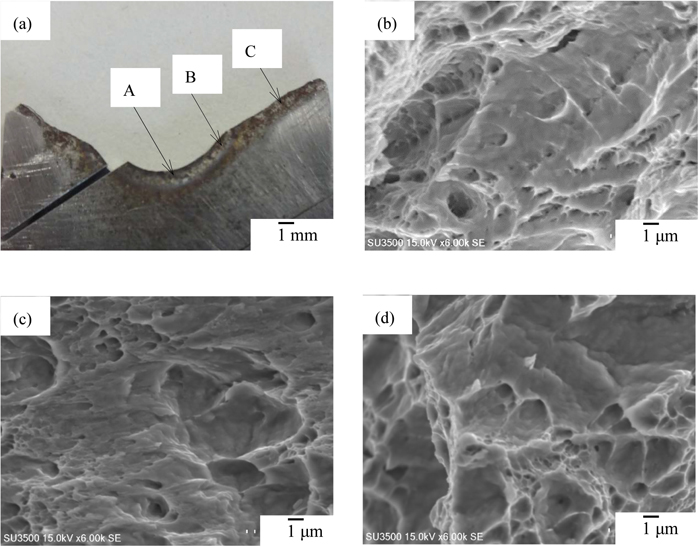
Scanning electron micrographs of fracture surface for TM steel (I = 6.5 kA) ((a) overview, (b) magnification of point A in (a), (c) magnification of point B in (a), (d) magnification of point C in (a)). (Online version in color.)
Scanning electron micrographs of fracture surface for TM steel (I= 9.5 kA) ((a) overview, (b) magnification of point A in (a), (c) magnification of point B in (a), (d) magnification of point C in (a)). (Online version in color.)
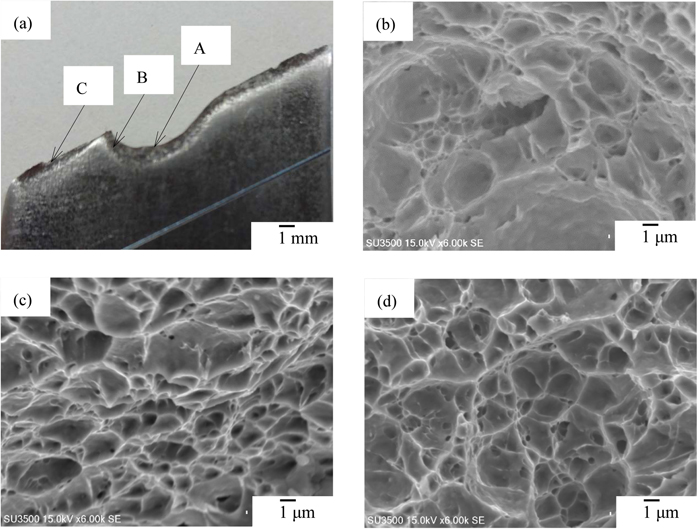
Scanning electron micrographs of fracture surface for HS1 steel (I= 9.5 kA) ((a) overview, (b) magnification of point A in (a), (c) magnification of point B in (a), (d) magnification of point C in (a)). (Online version in color.)
In Fig. 13, the AE signals of RMS voltage in the welded specimen were detected twice at the time of T = 127.2 and 129.6 s. It was considered that the two AE signals were detected during following processes. The crack occured at the HAZ of weld just before the maximum load of the TM steel at T = 127.2 s, and afterward the crack propagated toward about 45-degree against the tensile direction at T = 129.6 s, and finally, the stress decreased further from the maximum load to fracture. Here, the average crack growth rate of the spot-welded outer circumference could be estimated as 2.03 mm/s. It was considered that the AE incidence rate of the second time at T = 129.6 s was higher than that of the first time at T = 127.2 s, because the RMS voltage at T = 129.6 s was relatively higher than that at T = 127.2 s. In other words, the AE signal could support the fracture behavior of the crack initiation and propagation in the spot-welded TM steel. The first AE signal was attributed to the crack initiation at the HAZ, and the second large AE signal might be associated with the final fracture of the TM steel. It was considered that the crack propagation due to the fracture was detected. On the other hand, the AE signal of RMS voltage of the base metal specimen was once at the fracture (Fig. 14). The AE signal detected in the base metal specimen was considered to be due to the initiation and propagation of cracks at the final fracture. The base metal specimen of the HS1 and HS7 steels exhibited similar signals as the base metal specimen of the TM steel. From the above results, it is considered that the fracture elongation of the welded specimen was smaller than that of the base metal specimen due to the existence of the crack initiation process at the HAZ.
From the results of hardness distributions at the spot welds of each steel in Figs. 9, 10, 11, the base metal zone of the TM steel exhibited a hardness of 500 HV to 600 HV, and the base metal zone of HS1 steel possessed a hardness of 400 HV to 500 HV. The hardness of fusion zone was almost the same as the hardness of the base metal zone which were almost the same as the hardness of the material. Although the hardness of the HAZ for the TM and HS1 steels was lower than that of the base metal zone, the degree of decrease in hardness of the HAZ for the TM steel was not so large compared with that for the HS1 steel. On the other hand, in the HS7 steel, the hardness of base metal zone was about 200 HV, whereas the hardness of fusion zone and HAZ for spot welding increased to about 500 HV, which was considerably higher than that of the base metal zone. For the TM and HS1 steels, it was considered that the fracture elongation of welded specimen for the TM and HS1 steels decreased in comparison with that of the base metal specimen because the crack initiated at the HAZ which affected as the notch due to the decrease in the hardness compared with that of the base metal and fusion zones. On the other hand, since the hardness at the base metal zone and the fusion zone for the HS7 steel were 200 HV and 500 HV, the HAZ might be not act as a notch. Resultantly, the considerable deterioration of TEl* was suppressed because the welded specimen fractured not at the the fusion zone or HAZ, but at the base metal zone. In addition, the TM steel exhibited an excellent TS×TEl of 14.4 GPa% (TS = 1532 MPa, TEl = 9.4%). In the TM steel, it was considered that the excellent maximum tensile stress of spot-welded specimen of TS*=1450 MPa was achieved by the the TRIP effect of retained austenite (γR) during the tensile test, affecting the strengthening at the HAZ softened zone which delayed the initiation of crack at HAZ although the HAZ softening in the spot welding was not suppressed (Tables 3, 4).
Also, from Fig. 8, it was considered that the TS* and the TEl* of the spot-welded TM steel at I=9.5 kA decreased because the mechanical properites of the TM steel was affected by the effect of HAZ softening due to the increase in the welded portion because of the nugget diameter (d=5.60 mm, corona bond zone: c=0.56 mm) of the welded specimen of I=6.5 kA for the TM steel and the nugget diameter (d=6.57 mm, c=0.65 mm) of the welded specimen (I=9.5 kA) for the TM steel whcih exceeded 5
For the TM steel spot-welded at I=6.5 kA, when sheet width (w) of 20 mm, crack length (2a) of 1.62 mm, distance from crack tip (r) of 9.19 mm, minimum stress for crack propagation (σc) of 1450 MPa and the yield stress (σy) of 1180 MPa were assumed, the stress intensity factor for Mode I (KIc) of 2313 Nmm−3/2, the stress near the crack (σi) of 304 MPa, and the plastic zone at the crack tip (rp) of 0.73 mm were estimated.16) For the HS1 steel spot-welded at I=6.5 kA, if the σc and the σy were assumed as 1388 MPa and 1095 MPa, the stress intensity factor for Mode I, the stress near the crack and the plastic zone at the crack tip were calculated to KIc=2214 Nmm−3/2, σi=291 MPa and rp=0.65 mm, respectively. From these estimations, although the σi of the TM steel was relatively higher than that of the HS1 steel, the rp of the HS1 steel was small in comparison with that of the TM steel (Table 3).
Figures 15, 16, 17 show the fracture surface of spot welds. Here, Fig. 15 shows the TM steel (I=6.5 kA), Fig. 16 shows the TM steel (I=9.5 kA), and Fig. 17 shows the HS1 steel (I=9.5 kA), in which (a) is overview, (b) is a crack initiation area for magnification of point A in (a), (c) is a crack propagation for magnification of point B in (a), and (d) is a fracture zone for magnification of point C in (a), respectively. The TM steel exhibited a quasi-cleavage fracture due to tear (Figs. 15(b) and 16(b)), while the HS1 steel denoted a dimple fracture (Fig. 17(b)). The TM steel exhibited a similar fractography in the crack propagation region (Figs. 15(c) and 16(c)). The HS1 steel denoted a dimple fracture (Fig. 17(c)). Since the fracture surfaces denoted the ductile fracture consisted of most of dimples, it is considered that the softening was able to linked to the strength and the crack propagation (Figs. 15(d), 16(d), 17(d)).
The spot-welded tensile properties of ultrahigh-strength TRIP-aided martensitic (TM) steel sheet were investigated.
The main results are as follows.
(1) The spot-welded specimen at the welding current (I) of 6.5 kA for the TM steel with the maximum tensile stress (TS*) of 1450 MPa and the fracture elongation (TEl*) of 7.0% was superior to that of the hot stampted (HS1) steel sheet and it was found that the TS* and the TEl* for the TM steel possessed same level as those of the base metal specimen for the HS1 steel with the tensile strength (TS) of 1469 MPa and the total elongation (TEl) of 7.7%.
(2) The TRIP effect for the TM steel with an excellent strength-ductility balance (TS×TEl) of 14.4 GPa% (i.e. the tensile strength (TS) of 1532 MPa and the total elongation (TEl) of 9.4%) suppressed the HAZ softening and was able to express a high maximum stress (TS*) of 1450 MPa of the spot-welded specimen for the TM steel.
(3) The fracture behavior of crack initiation and propagation of the spot-welded specimens for the TM steel could be confirmed by AE signals.
Finally, the authors wish to thank the Amada Foundation and the Suzuki Foundation for finantioal supports. We would also like to thank Junya Naito of the automobile solution center of Kobe Steel Ltd., Yu Kitahara, Tatsuya Hoshina, Haruyuki Ono, Yuji Miyazawa, Kotaro Shiozaki, Tsukasa Sekizaki, Seigo Furuya, Kosuke Mitsui, Atsushi Mio, Masayuki Kato, and Takayuki Sato of National Institute of Technology (KOSEN), Nagano College in this research.