Abstract
Effect of carbon content on V-bending in high-strength TRIP-aided dual-phase (TDP) steel sheets with polygonal ferrite matrix was investigated for automobile applications. V-bending test was performed on a hydraulic testing machine at a processing speed of 1 mm/min, using a rectangular specimen (50 mm in length, 5 mm in width, 1.2 mm in thickness). The main results are as follows.
(1) The (0.1–0.4)C-1.5Si-1.5Mn, mass% TDP steel sheets were able to perform V-bending by strain-induced martensitic transformation of TRIP effect. On the other hand, ferrite-martensite dual-phase (MDP0) steel sheet of 900 MPa grade was not able to perform 90-degree V-bending because of initiation of crack in tension region.
(2) The 0.4C-1.5Si-1.5Mn, mass% TDP4 steel sheet of 1100 MPa grade was able to enable the 90-degree V-bending that considered an amount of springback (Δθ= θ2−θ1), in which the θ1 and the θ2 are a bending angle on loading and a bending angle after unloading respectively, of more than 2-degree by controlling a displacement of punch bottom dead center.
1. Introduction
In recent years, 1470 MPa grade hot stamping members have been widely used for pillars and bumper beams for the purpose of the weight reduction and the improvement of crash safety.1) In addition, although there have been some research on the springback-free and the servo press of V-bending,2,3,4) the studies on the V-bending of the TRansformation-Induced Plasticity (TRIP5)) steel sheets have not been sufficiently conducted,3) whereas TRIP steel sheets can be expected to be applied6,7) for automotive structural parts, considering the crash safety and the press formability.
The high-strength TRIP-aided dual-phase (TDP) steel with polygonal ferrite matrix having a strength-ductility balance (TS×TEl) of 25 GPa%, which is an index of the press formability, was adopted in order to investigate in detail the deformation mechanism of four types of the press formability (deep drawability, stretch-formability, stretch-flangeability, and bendability) of the TRIP steels.6) In the TDP steels mainly adding carbon, silicon and manganese, it is possible to relatively easy to control the microstructure such as the strength, the hardness, and the retained austenite (γR) characteristics due to the heat treatment.
On the other hand, in the view point of the press formability of the TRIP-aided steel with bainitic ferrite matrix (TBF steel), it has been reported that the stretch-flangeability of the TBF steels was superior to that of the TDP steels.7) However, since the TS×TEl and the volume fraction of γR of the TBF steels are relatively low, the transformation of γR of by scanning electron microscope-electron backscatter diffraction (SEM-EBSD) analysis is not detectable. Thus, it is difficult to clarify the mechanism of the superior stretch-flangeability of the TBF steels. Therefore, the use of the TDP steels, which has a relatively high volume fraction of γR and is easier to detect the γR by EBSD analysis than the TBF steel, expect to contribute the clarification of the mechanism of the superior stretch-flangeability.
The authors have conducted a lot of research of the deep drawability,6,8,9,10) stretch-formability,10,11) stretch-flangeability,10,12,13,14,15,16) and bendability14,16) in the low alloy TRIP steels to clarify the effects of the matrix, the second phase (γR) morphology, and the γR characteristics on the press formability. Moreover, it has been reported that the TRIP-aided annealed martensitic steels (TAM steels) with annealed martensitic lath matrix and needle-shaped retained austenite, and the TRIP-aided bainitic ferrite steels (TBF steels) with bainitic ferrite lath matrix and film-like γR exhibited the excellent stretch-flangeability in comparison with the TDP steels with polygonal ferrite matrix and granular γR as the second phase,8,11) and low-alloy TRIP steel possessed the excellent press formability due to a large amount of volume fraction of γR and high carbon concentration in γR.6,8,14) However, for the low alloy TRIP steel sheets, there are few research reports on the press forming mode such as 90-degree V-bending which also requires a shape fixability.
Therefore, in this study, the effect of carbon content on the 90-degree V-bending of (0.1–0.4)C-1.5Si-1.5Mn, mass% TDP steel sheets with polygonal ferrite matrix, which utilize the TRIP effect of γR, was investigated to clarify the effect of chemical composition on V-bending.
2. Experimental Procedure
Table 1 shows the chemical composition of steel sheets used. Figures 1 and 2 show the heat treatment diagrams of TDP steel and MDP steel, respectively.6) The TDP steels were produced by the heat treatments of intercritical annealing at 780°C for 1200 s followed by austempering at 400°C for 1000 s (Fig. 1). These TDP steels after the heat treatment are named TDP1 to TDP4 steels. For comparison, two types of ferrite-martensite dual phase (MDP) steels containing no γR with chemical composition of 0.15C-0.25Si-1.70Mn, mass%, were also prepared by intercritical annealing at 760°C for 1200 s (MDP0) and intercritical annealing at 760°C for 1200 s followed by tempered at 400°C for 3600 s (MDP4) (Fig. 2).
Table 1. Chemical composition of steel sheets used (mass%).
| Steel | C | Si | Mn | P | S | Al |
|---|
| TDP1 | 0.10 | 1.49 | 1.50 | 0.015 | 0.0012 | 0.038 |
| TDP2 | 0.20 | 1.51 | 1.51 | 0.015 | 0.0011 | 0.040 |
| TDP3 | 0.29 | 1.49 | 1.50 | 0.014 | 0.0012 | 0.043 |
| TDP4 | 0.40 | 1.49 | 1.50 | 0.015 | 0.0012 | 0.045 |
| MDP0 | 0.15 | 0.25 | 1.70 | 0.010 | 0.0080 | 0.030 |
| MDP4 | 0.15 | 0.25 | 1.70 | 0.010 | 0.0080 | 0.030 |
Tensile tests were performed on an Instron type of tensile testing machine at a crosshead speed of 1 mm/min (strain rate: 2.8×10⁻⁴/s), using JIS-13B-type tensile specimens.
V-bending tests were performed on a hydraulic testing machine using a 88-degree V-punch (2.0 mm in punch radius) and 88-degree V-die (12 mm in die gap (l), 0.8 mm in die shoulder radius) at a processing speed of 1 mm/min, using a rectangular specimen along the normal direction (50 mm in length, 5 mm in width, 1.2 mm in thickness) produced by wire electrical discharge machining.2,3) Figure 3 shows the experimental apparatus for V-bending test. In the TDP2 steel as a base steel, a displacement of punch bottom dead center (Smax) of 11.0 mm and holding time of 2 s were set by considering an amount of springback (Δθ = θ1−θ2) of 2-degree to achieve a bending angle during loading (θ1 = 92-degree) and a bending angle after unloading (θ2 = 90-degree).17)

The initial volume fraction of γR (fγ0) was quantified by (200)α, (211)α, (200)γ, (220)γ, and (311)γ diffraction peaks of Mo-Kα radiation measured by means of X-ray diffractometry (five peak method18)). The initial carbon concentration in γR (Cγ0, mass%) was estimated by following Eq. (1) using a lattice constant (aγ, nm) measured from (220)γ diffraction peak of Cr-Kα radiation.19)
|
C
γ0
=(
a
γ
-0.35467
)
/4.67×
10
-3
| (1) |
Hardness tests were conducted using a dynamic ultra micro-Vickers hardness tester (load: 98.1 mN, holding time: 5 s, load speed: 1.42 mN/s). Vickers hardness (HV) was measured to obtain the distribution of hardness in thickness direction from punching side to outer side of V-bending part with x = 0.1 mm intervals. The EBSD analyses in an area of 40 μm×40 μm with a beam step size of 0.2 μm and the residual stress measurements (cosα method, α phase, 30 kV, 1.5 mA, Young’s modulus E = 206 GPa, Poisson’s ratio ν = 0.3, X-ray incident angle of 35.0-degree, sample distance of 39.0 mm, μ-X360s, Pulstec Industrial Co., Ltd.) were conducted.
3. Results and Discussion
3.1. Microstructure and Mechanical Properties
Figure 4 shows the microstructure of (a) TDP2 and (b) MDP0 steels. Table 2 shows the γR characteristics and mechanical properties of steel sheets used. From Figs. 4(a) and 4(b), with etching by 3% nital solution, it is clear that the microstructural morphology of the TDP2 steel was defined as polygonal ferrite (αf) matrix and network-like distributed second phase consisted of bainite (αb) and γR, whereas the microstructure of the MDP0 steel consisted of polygonal ferrite matrix and martensite (αm) as the second phase.

Table 2. Retained austenite characteristics and mechanical properties.
| Steel | fγ0 | Cγ0 (mass%) | fγ0×Cγ0 (mass%) | YS (MPa) | TS (MPa) | UEl (%) | TEl (%) | YR | TS×TEl (GPa%) | n |
|---|
| TDP1 | 0.049 | 1.31 | 0.06 | 429 | 651 | 27.8 | 37.2 | 0.66 | 24.2 | 0.25 |
| TDP2 | 0.079 | 1.38 | 0.11 | 527 | 831 | 31.4 | 35.8 | 0.63 | 29.7 | 0.22 |
| TDP3 | 0.132 | 1.41 | 0.19 | 562 | 895 | 28.6 | 32.2 | 0.63 | 28.8 | 0.22 |
| TDP4 | 0.170 | 1.45 | 0.25 | 728 | 1103 | 29.2 | 32.8 | 0.66 | 36.2 | 0.21 |
| MDP0 | – | – | – | 434 | 923 | 9.3 | 11.3 | 0.47 | 10.4 | 0.14 |
| MDP4 | – | – | – | 528 | 735 | 10.3 | 13.1 | 0.72 | 9.6 | 0.11 |
fγ0: volume fraction of retained austenite, Cγ0: carbon concentration in retained austenite, fγ0×Cγ0: total carbon content in retained austenite, YS: yield stress or 0.2% offset proof stress, TS: tensile strength, UEl: uniform elongation, TEl: total elongation, YR: yield ratio (=YS/TS), TS×TEl: strength-ductility balance and n: work hardening exponent (ε=5–15%).
From Table 2, the initial volume fraction of γR (fγ0),6) carbon concentration (Cγ0)6) and total carbon content (fγ0×Cγ0)11) in γR increased with increasing the carbon content in the TDP1 - TDP4 steels which exhibited the chemical compositions of (0.1–0.4)C-1.5Si-1.5Mn. The TS of the TDP steels was in a range of 651 and 1103 MPa, which tends to increase with carbon content. The TEl of the TDP steels was in a range of 32.2 and 37.2%, which is larger than that of the MDP steels. The TS×TEl of the TDP steels was in a range of 24.2 and 36.2 GPa%, implying higher press formability than that of the MDP steel of more than 25 GPa%. In addition, the MDP0 steel possessed low yield ratio (YR) of less than 0.5.
3.2. Effect of Hardness Distribution in Bending Area on Bendability
Figures 5, 6 and 7 show the bending load (P)-punch stroke (S) curve of the TDP2 (Smax=11.0 mm, θ2=90-degree),17) TDP4, MDP0, and MDP4 (Smax=11.0 mm) and TDP4 (Smax=11.3 mm, θ2=90-degree) steels, respectively. Figure 8 shows the relation between carbon content (C) and bending angle after unloading (θ2) (TDP1, TDP2, TDP3, and TDP4 steels, Smax=11.0 mm), Fig. 9 shows the relation between carbon content (C) and bending load (P) (TDP1, TDP2, TDP3, and TDP4 steels, Smax=11.0 mm) and Fig. 10 shows the relation between initial volume fraction of γR (fγ0) and bending load (P) for (a) experimental and (b) theoretical load values. (TDP1, TDP2, TDP3, TDP4, and MDP4 steels, Smax=11.0 mm), respectively.


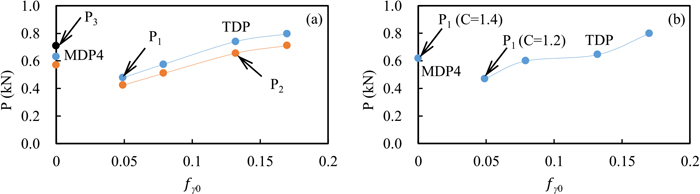
From Fig. 5, the region (O-A) corresponds to the a pure bending deformation portion where the force required for bending is the load (P1) at point A which is the transient force from elastic bending to plastic bending deformation.17) On the other hand, the region (A-B) where the load is temporarily reduced is the load when the sheet slides into the die, corresponding to the load (P2) at point B. The region (B-C) where the bending is completed is the load (P3) at point C. From Fig. 6, it was confirmed that the MDP4 and TDP4 steels were possible to bend the specimens, whereas the crack occurred on the outer surface at the bending punch tip with a radius of 2 mm in the MPD0 steel. This might be because the maximum strain (εmax) of approximately 23.1%20) in the circumferential direction at the bending punch tip with radius of 2 mm occurred, the crack initiated at the matrix/second phase interfaces of outer surface of convex side due to the stress concentration and resultantly, the bending was not able to completed for the MDP0 steel. However, in this V-bending condition, the bending angle after unloading (θ2) for the TDP3 and TDP4 steels possessed equal or less than 90-degree, namely, the amount of springback (Δθ) was equal or more than 2-degree (Fig. 8).
Therefore, the TDP4 steel, which exhibits the TS of 1100 MPa grade and a large amount of springback (Δθ) of equal or more than 2-degree, enabled to conduct 90-degree V-bending by controlling the displacement of punch bottom dead center (Smax) of 11.3 mm, resulting of the increase of load (P3) from 1.7 kN to 7.3 kN (Figs. 6 and 7).
The contacting manner between three points of the specimen, the punch and the die was changed during the V-bending deformation process as shown in Fig. 5. The approximate formula shown in Eq. (2) is generally used to theoretically determine the load of P1, P2, and P3 at these three points.17)
where
P,
t,
b,
σ,
l and
C represent load
P1, thickness, width, tensile strength of the sheet, width of the die gap and proportional constant (V-bending:
C = 1.0–1.3). In addition, since
C is a proportional constant applied to V-bending, which depends on the
TS, the mold shape, and the specimen shape, the constant value of
C=1.2 was adopted in spite of change in the carbon content of 0.1–0.4 mass% (
Table 2). The
P1 of the TDP steels was adopted the
C=1.2 whereas the
P1 of the MDP4 steel was the
C = 1.4, respectively. (
Figs. 9 and
10).
The difference of 0.2 of the proportional constant between the TDP and MDP4 steels was attributed to the occurrence of strain-induced martensitic transformation (SIMT)21) of γR (Fig. 10).
Figure 11 shows the V-bending specimen, and Fig. 12 shows the Vickers hardness (HV) distributions in the radial direction (x) of the punch tip of thickness in the V-bending (Smax=11.0 mm). Figure 12 suggests that the TDP4 steel enabled to conduct 90-degree V-bending due to the suppression of crack initiation at the outside of V-bending specimen which exhibited the tensile deformation because of the TRIP effect of γR since the inside and outside of deformation state of the bending portion of the TDP4 steel was plastically deformed and was able to suppress the initiation of cracks on the tensile side, like 900 MPa grade MDP0 steel, and enabled 90-degree V-bending considering the springback (Fig. 6). Furthermore, the hardness distributions of the TDP4 steel of 90-degree V-bending specimen with Smax=11.0 mm and Smax=11.3 mm exhibited similar trend (Fig. 12).

Figure 13 shows the relationship between the testing temperature (T) and k-value for the TDP2 steel. k is the strain-induced transformation coefficient, indicating that the value becomes small as the strain-induced martensitic transformation (SIMT) of γR is suppressed. The k-value was defined by the following Eq. (3), where, fγ0, fγ and ε are the volume fractions of γR before and after uniform deformation and deformed strain (i.e. uniform elongation, UEl), respectively.
|
log
f
γ
=log
f
γ0
-k⋅ε
| (3) |
Sugimoto et al.21) has reported that the k-value of 3.5 in the TDP4 steel at room temperature was relatively higher than that of k = 2.8 in the TDP2 steel. Thus, it was considered that the stability of γR against the strain decreased although the fγ0×Cγ0 of the TDP4 steel was high. Resultantly, the amount of springback (Δθ) increased in the TDP4 steel (Table 2, Fig. 8). Therefore, it was considered that the Vickers hardness (HV) of the outer surface of the tensile deformation region (y = 1.1 mm) of the bending specimen was increased because amount of strain-induced-transformed martensite was relatively high in the TDP4 steel (Fig. 12).
Figure 14 shows the relationship between the residual stress (σR) and the TS of the TDP1 - TDP4 steels with Smax = 11.0 mm. The σR in the longitudinal direction (x axis) was measured at the plastic-deformed region on the outer surface of V-bend specimen. It was noted that the compressive σR of the TDP steels increased with increasing the TS. In this context, this σR was appeared by the restraint of the specimen between punch and 88-degree die and bent back of the specimen. This might be caused by the increment of the amount of springback (Δθ) over 2-degree (Fig. 8).

Figures 15 and 16 show the EBSD- inverse pole figure (IPF) and the EBSD-phase maps of the TDP4 steel. Table 3 shows the volume fraction of each phase for the TDP4 steel. Figures 17 and 18 show the kernel average misorientation (KAM) value distribution and the frequency distribution of KAM values for the TDP4 steel, respectively. In the cross section of the V-bended specimen in Figs. 15 and 16, (a) represents the undeformed region (microstructure), (b) is the inner region of the V-bend part (compression side, y = 0.1 mm), (c) is the center region of the V-bend part (neutral surface, y = 0.6 mm) and (d) is the outer region of the V- bend part (tensile side, y = 1.1 mm) (Figs. 15 and 16). In Fig. 16, the blue and red parts indicate the ferrite matrix (bcc), and γR (fcc), respectively. The area fraction of γR drastically decreased to 3.74 area% as shown in Fig. 16(d) compared with Figs. 16(a) and 16(c) (Table 3). This was implied that the strain-induced transformation of γR into the martensite occurred during the bending deformation.

Table 3. EBSD analysis (area%).
| Steel | place | bcc | fcc | zero solution | bcc + zero solution |
|---|
| TDP4 | microstructure | 77.52 | 19.62 | 2.86 | 80.38 |
| inner | 77.52 | 19.01 | 3.48 | 81.00 |
| center | 79.49 | 17.26 | 3.25 | 82.74 |
| outer | 85.87 | 3.74 | 10.39 | 96.26 |


From Figs. 17 and 18, it can be seen that the tendency of KAM maps and the frequencies of KAM value of neutral region in V-bend specimen were similar to those of the undeformed region because the neutral region of V-bending is an elastic deformation region. It was considered that the HV at the inner region of V-bend specimen was higher than that at the undeformed region because of the suppression of volume expansion of around 3% during the martensitic transformation of γR6) and the multiplication of dislocation at the inner region of V-bend specimen since the maximum tensile strain at the convex side of V-bend part was applied whereas the compression deformation at the concave side of V-bend part was dominant (Table 3, Fig. 12). Therefore, it is concluded that the occurrence of strain-induced martensitic transformation of γR in 90-degree V-bending for the TDP steels was supported by the results of Vickers hardness and the EBSD analysis of phase maps and distribution of KAM value.
4. Conclusions
The effect of carbon content on the V-bending in the high strength TRIP-aided dual-phase (TDP) steel sheets with the polygonal ferrite matrix was investigated. The main results are as follows.
(1) The TDP steels with the chemical composition of (0.1–0.4)C-1.5Si-1.5Mn, mass% were able to perform the 90-degree V-bending, considering the springback, by the strain-induced martensitic transformation of retained austenite (γR) as the TRIP effect at the plastic deformation region of outside of the specimen whereas the ferrite-martensite dual-phase (MDP0) steel sheet with 900 MPa grade occurred the crack at the tension region.
(2) The 1100 MPa grade TDP4 steel sheet consisted of the chemical composition of 0.4C-1.5Si-1.5Mn, mass% with the large amount of springback (Δθ) of equal or more than 2-degree and the high initial volume fraction of retained austenite (γR) was able to form the 90-degree V-bending which was controlled by the displacement of punch bottom dead center.
(3) It was confirmed that the occurrence of strain-induced martensitic transformation of retained austenite (γR) by the 90-degree V-bending was supported due to the results of Vickers hardness (HV), the EBSD-phase map and the strain distribution obtained by KAM value in the TDP steels with the chemical composition of (0.1–0.4)C-1.5Si-1.5Mn, mass%.
Acknowledgments
Finally, the authors wish to thank the the 2019 Joint Research Project at the Institute for Materials Research, Tohoku University Foundation (Subject No. 19K0032), Institute for Materials Research, Tohoku University and National Institute of Technology (KOSEN), Nagano College Foundation for financial supports. We would also like to thank Yoshiaki Niwa of the Three-Dimensional Design Ability Association, Kazuhide Wada, Soma Kodama, Masami Komori, Hiroki Saito, Yuto Hirose, Takao Ichikawa, Yuya Okubo, and Takayuki Sato of National Institute of Technology (KOSEN), Nagano College.
References
- 1) H. Fujimoto, K. Hamada, T. Okada and H. Fujii: Q. J. Jpn. Weld. Soc., 34 (2016), 285 (in Japanese).
- 2) H. Ogawa and T. Hanaya: J. Jpn. Soc. Technol. Plast., 50 (2009), 399 (in Japanese).
- 3) J. Yanagimoto and K. Oyamada: ISIJ Int., 46 (2006), 1324.
- 4) M. Yang: Form Tech Rev., 27 (2017), 15 (in Japanese).
- 5) V. F. Zackay, E. R. Parker, D. Fahr and R. Busch: Am. Soc. Met. Trans. Q., 60 (1967), 252.
- 6) A. Nagasaka, K. Sugimoto, M. Kobayashi, Y. Kobayashi and S. Hashimoto: Tetsu-to-Hagané, 87 (2001), 607 (in Japanese).
- 7) A. Nagasaka, Y. Kubota, K. Sugimoto, A. Mio, T. Hojo, K. Makii, M. Kawajiri and M. Kitayama: ISIJ Int., 50 (2010), 1441.
- 8) A. Nagasaka, K. Sugimoto, M. Kobayashi, Y. Kobayashi and S. Hashimoto: Tetsu-to-Hagané, 85 (1999), 885 (in Japanese).
- 9) A. Nagasaka, K. Sugimoto, M. Kobayashi and S. Hashimoto: Tetsu-to-Hagané, 85 (1999), 552 (in Japanese).
- 10) K. Sugimoto, S. Song, J. Sakaguchi, A. Nagasaka and T. Kashima: Tetsu-to-Hagané, 91 (2005), 278 (in Japanese).
- 11) K. Sugimoto, M. Kobayashi, A. Nagasaka and S. Hashimoto: ISIJ Int., 35 (1995), 1407.
- 12) K. Sugimoto, J. Sakaguchi, T. Iida and T. Kashima: ISIJ Int., 40 (2000), 920.
- 13) K. Sugimoto, A. Nagasaka, M. Kobayashi and S. Hashimoto: ISIJ Int., 39 (1999), 56.
- 14) K. Sugimoto, B. Yu, Y. Mukai and S. Ikeda: ISIJ Int., 45 (2005), 1194.
- 15) A. Nagasaka, K. Sugimoto, M. Kobayashi and S. Hashimoto: Tetsu-to-Hagané, 83 (1997), 335 (in Japanese).
- 16) K. Sugimoto, R. Kikuchi, M. Tsunezawa, S. Hashimoto, T. Kashima and S. Ikeda: Tetsu-to-Hagané, 89 (2003), 1065 (in Japanese).
- 17) S. Osada and Z. Yanagimoto: Kiso Karawakaru Sosei Kakou (Kaiteiban) (Plastic Working from the Basics (revised version)), Corona Sya, Tokyo, (2010), 77 (in Japanese).
- 18) H. Maruyama: J. Jpn. Soc. Heat Treat., 17 (1977), 198 (in Japanese).
- 19) Z. Nishiyama: Marutensaito Hentai (Kihonhen) (Martensitic Transformation (Basic)), Maruzen, Tokyo, (1971), 13 (in Japanese).
- 20) T. Kawanami, H. Sekiguchi, M. Saito and T. Hiroi: Kiso Sosei Kakougaku (Dai 3 Pan) (Fundamental Plastic Working (3rd edition)), Morikita Shuppan, Tokyo, (2015), 44 (in Japanese).
- 21) K. Sugimoto, M. Kobayashi and S. Hashimoto: Metall. Trans. A, 23 (1992), 3085.


