Abstract
The catalytic gasification characteristics and kinetics of metallurgical coke by iron were investigated by non-isothermal thermogravimetry using volumetric (VM), unreacted core (URCM), and random pore (RPM) models. Density functional theory (DFT) calculations were used to analyse the interaction mechanism of CO2 on the iron catalyst surface. Carbon conversion curves were shifted to a lower-temperature zone upon iron addition, indicating the strong catalytic effect of iron on carbon gasification. Kinetic analysis showed that RPM described coke gasification better than VM and URCM, with an RPM activation energy of 197.1–218.1 kJ/mol. DFT calculations indicated that CO2 molecules parallel to the crystal surface can easily interact with the iron surface. Three stable adsorption configurations with energies of −0.59, −0.62, and −0.78 eV were obtained. In the Löwdin population analysis, the C atom acts as a major electron acceptor from Fe. The C and O orbitals overlap with Fe 3d, 4s, and 4p, indicating stronger hybridisation and demonstrating that Fe (001) can activate CO2.
1. Introduction
Coke serves as the skeleton and provides energy for blast furnaces (BF) and is an important raw material for ironmaking.1) As a porous carbonaceous material, the main component of coke is carbon with small amounts of inorganic minerals distributed throughout the carbon matrix. Even though the mineral content is typically ˂15 wt%, it can significantly influence the reactive behaviour of coke in BF, especially during gasification with CO2.2,3,4,5) Alkali and alkaline earth metals have a positive effect on the coke gasification process.5,6,7,8) Catalytic gasification can reduce the initial gasification temperature and enhance coke reactivity, but the coke strength after reaction (CSR) is often reduced. Since low-temperature BF with high-reactivity coke have been proposed by Japanese researchers,9,10) recent studies11,12) have revealed the positive catalytic effect of calcium-based and iron-based minerals on coke gasification, but have not fully defined the catalytic mechanism, especially at the atomic and electronic scales.
Iron and carbon in coke and coal are the most dominant elements in the ironmaking process, and frequent contact between iron and carbon is unavoidable because iron is produced by the reduction of iron oxide inside the BF.13,14) Iron and iron-bearing minerals, which originate from coke ash layers dispersed in the matrix, can catalyse the gasification and graphitisation of coke in BF.5,6,15) Even though iron may exist in different forms, including oxide, sulphide, and pyrrhotite in coke ash, these minerals can be easily reduced to metallic iron under the BF reducing atmosphere.1) Therefore, knowledge of the catalytic effect and mechanism of iron on coke gasification reactivity is a fundamental issue for understanding the behaviour of coke during ironmaking.
Previous studies have demonstrated the stepwise gasification reaction of coke.16,17) First, CO2 molecules adsorb on the active site on the coke matrix. Subsequently, the C–O bond in CO2 is broken, and the O atom binds to the C atom to generate C–O on the carbon surface. Afterwards, the C–O compounds dissociate from the interface to form CO gas. Catalysts can reduce the activation energy barrier, allowing more activated reactants can be produced at the reaction interface.18) In heterogeneous catalysis, the activation of relatively inert CO2 is an essential step. Therefore, it is necessary to determine how CO2 interacts with the Fe surface to understand catalytic coke gasification. Previous studies have shown that the (001) surface is frequently exposed in the Fe crystal structure and contains highly active catalytic sites.19,20,21,22)
To date, few researchers have studied the coke gasification mechanism at the atomic or electronic scale. Here, in experimental non-isothermal thermogravimetric analysis (TGA) was performed to study the effect of Fe on the gasification reactivity of coke. In addition, the gasification reaction was modelled using the volume reaction (VM), random pore (RPM), and unreacted core (URCM) models to determine the kinetic parameters. Furthermore, density functional theory (DFT) calculations were used to explore CO2 adsorption on the Fe(001) surface, which is an essential step during catalytic gasification.
2. Experiment and Computational Methods
2.1. Material Preparation
Experimental coke samples were supplied by a large industrial BF. The proximate and ultimate analyses of coke are shown in Table 1. The experimental samples were ground and sieved to a particle size of <74 μm.
Table 1. Proximate analysis and ultimate analysis of coke.
| Item | Value |
|---|
| Proximate analysis | |
| Moisture (wt%) | 0.20 |
| Volatile matter (wt%, moisture free) | 1.54 |
| Fixed carbon (wt%, moisture free) | 86.19 |
| Ash (wt%, moisture free) | 12.07 |
| Ultimate analysis (wt%, moisture free) | |
| Carbon | 85.68 |
| Hydrogen | 0.18 |
| Nitrogen | 0.96 |
| Oxygen | 0.27 |
| Sulfur | 0.84 |
The coke samples were demineralised to prevent possible interaction effects with inherent minerals and treated with HCl and HF by standard methods.23,24) Demineralization was achieved as follows: 200 mL of aqueous HCl (36.5 wt%) was added to 20 g of coke and the slurry was stirred for 24 h. Subsequently, the mixture was filtered and washed with distilled water until the filtrate was neutral to remove chloride ions which can affect the gasification process. Consecutively, 200 mL of aqueous HF (48 wt%) was added to the washed coke and the mixture was stirred for 24 h. After filtering, the demineralised coke was washed with distilled water and dried at 105°C in a vacuum oven for 24 h. After acid treatment, the ash content in the coke was <2 wt%.
The reagent grade Fe (purity >99.9%) with a particle size of <5 μm was placed on a Mettler Toledo AL204 laboratory balance for rapid weighing and mixed with the demineralised coke in an agate mortar with ethanol for 30 min. The nominal loadings of Fe on the demineralised coke were 0.5, 1, and 1.5 wt% on a dry basis.
2.2. Gasification Tests
The kinetics and reaction mechanisms between the samples and CO2 were investigated using a thermogravimetric analyser (HCT-3, Beijing Henven Scientific Instrument Factory) to monitor the weight change of a sample over time at atmospheric pressure. First, 5 mg of the initial sample was loaded into an Al2O3 crucible with height of 2 mm and diameter of 5 mm. Herein, the reaction temperature was increased at a fixed rate of 5, 10, or 15 K/min up to 1350°C under 100 mL/min CO2 (purity ≥99.99%) to prevent heat transfer limitations and minimise mass transfer effects.
The weight change during the reaction was recorded and the carbon conversion (x) was calculated as follows:
|
x=
m
i
-
m
t
m
i
-
m
f
| (1) |
where
mi represents the initial sample,
mt is the sample weight at time t, and
mf is the remaining sample mass after gasification.
The temperatures at coke conversions of 0.05 and 1.00 were defined as the initial gasification temperature (Ti) and final gasification temperature (Tf), while Tm represents the temperature required to reach the peak reaction rate. The comprehensive gasification characteristic index S was calculated as follows:
|
S=
R
max
⋅
R
mean
T
I
2
⋅
T
f
| (2) |
where
Rmax represents the maximum gasification rate and
Rmean represents the mean value of the gasification rate.
2.3. Kinetic Models
Coke gasification is an important gas-solid reaction in the metallurgical process. The conversion rate calculation is shown in Eq. (3):
where
f(
x) represents the mechanism function of conversion and
k(
T) is the apparent reaction rate constant, which is known to be correlated to temperature and can be described by the Arrhenius equation:
Where
E,
A, and
S0 represent the activation energy, pre-exponential factor, and gas constant, respectively.
The gasification of carbonaceous materials can be explained by the different mechanism functions. Herein, the conversion results were characterised by three nth-order kinetic models: VM, URCM, and RPM.
The VM assumed that gasification occurs over all active carbon sites and does not feature structural changes in the matrix during reaction.25,26) The mechanism function of conversion expression can be described by:
|
dx
dt
=
A
VM
exp(
-E/RT
)
(
1-x
)
| (5) |
The URCM assumes that the reactants and products diffuse through the ash halo and chemical reaction occurs at the unreacted interface between the unreacted core and ash halo.27,28) The mechanism function of the URCM is commonly defined as follows:
|
dx
dt
=
A
URCM
exp(-E/RT)
(
1-x
)
2/3
| (6) |
The RPM accounts for the porous structure evolution, such as pore surface area and pore surface enlargement during the reaction.29) It has been mainly used for chemical reaction rate-controlled reactions as is described in Eq. (7):
|
dx
dt
=
A
RPM
exp(
-E/RT
)
(
1-x
)
1-ψln(
1-x
)
| (7) |
The symbol ψ of the pore structure is given by the following function:
|
ψ=
4π
L
0
(
1-
ε
0
)
S
0
2
| (8) |
Where
L0,
ε0, and
S0 correspond to the initial pore length, initial solid porosity, and initial pore surface, respectively.
According to the recommendations of the ICTAC Kinetics Committee, reliable kinetic parameters, and apparent activation energies should be determined using at least three experiments with different heating rates.30,31) Herein, the experimental data obtained in the non-isothermal thermogravimetric runs at heating rates of 5, 10, and 15 K/min. The relationship among conversion x, conversion rate dx/dt, and temperature T are depicted by the mechanism function of Eqs. (5), (6), (7) under the chemical reaction control. The kinetic parameters of the experimental data, including A, E, and ψ, were calculated using the non-linear least squares fitting method.
The temperature T, which is a function of heating rate β and time t, can be expressed as follow:
The symbol β of the heating rate can be calculated as follows:
Substituting Eq. (10) into Eq. (4) yields
|
x=1-exp(
-
A
E
VM
βR
⋅p(u)
)
| (11) |
Where
|
p(u)=
e
-u
u
-
∫
x
∞
e
-u
u
du
| (13) |
Using the Kissinger-Akahira-Sunose method,32) the solution of Eq. (13) can be defined as follows:
This approximate solution is effective when carbon materials are gasified by CO2.33) Therefore, Eq. (11) can be approximated as follows:
|
x=1-exp(
-
A
VM
⋅
R
T
2
βE
⋅exp(
-E
RT
)
)
| (15) |
Similarly, Eqs. (6) and (7) can be transformed as follows:
|
x=1-exp(
-(
A⋅
R
T
2
βE
⋅exp(
-E
RT
)
)
⋅
(
1+
A
URCM
⋅ψ
4
⋅
R
T
2
βE
⋅exp(
-E
RT
)
)
| (16) |
|
x=1-
(
1-
A
RPM
R
T
2
3βE
⋅exp(
-E
RT
)
)
3
| (17) |
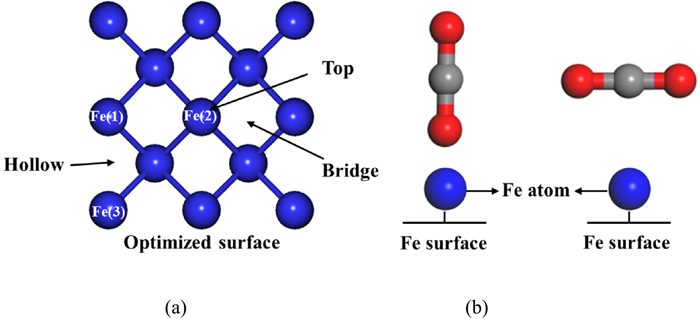
Calculations were performed using the Quantum ESPRESSO package with projector augmented wave pseudopotentials (PAW).34) The exchange correlation energy was modelled in the generalised gradient approximation (GGA) using the function of Perdew, Burke, and Ernzerhof (PBE). The kinetic energy cut-off was set at 40 Ry for the wavefunction and 460 Ry for the charge density.35) The Brillouin zone integration was sampled with 4×4×1 grid of Monkhorst Pack special k-points36) for surface calculations. The convergence tolerance energy and maximum force tolerance on each atom were 1.0×10⁻⁶ eV/atom and 1.0×10⁻⁴ eV/Å, respectively. To quantitatively estimate the charge transfer between CO2 and the surface, Löwdin analysis was performed. The interaction of CO2 with the Fe(001) surface was calculated by placing the CO2 molecule onto three adsorption sites: Fe top, hollow, and bridge (Fig. 1). Two adsorption configurations were also tested: CO2 molecules were vertically or horizontally adsorbed on the Fe(001) surface, as shown in Fig. 1. The adsorption energies of all possible configurations were calculated using the following equation:
|
E
ad
=
E
sys
-
E
surf
-
E
mol
| (18) |
where
Esys denotes the total energy of the adsorbed system while
Esurf and
Emol denote the energy of the clean surface and isolated CO
2 molecule, respectively.
3. Results and Discussion
3.1. Effect of Iron on Coke Gasification
The conversion curves in Fig. 2 show the evolution of carbon conversion with different iron contents at different heating rates. The iron content strongly influenced the gasification rate, while the carbon conversion curve shifted to the lower temperature region with increasing iron content. This indicates that lower amounts of energy are required to initiate gasification because of the obvious catalytic effect of iron on carbon gasification. The evolution of the characteristic temperatures (Ti, Tm, Tf) is plotted in Figs. 3(a)–3(c), showing a linear decrease in the characteristic temperatures. This indicates that a catalytic effect was operative over the entire gasification process. As expected with the lower reaction energy, the reaction rate increased upon iron addition, as shown in Fig. 3(d). All the gasification characteristic parameters (Ti, Tm, Tf, and Rmax) were closely related to the heating rates. With increasing heating rate, the effect of temperature hysteresis increased, leading to significantly higher characteristic temperatures (Ti, Tm, Tf, and Rmax). An increased comprehensive gasification characteristic index S was observed with the addition of an iron catalyst, as shown in Fig. 4.

According to the kinetic models described in Chapter 2.3, the most probable mechanism function for gasification was determined via non-linear fitting. The evolution of the conversion (x) curves and conversion rate (dx/dt) curves are shown in Figs. 5 and 6, respectively. The results obtained from the RPM matched closely with the experimental results, showing the highest R2 values of all models, while the UCRM showed low accuracy with the lowest R2 value of all models tested. The performance of the VM was better than that of the UCRM, but not as good as the RPM. The RPM can represent the coke gasification process because coke is a porous carbonaceous material with many nanoscale and macroscale pores.37) During gasification, coke pores with arbitrary pore size distributions grow and coalesce, which is the essential principle of the RPM. The RPM can adequately reflect changes in the pore size and determine the maximum reaction rate. In contrast, the VM and URCM cannot describe the maximum reaction rate but predict that the reaction rate will continue to decrease at a constant rate. Generally, the structure factor influence is close to 0, which leads to a decrease in the accuracy of the RPM compared to VM, eventually yielding similar results for both models.

The calculated kinetic parameters (E, A, and ψ) are listed in Table 2. The activation energies for coke calculated by the RPM were 218.1, 212.3, 204.2, and 197.1 kJ/mol, decreasing with metallic iron loading. The activation energy of coke with Fe was also lower than the published activation energy of metallurgical coke (Table 3), indicating that the addition of metallic iron decreases the activation energy, allowing the reactants to overcome a lower energy barrier.
Table 2. The calculated kinetic parameters of different samples.
| ω(Fe) | VM | RPM | URCM |
|---|
| E (kj/mol) | A (min−1) | R2 | E (kj/mol) | A (min−1) | ψ | R2 | E (kj/mol) | A (min−1) | R2 |
|---|
| 0 | 228.6 | 3.17E7 | 0.979 | 218.1 | 1.23E7 | 0.11 | 0.980 | 171.2 | 1.64E5 | 0.945 |
| 0.5 | 213.5 | 1.28E7 | 0.972 | 212.3 | 1.25E7 | −0.14 | 0.978 | 163.2 | 1.10E5 | 0.945 |
| 1 | 202.1 | 6.60E6 | 0.983 | 204.2 | 7.79E6 | 0.05 | 0.984 | 159.5 | 1.06E5 | 0.946 |
| 1.5 | 198.7 | 6.57E6 | 0.976 | 197.1 | 5.15E6 | 0.27 | 0.981 | 156.3 | 1.04E5 | 0.950 |
Table 3. Comparison of activation energies in the literature for chemically controlled reaction rates.
| Author | Observed activation energies (kJ/mol) |
|---|
| Current study | 197.1–218.1 |
| Grigore[42] | 222–266 |
| Harris and Smith[43] | 216–239 |
| Pang[44] | 215–240 |
| Shin[45] | 247–270 |
The optimised adsorption geometries of the configurations on the Fe(001) surface are presented in Fig. 7. The adsorption energies and distance of the CO2 molecule to the adsorption site are also indicated. In Fig. 7(A), although the CO2 molecule was initially placed vertically on the three adsorption sites, it eventually detached, and its structure was largely the same as pure CO2. The adsorption energy was close to 0 eV, indicating that the interaction of the vertical CO2 molecule with the Fe(001) surface was very weak.

For configurations in which CO2 molecules were placed parallel to the iron surface, interaction between CO2 (adsorbate) and iron atoms (substrate) was clearly observed (Figs. 7(B)–7(D). When CO2 is close to Fes, Cad-Fes and Oad-Fes bonds are formed, resulting in a significant change in the CO2 structure. In particular, the C–O bond of the CO2 molecule in configuration B was stretched from 1.17 to 1.25 Å, and the bond angle of CO2 shrank from 180 to 136.81°. In configuration C, the C–O bonds were stretched to 1.25 and 1.30 Å, and the bond angle of CO2 was reduced to 129.75°. In configuration D, the C–O bond was stretched to 1.30 Å, while the bond angle was reduced to 122.03° for a larger molecular structure change compared to those of the other two configurations. The CO2 molecule became highly activated due to its strong contraction and elongation. In addition, Fes was shifted upwards with respect to the same Fe atom on a clean surface. The adsorption energy (−0.78 eV) of configuration D was slightly higher than that (−0.62 eV) of configuration C. These geometric properties demonstrate a large net interaction between CO2 and the iron substrate, which is consistent with the CO2 adsorption on Fe3O4 (111)38) and CeO2(111)39) surfaces.
To determine the mechanism of CO2 activation, the electronic properties of the adsorbed states were determined via Löwdin population analysis between CO2 and the Fe(001) surface.38) The electron density analysis and electronic structure of the CO2 horizontal adsorption configurations on the Fe(001) surface are displayed in Fig. 8. For configuration B (Fig. 8(B)), the Löwdin populations for O(1), C(1), O(2), Fe(1), and Fe(2) were 2s1.652p4.62, 2s0.872p2.65, 2s1.652p4.62, and 3d6.604s2.344p0.89, while the charge analysis on O(1), C(1), O(2), Fe(1), and Fe(2) before adsorption was 2s1.672p4.60, 2s0.742p2.46, 2s1.672p4.60, 3d6.624s0.404p0.79, and 3d6.624s0.404p0.79, respectively. This demonstrates that the CO2 molecule became chemisorbed on the Fe surface, and the C 2s and 2p orbital population received 0.31 |e| electrons in total. Furthermore, CO2 was adsorbed between two iron atoms with a symmetrical electron distribution \, indicating that the two Fe–C bonds are largely equivalent. Similarly, for configuration C (Fig. 7(C)), bonding charge distributions (Fig. 8(C)) developed between the CO2 molecules and surface Fe, demonstrating electron sharing and new bond formation. The atomic charge distribution on O(1), C(1), O(2), Fe(2), and Fe(3) was determined to be 2s1.662p4.60, 2s0.902p2.69, 2s1.632p4.68, 3d6.674s0.334p0.88and, 3d6.574s0.364p0.81, respectively. The C atom acts as a major electron acceptor and approximately 0.43 |e| electrons were transferred from Fe(2) to C(1), consistent with the adsorption energy analysis. In Fig. 8(D), the total charges for O(1), C(1), and O(2) were determined to be 6.30, 3.59, 6.30, respectively, compared to 6.27 and 3.20 on O(1) and C(1) in the free CO molecule, respectively. Thus, the CO2 molecule received 0.45 |e| from the Fe atom, resulting in a high degree of activation of the two C–O bonds, which elongated as previously described.40)

To further understand the interaction of CO2 on the Fe(001) surface, the partial density of states (PDOS) on the C and O atoms and its iron bonding partner Fe were calculated (Fig. 9). After CO2 adsorption via the three configurations, the C and O orbitals are shifted to lower energies below the Fermi level and overlap with Fe 3d, 4s, and 4p, indicative of a stronger hybridisation. In addition, resonance peaks were observed between 0 and 12 eV, indicating that the anti-bond interactions weaken the adsorption. Combined with structural and electronic property analyses, CO2 was determined to be chemically adsorbed on the Fe surface.
3.5. Catalytic Mechanism of Iron on Coke Gasification
Previous studies have shown that the gasification reaction can be explained by the O-transfer mechanism,16,41) while iron can improve the gasification rate by increasing the number of active sites. However, this mechanism cannot explain the decreased activation energy and movement of the gasification to a lower temperature zone. Based on the DFT results, the catalytic mechanism can be explained by the change in CO2 molecular stability (Fig. 10). The linear molecular structure of the free carbon dioxide molecule deforms into a V shape after approaching the iron surface. After formation of the activated carbon dioxide, the oxygen in carbon dioxide is more easily captured and subsequently migrates into the carbon matrix to form a carbon (O) complex. This decreases the energy required for gasification, thereby decreasing the gasification temperature and increasing apparent carbon reactivity.
4. Conclusions
The gasification of demineralised coke with 0.0, 0.5, 1.0, and 1.5 wt% Fe under non-isothermal conditions was analysed to elucidate the effect of iron on gasification reactivity. The characteristic temperatures Ti, Tf, and Tm decreased gradually with increasing iron content, indicating an obvious catalytic effect of iron on carbon gasification. The kinetic results demonstrate that the RPM fits well with the experimental data. The activation energies for coke with 0.0, 0.5, 1.0, and 1.5 wt% Fe calculated by the RPM were 218.1, 212.3, 204.2, and 197.1 kJ/mol, respectively.
Using systematic DFT calculations, the mechanism of CO2 activation was revealed. CO2 molecules parallel to the surface can easily interact with the iron surface, mainly due to a net adsorbate-substrate interaction: The C–Fe chemical bond showed adsorption energies of −0.59, −0.62, and −0.78 eV, respectively. Löwdin’s population analysis indicated that the C atom acts as a major electron acceptor from Fe and the C and O orbitals overlap with Fe 3d, 4s, and 4p orbitals, indicating strong hybridisation. These results demonstrate that Fe(001) is capable of activating CO2 and acting as an excellent catalyst for coke gasification.
Acknowledgements
The authors acknowledge the financial support of the National Key Research and Development Program of China (2017YFB0304300&2017YFB0304303), the National Science Foundation of China (51774032, 51974019), the Chinese Fundamental Research Funds for the Central Universities (FRF-TP-17-086A1) the National Science Foundation for Young Scientists of China (51804025).Computations were performed on the Niagara supercomputer at the SciNet HPC Consortium in the Compute/Calcul Canada national computing platform. SciNet is funded by the Canada Foundation for Innovation under the auspices of Compute Canada, the Government of Ontario, Ontario Research Fund - Research Excellence, and the University of Toronto.
References
- 1) K. Li, R. Khanna, J. Zhang, Z. Liu, V. Sahajwalla, T. Yang and D. Kong: Fuel, 133 (2014), 194.
- 2) S. M. Shin, I. H. Jeong and S. M. Jung: Ironmaking Steelmaking, 45 (2018), 739.
- 3) X. Xing, G. Zhang, H. Rogers, P. Zulli and O. Ostrovski: Metall. Mater. Trans. B, 45 (2014), 106.
- 4) F. Meng, S. Gupta, D. French, P. Koshy, C. Sorrell and Y. Shen: Powder Technol., 320 (2017), 249.
- 5) M. Grigore, R. Sakurovs, D. French and V. Sahajwalla: ISIJ Int., 46 (2006), 503.
- 6) R. Xu, H. Zheng, W. Wang, J. Schenk and Z. L. Xue: Energy Fuels, 32 (2018), 12118.
- 7) S. Gupta, Z. Ye, B. Kim, O. Kerkkonen, R. Kanniala and V. Sahajwalla: Fuel Process. Technol., 117 (2014), 30.
- 8) S. Gornostayev, O. Kerkkonen and J. Härkki: ISIJ Int., 45 (2005), 1.
- 9) S. Nomura, H. Ayukawa, H. Kitaguchi, T. Tahara, S. Matsuzaki, M. Naito, S. Koizumi, Y. Ogata, T. Nakayama and T. Abe: ISIJ Int., 45 (2005), 316.
- 10) S. Nomura, H. Kitaguchi and K. Yamaguchi: ISIJ Int., 47 (2007), 245.
- 11) S. Nomura, H. Terashima, E. Sato and M. Naito: ISIJ Int., 47 (2007), 823.
- 12) A. Uchida, T. Kanai, Y. Yamazaki, K. Hiraki, Y. Saito, H. Aoki, N. Komatsu, N. Okuyama and M. Hamaguchi: ISIJ Int., 53 (2013), 403.
- 13) M. W. Chapman, B. J. Monaghan, S. A. Nightingale, J. G. Mathieson and R. J. Nightingale: Metall. Mater. Trans. B, 42 (2011), 642.
- 14) S. Gupta, D. French, R. Sakurovs, M. Grigore, H. Sun, T. Cham, T. Hilding, M. Hallin, B. Lindblom and V. Sahajwalla: Prog. Energy Combust. Sci., 34 (2008), 155.
- 15) B. Kim, S. Gupta, D. French, R. Sakurovs and V. Sahajwalla: Energy Fuels, 23 (2009), 3694.
- 16) M. J. Roberts, R. C. Everson, G. Domazetis, H. W. J. P. Neomagus, J. M. Jones, C. G. C. E. Van Sittert, G. N. Okolo, D. Van Niekerk and J. P. Mathews: Carbon, 93 (2015), 295.
- 17) J. A. Moulijn and F. Kapteijn: Carbon, 33 (1995), 1155.
- 18) G. Wang, J. Zhang, W. Chang, R. Li, Y. Li and C. Wang: Energy, 147 (2018), 25.
- 19) S. Ohnishi, A. Freeman and M. Weinert: Phys. Rev. B, 28 (1983), 6741.
- 20) H. Meyerheim, R. Popescu, J. Kirschner, N. Jedrecy, M. Sauvage-Simkin, B. Heinrich and R. Pinchaux: Phys. Rev. Lett., 87 (2001), 076102.
- 21) C. Wang and A. J. Freeman: Phys. Rev. B, 24 (1981), 4364.
- 22) H. Huang and J. Hermanson: Phys. Rev. B, 32 (1985), 6312.
- 23) L. Ding, Z. J. Zhou, W. Huo, Y. Wang and G. Yu: Ind. Eng. Chem. Res., 53 (2014), 19159.
- 24) Q. R. Liu, H. Q. Hu, Q. Zhou, S. Zhu and G. Chen: Fuel, 83 (2004), 713.
- 25) D. Lacey, J. Bowen and K. Basden: Ind. Eng. Chem. Fundam., 4 (1965), 275.
- 26) J. Y. Shang and E. Eduardo: Fuel, 63 (1984), 1640.
- 27) A. Calvelo and R. Cunningham: J. Catal., 17 (1970), 1.
- 28) J. Szekely and J. Evans: Chem. Eng. Sci., 25 (1970), 1091.
- 29) S. K. Bhatia and D. Perlmutter: AIChE J., 26 (1980), 379.
- 30) S. Vyazovkin, A. K. Burnham, J. M. Criado, L. A. Pérez-Maqueda, C. Popescu and N. Sbirrazzuoli: Thermochim. Acta, 520 (2011), 1.
- 31) S. Vyazovkin, K. Chrissafis, M. L. Di Lorenzo, N. Koga, M. Pijolat, B. Roduit, N. Sbirrazzuoli and J. J. Suñol: Thermochim. Acta, 590 (2014), 1.
- 32) V. Leroy, D. Cancellieri, E. Leoni and J.-L. Rossi: Thermochim. Acta, 497 (2010), 1.
- 33) G. Wang, J. Zhang, G. Zhang, X. Ning, X. Li, Z. Liu and J. Guo: Energy, 131 (2017), 27.
- 34) P. Giannozzi, S. Baroni, N. Bonini, M. Calandra, R. Car, C. Cavazzoni, D. Ceresoli, G. L. Chiarotti, M. Cococcioni, I. Dabo, A. D. Corso, S. de Gironcoli, S. Fabris, G. Fratesi, R. Gebauer, U. Gerstmann, et al.: J. Phys. Condens. Matter, 21 (2009), 395502.
- 35) M. T. Nguyen, N. Seriani and R. Gebauer: J. Chem. Phys., 138 (2013), No. 19, 194709.
- 36) H. J. Monkhorst and J. D. Pack: Phys. Rev. B, 13 (1976), 5188.
- 37) R. Sakurovs, L. Koval, M. Grigore, A. Sokolova, L. de Campo and C. Rehm: Int. J. Coal Geol., 188 (2018), 112.
- 38) T. Su, Z. Qin, G. Huang, H. Ji, Y. Jiang and J. Chen: Appl. Surf. Sci., 378 (2016), 270.
- 39) K. R. Hahn, M. Iannuzzi, A. P. Seitsonen and J. Hutter: J. Phys. Chem. C, 117 (2013), 1701.
- 40) Q. L. Tang and Q. H. Luo: J. Phys. Chem. C, 117 (2013), 22954.
- 41) D. Zhao, H. Liu, C. Sun, L. Xu and Q. Cao: Combust. Flame, 197 (2018), 471.
- 42) M. Grigore, R. Sakurovs, D. French and V. Sahajwalla: Energy Fuels, 23 (2009), 2075.
- 43) D. J. Harris and I. W. Smith: Symp. (Int.) Combust., 23 (1991), 1185.
- 44) B. Pang, D. Harris and R. Tyler: Pittsburgh Coal Conference, Pittsburgh, PA, (1996), 786.
- 45) S. M. Shin and S. M. Jung: Energy Fuels, 29 (2015), 6849.