Abstract
A holistic approach to diagnose the occurrence of cracking on HSLA steel slabs and propose countermeasures to prevent them is presented. The approach consisted on plant monitoring, including direct temperature measurements in the strand with pyrometers. Extensive characterization was performed via thermo-mechanical tests and microscopy techniques which revealed combination of Widmanstätten ferrite, acicular ferrite and secondary phases that promote embrittlement during casting with a minimum ductility between 700°C–800°C (± 50°C) which is responsible for cracking in this steel. Finally, 1D and 3D numerical models were developed to test possible cooling strategies which proved that reductions in water flowrate can have a positive effect in slab quality by avoiding the low ductility zone. Corrective actions included decreasing cooling to increase the overall temperature of the strand before the straightener to increase the overall temperature. Yet, some slabs still observed the presence of cracks which points at secondary factors such as high tundish temperatures >1530°C producing cracking. Other secondary factors include strong temperature variations up to ± 250°C during measurements which would send the strand corners into the low ductility range producing cracking despite having a hot slab centre. Although these optimization strategies are particular to each caster and steel grade, a similar approach could be applied to address secondary cooling issues during continuous casting. The models presented are an ideal toolkit to analyse the influence of product size and operation parameters in combination with plant monitoring and extensive microstructure characterization to improve the quality and productivity of the process.
1. Introduction
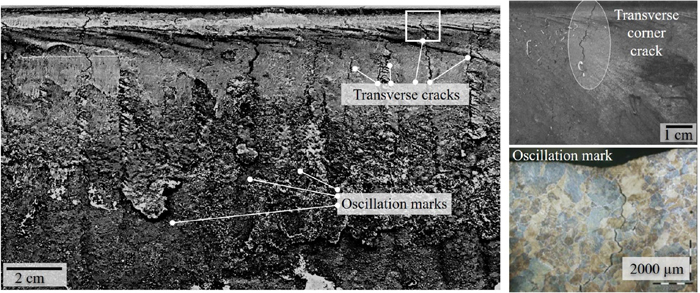
Surface defects are detrimental to productivity in a steel plant since they must be removed prior to post-processing (e.g. rolling, forging, etc.). These defects occur in the shape of depressions, deep oscillation marks or cracks in the surface of cast products (Fig. 1). Particularly, transverse corner cracks are recurrent issues in nowadays-steel production since their origin is composed of multiple variables such as steel composition, casting conditions and mechanical properties, which makes difficult to identify their origin. Corner cracks appear as hair-like channels, which may or not coincide with oscillation marks ranging from a few hundred microns to several millimetres. These cracks often run intergranularly to the product interior. Regrettably, transverse cracks are difficult to detect since they can be thin and be covered with scale or occur sub-surface requiring extensive inspection. Consequently, these defects must be removed by scarfing and/or grinding, which causes economic and energy losses. Moreover, if not detected, these cracks may even appear in the rolled plate surface, which must be then rejected or can cause line ruptures during rolling causing further yield losses. Therefore, an accurate description of their formation is of great interest to steelmakers to minimize their impact in productivity.
Cracking is a common issue during casting of microalloyed steels. Specifically, transverse corner cracks can be classified as hot- or solid-state cracks depending on the physical phenomena and thermo-mechanical behaviour causing failure. Hot cracks form during solidification of the strand (i.e. solidification cracking or hot tearing) starting at the meniscus and mould walls (primary cooling zone).1,2,3,4,5) Solidification at the meniscus defines the initial surface quality of the strand3,6,7) and irregular solidification at this stage is one of the principal causes for hot-cracks formation.1,8) Particularly, the heat extraction efficiency and lubrication at the mould determines the quality of the initial solidified shell. Thermal gradients cause shell distortion leading to volume changes (e.g. shrinkage) resulting in internal stresses.1,5,9,10,11,12) Furthermore, the shrinkage of the shell forms a gap between the mould and strand that determines powder consumption (slag infiltration) and reduces mould friction and sticking of the shell to the mould walls when combined with mould oscillation.5,9,11) The amount of shrinkage during solidification is also related to the alloying elements which govern the formation of different phases in the steel. For instance, delta ferrite to austenite transformation (i.e. peritectic transformation) promote higher volume changes than the one from liquid to austenite.13,14,15,16,17) This new modified distance (gap) between mould and shell affects significantly the heat transfer coefficient (HTC).18,19,20) Thus, an inadequate combination of these factors increases the risk to form deep oscillation marks, which act as preferential sites for solid-state crack formation during bending and straightening in the secondary cooling zone.21) Strain induced cracking in the secondary cooling is influenced by the shape changes of the strand, which results in tensile and compressive stresses that lower the ductility of the steel, as shown in Fig. 2.

The bender is the segment where the strand is subjected to its first deformation to follow a radius that changes the process from vertical to horizontal. This deformation induces tensile and compressive stresses at the outer and inner bow respectively,22,23,24,25) as shown in Fig. 2(b). Hence, cracks may appear in the bender depending on process parameters (e.g. temperature, casting speed, etc.). Afterwards, the strand continues solidifying as it travels through the rolls and follows the curved segments into the straightening zone. The strand is subjected to another strong deformation during straightening; experiencing thermal strains and mechanical forces, which can cause crack formation. In this segment, the stresses are the opposite of those in the bender with tension at the inner bow and compression at the outer, as shown in Fig. 2(c). Additionally, the presence of oscillation marks plays a very important role during bending and straightening. These marks can act as stress concentrators for cracking formation and later propagation. For instance, the concentration of tensile stresses can nucleate a crack at the oscillation mark root due to its “triangular” shape (Fig. 2(d)), which can open/propagate when reaching the straightener (Fig. 2(e)). In contrast, compressive stresses can close the oscillation mark and reduce the risk for cracking having a positive effect on crack occurrence. Other factors such as bulging (due to internal ferro-static pressure) and/or machine misalignment also play an important role on crack formation. Moreover, micro-cracks may also occur at the surface between consecutive oscillation marks which are strongly related to the steel phases evolving during solidification. For instance, a ductility loss is related to phase and precipitation transformation induced mainly by alloying elements. Microalloyed steels (e.g. HSLA, AHSS, etc.) generally exhibit low ductility at temperature ranges from 700 to 950°C.16,22,26,27) Generally, microalloyed steels with a peritectic amount of carbon (0,10–0,17 wt.%C) have a higher susceptibility to crack formation in comparison to conventional steels (e.g. medium/high carbon steels).17,22,28) On top of this, the peritectic transformation leads to significant volume changes leading to internal stresses which may result in further cracking of the final product.
Other studies relate the ductility loss to Widmanstätten ferrite (Wf) transformation induced by grain size and stresses (e.g. from bending and straightening).22,29,30) Formation of Wf is considered an undesired phase because it significantly decreases toughness resulting in cleavage/brittle cracks. Large austenite grains also induce Wf transformation in steels.11,22) Moreover, some of the alloying elements have a great effect on the ductility loss due to precipitation hardening occurring at high temperatures.31,32) It has been demonstrated that Nb has a strong detrimental effect when its content ranges between 0,03–0,04 wt.%Nb, which could promote cracking due to carbo-nitrides precipitation associated with low ductility.22,28,33,34,35,36) Yet, Nb is still used due to its beneficial effects on final mechanical properties. A possible way to circumvent this issue is to combine Nb with V and Ti which have a lesser effect on ductility loss.31) The combination of other elements such as Mn, Al, S, N can promote the formation of nitrides and sulphides, decreasing the solidus temperature and weakening the grain boundaries. These elements create narrow liquid film bands at grain boundaries during deformation due to their low melting point, leading to hot-crack formation.3,18)
Despite the extensive efforts to understand crack formation during CC, a large portion of the research is focused on alloying elements or numerical modelling, while fewer works focus on industrial actions to mitigate cracks from a processing standpoint. For instance, some strategies are based on improvement to the strand solidification in the primary cooling by using numerical models.10,19,21,37,38,39,40,41) Others challenged the conventional cooling by implementing the so called “dry casting” concept.42,43,44) These techniques are aimed to avoid hard cooling (and associated ductility drop), especially for microalloyed steels more susceptible to crack formation. Instead, soft cooling is applied with air-mist, which improves the surface quality of the strand. Moreover, this strategy can be also used to avoid oxide scale formation, which has a positive impact on surface defects.45,46,47,48,49)
The present work is based on a holistic approach to research encompassing steel composition-microstructure, process parameters and numerical modelling to find how these factors are correlated to crack susceptibility. Ultimately, this allows creating industrial strategies to reduce or even prevent cracking altogether in order to improve the productivity of the casting machine.
2. Approach
The present investigation seeks to develop strategies to minimize the formation of transverse corner cracks on HSLA steel slabs with a peritectic amount of carbon (0,15 wt.%C) by using a multi-disciplinary approach including plant monitoring, thermo-mechanical and microstructural characterization as well as numerical modelling. Plant monitoring includes real data from the casting machine (water flow rates, casting speed, tundish temperatures, temperature changes in bender and straightener, etc.). Crack characterization and phase identification is performed by using different lab-techniques (Optical and Scanning Electron Microscopy, etching and EDS). Finally, development and implementation of numerical models (1D and 3D) is proposed to predict the temperature behaviour in the strand surface which allows testing different cooling strategies to eliminate transverse corner cracks in CC.
2.1. Plant Measurements
Temperature measurements are performed by contactless infrared pyrometers (IMPAC ISQ 5-LO/SG type) designed for the steel industry with an optical fibre adapted to withstand rough conditions. Two pyrometers were installed at the Inner Bow (IB) of a conventional slab caster at two different positions. Pyrometer 1 (P1) was installed at 2,7 meters from the bender zone (segment 1, S1), while another pyrometer (P2) was installed at 19,3 meters in the straightener zone (end of segment 8, S8) as shown in Fig. 3. Temperature measurements were performed for different casting sequences during a production period of 2 months. Thermal monitoring generated 10000 input lines of data per heat for 25 databases on 51 heats to ensure statistical representativity of the results.

Figure 4 presents an example of data collected from the installed pyrometers (P1 and P2), which exhibits a gradient of ±200°C at the beginning of the sequence in the bender, and ±100°C at the straightener. Similar variations were practically observed in all sequences analysed.
2.2. Specimen Layout
Specimens were obtained from several of the monitored heats for the HSLA steel with a peritectic amount of carbon (0,15 wt.%C) cast in slabs with 1850 mm width and 210 mm thickness. The corner of the slab with presence of transverse cracks is sectioned to obtain smaller specimens of 15×15×15 mm for microstructure and crack characterization. The smaller specimens are taken along the casting direction, one from the corner with presence of cracks (sample 1), and two from the centre without cracks (sample 2 and 3), as shown in Fig. 5.
2.3. Microstructure Characterization
A standard metallographic method is applied for the characterization of specimens. Their surface is grinded with SiC abrasive papers and polished with diamond abrasive solutions. Afterwards, the polished surface is submerged in Nital solution (3% nitric acid in ethanol) per 30 seconds to reveal the micro-constituents present in the steel. Examination of cracks and micro-constituents is performed by using a Light Optical and Scanning Electron Microscopy (SEM) type Jeol JSM-6460 LV. Crack morphology of specimens without etching is characterized as a solid-state-brittle crack formed on a surface covered with an oxide layer, as shown in Fig. 6. The size of the cracks ranges between 22 to 30 mm length and 10 mm depth. Brittle cracks form as a result of localized strains during straightening, where the strand has almost completely solidified.

Further characterization confirms that cracks grow intergranularly along previous austenite grains, as shown in Fig. 7(a). In addition, the microstructure characterization revealed the formation of pearlite in a ferrite matrix with some pore growth inside the grains. In some cases, the morphology of cracks may correspond to hot cracks that initiate during solidification of the steel at the grain boundaries, as seen in Fig. 7(b).
Further observations of the microstructure revealed the presence of different types of ferrite. Morphology indicates that Allotriomorphic ferrite (Af), Widmanstätten ferrite (Wf) and in some cases bainitic-ferrite (Bf) is formed, as shown in Fig. 8.
Allotriomorphic ferrite (Af) is a phase that nucleates and grows along the austenite grain boundaries. Widmanstätten ferrite (Wf) tends to nucleate as parallel plates (needle type shape) that grow perpendicularly to Af grains. This phase is considered as detrimental and undesirable because decreases the toughness of steels.22,50) In contrast, acicular ferrite is a phase that initially grows from non-metallic inclusions.50) This phase can enhance the mechanical properties of steels (e.g. toughness) depending on the steel composition.51)
2.4. Thermo-mechanical Characterization
Generally, crack susceptibility of steels is measured by means of a thermo-mechanical tensile test (i.e. hot ductility test). Hot ductility determines the ductile/brittle behaviour of the steel at temperatures similar to those during hot processing (e.g. continuous casting).22) Accordingly, experiments are conducted on a Gleeble 3800 machine under temperatures relevant to the secondary cooling zone. Samples are heated at 1300°C at a controlled rate of 20°C/s to ensure the dissolution of precipitates and homogenization of the steel structure. Subsequently, specimens are subjected to tensile stresses at temperatures from 600 to 1000°C with intervals of 100°C under a strain rate of 10−3 s−1 (equivalent to the casting speed during processing). After tensile tests, the samples are water-cooled indirectly with cooper jaws at a rate of 10°C/s. The determination of crack susceptibility through the reduction of the area at fracture, and the total energy as a function of temperature is shown in Figs. 9(a)–9(b).

Figure 9(a) Reduction of area, UTS, and (b) engineering-true total energy as a function of temperature after hot ductility test.
Accordingly, minimum values of the area reduction as a function of temperature in Fig. 9(a) indicate that the ductility of the steel drops significantly at 800°C, and increases from 900 to 1000°C. The ultimate tensile strength (UTS) decreases between 600 and 700°C from 300 to 150 MPa, respectively. Afterwards, it decreases continuously to 1000°C without significant changes. Furthermore, according to the model previously proposed by the authors,22) the engineering and true total energy indicates that the steel may be also susceptible to crack formation at 700°C and less susceptible at 900°C.
3. Numerical Modelling
3.1. 1-D Model
A simple 1-D numerical model was developed as a workbench to test different strategies during secondary cooling. The 1-D model is based on the principle of specific heat capacity and it can predict the temperature evolution of the slab per segment by changing the amount of water in the sprays. The specific heat capacity is the ability of a material to absorb/exchange thermal energy with its surroundings. This is related to the kinetic energy of atomic motions and distortion energy of interatomic bonds since atoms are constantly vibrating at very high frequencies in solid materials. The heat capacity represents the amount of energy required to produce changes in temperature, expressed as:
where Q is the energy required to produce temperature changes (ΔT),
Ti and
Tf are the initial and final temperatures of the strand on each segment, C is the specific heat per unit mass of the solid [J/Kg°C], m is the mass of the system [kg] and ΔT is the temperature gradient between P1 and P2 [K]. The temperature difference (Δ
T) in
Eq. (1) is determined by approximating the temperatures per segment from the cooling curves. Thus, the initial temperature (
Ti) occurs at the beginning of one segment while (
Tf) is the temperature at the end of the segment. This criterion is applied for every segment where the value of (
Tf will be equal to
Ti for the next segment) as shown in
Fig. 10.
The density ρ is assumed as 7000 kg/m3 for steels in liquid state while the theoretical specific heat is considered to be 0.49 kJ/kg·K. On the other hand, it was assumed that the heat loss (Q) corresponding to each volume in the segments, is proportional to the amount of cooling water in a given segment. The total water flow rate was analysed per segment, from vertical rack to straightening zone since each cooling loop (i.e. per segment) has specific types of sprays and nominal water flow rates as a function of casting speed, steel grade, product width, etc. Thus, the nozzles have different positions in each segment (coordinates) and specific water distribution.
Reference points for the model are based on temperature measurements obtained from pyrometers (P1 and P2) and the empirical results from cooling curves. Cooling curves are plotted by considering the tundish temperature as starting point and the average temperatures at P1 and P2, 1000°C and 800°C respectively, with corresponding standard deviations of ± 250°C. Plant trials with different cooling strategies were suggested to prevent cracks in HSLA steels after analyzing the modelling data. Such trials were aimed at raising the temperature of the strand to avoid the low ductility zone between 700 to 850°C. Adjustments included a reduction of 5–10% in some cooling loops from bender to straightener as well as possible changes in casting speed. A comparison of the cooling curves with and without water flow changes in the secondary cooling is shown in Fig. 11.

Based on the results of cooling curves and crack susceptibility tests, it can be observed that heats prior to changes in water flow rates (dotted lines) were located below 850°C. It must be noted that the 1-D model predicts average cooling curves without the fluctuating effects of the rolls on temperature. In these cases, most of the slabs reveal the presence of cracks due to the loss in ductility compared to the ones cooled above the low ductility zone. Likewise, the curves closer to 850°C showed suspicion of cracks (grey dotted lines). Results after the suggested cooling strategies (continuous lines in Fig. 11) demonstrate that 10% reduction in the secondary cooling leads to improvement on slabs quality with a decrease of transverse corner cracks (no scarfing applied), and less suspicion of crack formation in some cases. Yet, a 5% reduction in the secondary cooling is less favourable with persistence of cracks.
3.2. 3-D Model
An advanced 3-D numerical model based on the traveling slice method was developed to simulate the heat transfer and solidification in the presented caster. The casting machine is constructed in the pre-processing stage including primary and secondary cooling zones (i.e. covering from the meniscus to straightener), including the details such as rolls and spray nozzles in their respective positions as shown in Fig. 12. The commercial code THERCAST, was used for the calculations where the solution method and fundamental equations are described elsewhere.52)

20 meters of cast length are simulated by moving the 3D slice through the casting machine across the different cooling sections in the primary and secondary cooling zones. An average tundish temperature (e.g. pouring temperature) of 1535°C is considered based on real data from the CC process. The traveling slice is fitted with 19 tracking points to record different features such as temperature, liquid fraction, and solidification time. These are defined at the slab surface of the inner bow with 9 sensors on each side (L/R) and 1 at the centre (C) of the strand. The distance between each sensor is counted from the centre of the slab with 0,1 m between the centre and R1/L1 as well as 0,2 meters between each sensor from L1/R1 to L9/R9. Temperature profiles along the casting length for the right and left side of the traveling slice by taking as a reference the centre, maximum, minimum and mean values are presented in Fig. 13.

In all cases, the temperature drops from 1550 to 1250°C before reaching the vertical rack. Afterwards, the temperature constantly decreases as low as 1050°C when reaching the bender (4 m cast length) where a plateau occurs after 16 m to the end of the straightener (20 m). Subsequently, the temperature drops 150 degrees (from 1200 to 1050°C) between the vertical rack (3 m) to the bender (4 m) and further down to 900°C when reaching the straightener. The temperature at the corners (sensors R9/L9) drops faster than the rest (sensors 1-8). The temperature at the left corner (L9) revealed a more intense cooling than R8, which decreases to 800°C after 10 m to the end of the casting length (50 degrees more than L9). The temperature at the centre decreases similarly as sensors L2 and R8 from the foot rolls to the vertical rack. These thermal changes of the strand during the secondary cooling could lead to strand distortion and possibly to crack formation during casting as discussed next.
4. Discussion
The analysis of cracking causes and strategies for process improvement are based on the thermomechanical and microstructure characterization, industrial measurements with pyrometers and product quality inspections combined with the predictions from 1D and 3D models. In terms of thermomechanical behaviour and microstructure evolution, a combination of micro-constituents such as Widmanstätten and Bainitic ferrite formed during cooling cause low ductility of this particular steel grade as shown in Fig. 8. Thus, the combination of ductility loss and mechanical stress at the bender and straightener are the main causes for crack formation. Niobium and Vanadium as main micro-alloying elements have a strong effect depending on its content and evolution during cooling which could promote cracking due to precipitation as carbides, nitrides and carbo-nitrides associated to low ductility values. These precipitates may act as nucleation sites for voids within the thin ferrite films; thereby, reducing their ductility and impeding the recovery processes. On the other hand, precipitates can also have a positive effect on the microstructure by controlling the kinetics (e.g. nucleation sites, grain size, etc.) during solidification enhancing mechanical properties. The presence of other elements such as S, P, Cu, etc., may also affect ductility since these can segregate at the grain boundaries as a liquid film band between dendrites due to their low melting point, which is another cause for brittle failure in steels.3) Some of these elements are present in the fracture zone of specimens after the hot ductility test (e.g. 800°C), which suggested the presence of P, MnS and Al2O3 after EDX analysis, as shown in Fig. 14.

The 1D model was used to investigate cooling strategies to avoid this low ductility zone by controlling the secondary cooling. Soft and hard cooling strategies were explored by taking into account the possible flow-rate limits of the cooling loops in the machine, see Fig. 15. It was concluded in this particular case that a reduction of water flow rate intensity could have a positive effect in slab quality by controlling the cooling on the surface.

Temperature profiles simulated with the 3D model were used to further analyse the strand behaviour from the meniscus to 20 meters of cast length. Comparison between the surface temperature at the inner bow after the changes proposed show a general agreement between 1D and 3D models for the final temperatures at the centre of the slab, see Fig. 16. However, the curves predicted by the 3D model registered higher cooling rates at the slab corners (R9 and L9). Still, the highest temperatures are predicted in the sensors close to such corners (R8 and L8) with almost 150 degrees difference between adjacent sensors. Furthermore, a number of plant trials was carried out with different levels of reduction in the water flow rate. 8 of these heats are combined with the 1D model in Fig. 1 and coloured by the presence or not of cracks (cracks in red).

A detailed analysis of the curves in the straightener is also presented in Fig. 16. Curves from the 1D+measurements and 3D model can be easily differentiated by the fluctuations observed in the 3D model, whereas the 1D curves remain almost horizontal. Surface inspection after trials revealed a reduction of crack occurrence but not for all the 8 sequences despite the increase of temperature to avoid the low ductility range.
This behaviour was not expected, which indicates that other factors are interacting to define the quality of the slabs. A possible culprit is the strong temperature variation observed in the pyrometers during measurements (100–200°C), which means that although the average temperature is in the safe range, the variability would send the strand into the low ductility range producing cracking in the corners. Furthermore, this behaviour may be accentuated by the presence of scale and/or casting powder residues which may act as a barrier to heat transfer and produce variations in the cooling of the strand.46) This makes control of secondary cooling a challenging task where the initial cooling promotes the nucleation of grains that may or not re-crystallize depending on the heat transported from the liquid core to the surface. If this heat is excessive and cooling is not enough, there is a strong risk of promoting additional grain growth ending in blow grains.29) Precipitates (Nb carbides and cementite in this case) play an important role in this process by restricting grain growth initially. Nevertheless, sustained high temperatures can also induce growth of these precipitates which make them preferential sites for crack initiation and propagation.
Variations in surface temperature are a consequence of the cooling in the process, but also other factors determine the temperature evolution during the sequence which are outside of the caster domain but have a profound influence in the process. For instance, casting speed is often used to accommodate delays or accelerate the process depending on previous steelmaking stages (e.g. converter delays, adjusting of composition in the ladle, degassing stations, etc.). The tundish temperature itself is determined by the previous ladle station where overall ranges are defined for delivery to the caster (e.g. 10 to 15° C are common in the industry) apart from the variation of temperature between beginning, middle and end of the sequence. A thorough analysis of the experimental data revealed a strong correlation between the tundish temperature, temperature gradient (ΔT) between the tundish and pyrometer 1 (P1) and ΔT between pyrometer 1 (P1) and pyrometer 2 (P2). These parameters connect the ΔT, casting speed and quality criteria of the slabs, as seen in Fig. 17.

Higher tundish temperatures were found for the slabs with presence of cracks; while lower tundish temperatures revealed no crack formation. Additionally, it was observed that the temperature decrease is higher in the sequences with poor quality (presence/suspicion of cracks) compared to sequences with better quality. The same behaviour was observed with the temperature from tundish to P2. Moreover, the temperature variation between P1 and P2 is slightly higher in the sequences with cracks vs no cracks. These variations are summarized in Table 1. The temperature variations (ΔT) shown in table 5 imply that cracks form when the cooling is faster. Furthermore, the highest cooling differences appear after P1 despite the fact that the water flow rates and casting speed had minor changes. Thus, the differences in tundish temperature induce changes in all ΔT’s.
Table 1. Variation of temperature ΔT in comparison with the quality of slabs.
| ΔT ranges | Tundish to P1 | Tundish to P2 | P1 to P2 |
|---|
| No cracks | Min 508 Max 510 | Min 610 Max 630 | Min 90 Max 110 |
| Corner cracks | Min 510 Max 555 | Min 630 Max 660 | Min 80 Max 160 |
5. Conclusions and Corrective Actions
A complete study was carried out in order to reduce/eliminate transverse corner cracking issues during casting of HSLA steel. The following conclusions can be drawn from the investigations, which led to suggestions for corrective actions applied to the caster:
• Thermomechanical tests of the HSLA steel, revealed minimum ductility values occurring between 700°C–800°C (± 50°C) which are responsible for crack formation. The ductility increases sharply with the increment in reduction of area above 900°C.
• Successful measurements with pyrometers at two positions (start of bender and middle of straightener) in an industrial caster revealed strong temperature variations for all cast sequences. Larger fluctuations were observed in Pyrometer 1 (~250°C) in bender zone when compared to Pyrometer 2, straightener (~100°C). This suggests a faster cooling at the beginning of the casting length in the bender zone, and softer cooling towards the straightener zone.
• All heats with temperature evolutions below c.a. 850°C at the straightener shown the presence of cracks, while sequences above to 850°C revealed better quality.
• Metallographic analysis showed the presence of different types of ferrite and pearlite in the HSLA steel. The combination of phases such as Widmanstätten ferrite, acicular ferrite and secondary phases such as precipitates, oxides and localized melting, promote brittle behaviour during processing.
• A 1-D numerical model was developed based on the temperature measurements with pyrometers and the heat capacity principle. The model predicts the cooling behaviour of the strand based on the percentage of total water amount during secondary cooling (from bender to straightener) and pyrometer data. This model was applied to predict quantitatively the changes in cooling if the water amount is reduced in a range of −5% to −10%.
• Trials demonstrated that surface quality improved by avoiding the low ductility zone. Yet, the presence of cracks are still observed in some of the slabs, which points at additional factors are also influencing the cracking formation during processing.
• Tundish temperature is the most evident of these factors, which clearly confirm that higher temperatures (more than 1530°C) leads to worst quality during all heats; while sequences with better quality revealed lower temperatures (less than 1530°C).
• An important second factor is ΔT (e.g. the temperature loss) in the strand. It was observed that ΔT from tundish to Pyrometer 1 is higher in the sequences with poor quality compared to sequences with better quality (e.g. bad quality = ↑ΔT; good quality =↓ΔT). The same behaviour was observed with the temperature from tundish to Pyrometer 2 in all sequences.
Based on the facts above, two main corrective actions were proposed, 1) Decreasing the amount of water cooling to increase the overall temperature of the strand before the straightener and 2) Increase the casting speed to increase the temperature of the strand. This strategy is only for this specific steel grade, caster configuration and cooling loops. Certainly, different strategies are needed for specific caster layouts and steel grades. Yet, it is the author’s contention that a similar approach to analyze the process variables and material properties could be applied to address the cracking issues on continuous casting. The models presented are considered suitable analysis tools for a first guess (via 1-D model) and a more detailed analysis of the influence of product size (via 3-D model) in combination with plant monitoring and extensive microstructure characterization. The authors use a similar approach to analyze the impact of different tundish temperatures and oxide scale formation in continuing research.
Acknowledgments
The authors are grateful for economical and scientific support provided by the following organizations and colleagues. Rosa Pineda acknowledges the National Council on Science and Technology (CONACYT) for economical support for her PhD studies. To SWERIM (former Swerea MEFOS) for support during PhD studies and plant trials.
References
- 1) W. Kurz: Metall. Ital., (2008), 56.
- 2) B. G. Thomas: Yearbook of Science and Technology, Chapter 15, ed. by M. Dekker, New York, (2001), 499.
- 3) S. Louhenkilpi: Treatise on Process Metallurgy, Vol. 3: Industrial Process, Part A, ed. by S. Seetharaman, Elsevier, UK, (2014), 373.
- 4) J. Campbell: Complete Casting Handbook: Metal Casting Processes, Metallurgy, Techniques and Design, Butterworth-Heinemann, Birmingham, UK, (2015), 479.
- 5) H. Fredriksson and U. Akerlind: Materials Processing during Casting, Wiley Online Library, England, (2006), 19-406.
- 6) R. Miranda, J. González, L. Hoyos, A. de Ita and M. A. Barrón: Meniscus Profile in the Mold of a Steel Continuous Caster, (2005), Corpus ID: 199425839.
- 7) A. Sorek and Z. Kudliński: Arch. Metall. Mater., 57 (2012), 371.
- 8) U. Yoon, J. K. Park, B. G. Thomas and I. Samarasekera: Steelmaking Conf. Proc., (Nashville, TN), Vol. 85, ISS, Warrendale, PA, (2002), 245.
- 9) S. Louhenkilpi, J. Miettinen and L. Holappa: ISIJ Int., 46 (2006), 914.
- 10) CONSOLCAST (Comprehensive Modelling, Monitoring and Control of Solidification for Optimisation of Continuous Casting Process), RFCS Projects, 2018, https://ec.europa.eu/info/files/synopsis-rfcs-projects_en, (accessed 2019).
- 11) Innovation and Excellence in Continuous Casting, ed. by H. Marti, Stahl Eisen, Düsseldorf, (2003), 54.
- 12) B. Santillana, B. G. Thomas, G. Botman and E. Dekker: Proc. 7th ECCC, (Düsseldorf), Germany, (2011).
- 13) M. Vedani, D. Ripamonti, A. Mannucci and D. Dellasega: Metall. Ital., 5 (2008), 19.
- 14) B. Mintz: ISIJ Int., 39 (1999), 833.
- 15) J. J. R. Mondragón, M. H. Trejo and M. de Jesús Castro Román: ISIJ Int., 48 (2008), 454.
- 16) M. El-Bealy and H. Fredriksson: Metall. Mater. Trans. B, 27 (1996), 999.
- 17) S. Saleem, M. Vynnycky and H. Fredriksson: Metall. Mater. Trans. B, 48 (2017), 1625.
- 18) S. Louhenkilpi, J. Miettinen, J. Laine, R. Vesanen, I. Rentola, J. Moilanen, V. Visuri, E. Heikkinen and A. Jokilaakso: IOP Publishing, 529 (2019), 012051.
- 19) OptilocalHT (Optimisation of Local Heat Transfer in the CC Mould for Casting Challenging and Innovative Steel Grades), RFCS Projects, 847269, 2019, https://ec.europa.eu/info/files/synopsis-rfcs-projects_en, (accessed 2020).
- 20) W. Wang, X. Long, H. Zhang and P. Lyu: ISIJ Int., 58 (2018), 1695.
- 21) P. E. R. Lopez, K. C. Mills, P. D. Lee and B. Santillana: Metall. Mater. Trans. B, 43 (2012), 109.
- 22) R. M. Pineda Huitron, P. E. Ramirez Lopez, E. Vuorinen, R. Jentner and M. E. Kärkkäinen: Mater. Sci. Eng. A, 772 (2020), 138691.
- 23) R. M. Pineda: Master Thesis, Luleå University of Technology, (2015), http://www.diva-portal.org/smash/record.jsf?pid=diva2%3A1021562&dswid=3098, (accessed 2021).
- 24) X. Zhang and L. Guo: ISIJ Int., 57 (2017), 76.
- 25) K. Toishi, Y. Miki and N. Kikuchi: ISIJ Int., 59 (2019), 865.
- 26) G. T. Van, D. Carron, P. Le Masson, V. Robin, A. Andrieu and J. Stodolna: J. Mater. Eng. Perform., 27 (2018), 5114.
- 27) T. Wojcik and E. Kozeschnik: Mater. Sci. Forum, 879, (2017), 2107.
- 28) Y. Liu, L. Du, H. Wu and R. D. K. Misra: Steel Res. Int., 91 (2020), 1900265.
- 29) R. Mišičko, M. Fujda, S. Fedáková, D. Fedáková and S. Szekeres: Proc. AlSTech, Steelmaking Conf. Proc., (Atlanta, GA), AIST, Warrendale, PA, (2012), 2333.
- 30) K. Xu and B. G. Thomas: Proc. AlSTech, Steelmaking Conf. Proc., Vol. 2, (St. Louis, MO), AIST, Warrendale, PA, (2009), 641.
- 31) D. Crowther: Proc. Conf. on the Use of Vanadium in Steel, (Beijing), (2001), 99.
- 32) M. S. Dyer, J. G. Speer, D. K. Matlock, A. J. Shutts, S. G. Jansto, K. Xu and B. G. Thomas: Iron Steel Technol., 7 (2010), 96.
- 33) S. Shanmugam, N. Ramisetti, R. Misra, T. Mannering, D. Panda and S. Jansto: Mater. Sci. Eng. A, 460 (2007), 335.
- 34) B. Chen and H. Yu: Int. J. Miner. Metall. Mater., 19 (2012), 525.
- 35) G. Wu, Y. Zhang and S. Wu: J. South. Afr. Inst. Min. Metall., 119 (2019), 503.
- 36) C. Lee, W. Seol, B. H. Kim, S. Kim, J. H. Jang, T. Lee, S. Moon and S. Kim: Eng. Fail. Anal., 98 (2019), 240.
- 37) CHILLUB (Advanced Method to Improve Work Roll Life Time and Surface Quality of Hot Rolled Strip by New Coupled Oil Free Lubrication and Chilling), RFCS Projects, RFSR-CT-2008-00012, 2008, https://ec.europa.eu/info/files/synopsis-rfcs-projects_en, (accessed 2009).
- 38) DEFFREE (Integrated Models for Defect Free Casting), RFCS Projects, RFSR-CT-2008-00007, 2008, https://ec.europa.eu/info/files/synopsis-rfcs-projects_en, (accessed 2009).
- 39) INNOSOLID (Investigation of Innovative Methods for Solidification Control of Liquid Steel in the Mould), RFCS Projects, RFSR-CT-2012-00011, 2012, https://ec.europa.eu/info/files/synopsis-rfcs-projects_en, (accessed 2013).
- 40) M. Matveev, N. Kolbasnikov and A. Kononov: Trans. Indian Inst. Met., 70 (2017), 2193.
- 41) SUPPORT-CAST (Supporting Control by Inspection of Surface Quality and Segregation on Cast Products through Integration of Novel Online Monitoring and Advanced Modelling into an Accessible Cloud Access Platform), RFCS Projects, 754130, 2017, https://ec.europa.eu/info/files/synopsis-rfcs-projects_en, (accessed 2018).
- 42) T. Bolender and J. Cappel: Steel GRIPS, 2 (2004), 84.
- 43) P. Pennerstorfer, J. Watzinger and C. Enzinger: Met. Mag., 1 (2015), 301.
- 44) M. Javurek, P. Ladner, J. Watzinger, P. Wimmer and G. Shan: Proc. Metec Estad, (Düsseldorf), Germany, (2015), 15.
- 45) R. M. Pineda Huitron, P. E. Ramirez Lopez, E. Vuorinen, P. N. Jalali, L. Pelcastre and M. E. Kärkkäinen: Metals, 10 (2020), 1243. https://doi.org/10.3390/met10091243
- 46) R. M. Pineda Huitron, P. E. Ramirez Lopez, E. Vuorinen, P. N. Jalali, L. Pelcastre and M. E. Kärkkäinen: Metals, 10 (2020), 1245. https://doi.org/10.3390/met10091245
- 47) R. Wendelstorf, K. Spitzer and J. Wendelstorf: Int. J. Heat Mass Transf., 51 (2008), 4892.
- 48) M. Chabičovský, M. Hnízdil, A. Tseng and M. Raudenský: Int. J. Heat Mass Transf., 88 (2015), 236.
- 49) J. Ma, B. Wang, D. Zhang and W. Song: ISIJ Int., 58 (2018), 915.
- 50) H. Bhadeshia and R. Honeycombe: Steels: Microstructure and Properties, Butterworth-Heinemann, UK, (2017), 781.
- 51) D. Loder, S. K. Michelic and C. Bernhard: J. Mater. Sci. Res., 6 (2017), 24.
- 52) Transvalor, Thercast 3D simulation software for Metal Casting, http://media.transvalor.com/thercast-brochure-en-2015, (accessed 2016).


