Abstract
The adhesion failure of coke with low-quality coal affects its strength. However, it would be difficult to specify the interface between caking coal and low-quality coal where the adhesion failure arises. In this study, the interface was specified using alumina beads that can be identified by the X-ray CT (computed tomography) as a model compound of low-quality coal, and thus fracture behavior of coke assuming that low-quality coal was blended was investigated experimentally and numerically. To quantitatively evaluate the adhesiveness between coke matrices and alumina beads, the three-dimensional structure of coke was evaluated by the X-ray CT. As a result, the adhesiveness decreased with an increase in the volume ratio of alumina beads, while the adhesiveness was not related to the particle diameter. Also, the fracture strength of coke decreased with an increase in the volume ratio and the particle diameter of alumina beads. For the fracture analysis using RBSM (Rigid Bodies-Spring Model), the fracture strength was also negatively correlated with the volume ratio and particle diameter of alumina beads. Focusing on fracture behavior of coke model, the interface between coke matrices and alumina beads fractured at the non-uniform part where alumina beads existed closely. Therefore, this study suggested that the distribution of low-quality coal within the coke as well as the adhesion failure has an effect on strength of coke with low-quality coal.
1. Introduction
The permeability in a blast furnace is important for its operation with stability and high efficiency. Coke plays a role in a spacer to keep the permeability. However, coke is pulverized by a load from packing materials in a blast furnace and the pulverized coke inhibits the permeability. Thus, coke strength is desired to be high. In general, high-strength coke is produced from caking coal. However, the recoverable reserve and the price of caking coal are less and higher than these of steam coal. Therefore, it is desirable to produce high-strength coke using low-quality coal whose recoverable reserve and price are more and lower than caking coal as raw material.
In previous studies, it has become clear that the pore structure and the adhesion failure of coke affect its strength.1,2,3) As for the pore structure, Kubota et al. observed the polished surface of coke by optical microscope and then suggested that low-roundness or large pore was likely to be an origin of the fracture.4) Hayashi et al. suggested that low-roundness pore was generated due to the difference of plastic temperature range between low-quality coal and caking coal when low-quality coal was blended.5) Amanat et al. imaged the coke before and after a compression test using the X-ray CT (computed tomography) and then suggested that the shape or the arrangement of pore affected the fracture behavior of coke.6) In addition, in numerical analysis, Tsafnat et al. conducted stress analysis based on the finite element method for the coke model in which the actual pore structure of coke was reflected using the X-ray CT and then indicated that stress concentrated at the parts where pore wall thickness was small. They also reported that the parts where the crack was observed in the experiment corresponded to the ones where stress concentrated in the stress analysis.7,8) Therefore, the three-dimensional complex coke structure was evaluated using the X-ray CT, and then it has been clear that the pore structure affects coke strength. On the other hand, as for the adhesion failure, Nomura et al. investigated the relationship between the adhesion failure and the expansion rate, and then suggested that coke strength decreased because coal particles did not adhere well when low-quality coal with low expansion rate was blended.9) Kanai et al. observed the fractured surface of coke with low-quality coal using the SEM (scanning electron microscope), and then indicated that the existence ratio of the adhesion failure increased with an increase in the blending ratio of low-quality coal and coke strength decreased with an increase in the existence ratio of the adhesion failure.10) Matsuo et al. performed the fracture analysis for the two-dimensional coke model with the adhesion failure using RBSM (rigid bodies spring model) and then numerically indicated that coke strength decreased with an increase in the existence ratio of the adhesion failure.11) As is mentioned above, it has been clear that the adhesion failure of coke as well as the pore structure affect its strength. However, the investigation of the adhesion failure remains in the two-dimensional study at present. Therefore, the three-dimensional evaluation of the adhesion failure and pore structure using the X-ray CT is required. However, it would be difficult to identify the interface between caking coal and low-quality coal where the adhesion failure arises using the X-ray CT. In coke with low-quality coal, the adhesion failure which exists three-dimensionally would affect coke strength as well as the pore structure, and thus it is necessary to consider this effect.
In this study, using the alumina beads which do not soften in the carbonization process of coal and can be identified by the X-ray CT as a model compound of low-quality coal, we evaluated the three-dimensional structure of coke assuming that low-quality coal was blended. Also, the effect of the volume ratio and the particle diameter of alumina beads on coke structure or strength was investigated. Furthermore, the fracture strength was calculated by the fracture analysis for the three-dimensional coke models with some spheres representing the alumina beads using RBSM, and the validity of this analysis was evaluated by comparison to experimental results. In addition, the fracture behavior of coke with the alumina beads was investigated in detail by using the numerical analysis.
2. Experiment
2.1. Preparation of Coke Sample
The cylindrical coke from the caking coal shown in Table 1 and alumina beads as a model compound of low-quality coal was used as samples. The cylindrical coke was prepared with the procedure below. The caking coal of −1 mm 100% in particle diameter and alumina beads were blended with the ratio listed in Table 2 and water was added to the blend so that moisture content of the blend was 6%. Here, the amount of the alumina beads addition is 0.1, 0.2 or 0.3 in volume with their diameter of 4 mm and the particle diameter of alumina beads was 0.1, 0.3 or 0.5 mm with the volume fraction of 0.2 with consideration of low-quality coal addition. The blends were packed in a cylindrical mold of 12 mm in inner diameter and formed to 10 mm in height. Note that the blend was packed so that the bulk density was 1100 kg/m3 when only coal was packed, which enables to evaluate cokes strength even with the alumina beads. The cylindrical coke samples were obtained by carbonizing up to temperature of 1000°C at heating rate of 3°C/min under nitrogen atmosphere.
Table 1. Coal properties.
| Proximate analysis [wt% d.b.] | TI [%] | Ro [%] | MF [ddpm] |
|---|
| Ash | VM |
|---|
| 10.5 | 24.7 | 14.5 | 1.200 | 1570 |
VM: volatile matter, TI: total inert, Ro: reflectance in oil, MF: maximum fluidity.
Table 2. Blending ratio of samples.
| Sample | Coal [vol%] | Alumina beads [vol%] |
|---|
| ϕ0.1 | ϕ0.3 | ϕ0.5 |
|---|
| 1 | 80 | 20 | – | – |
| 2 | 80 | – | 20 | – |
| 3 | 80 | – | – | 20 |
| 4 | 90 | – | 10 | – |
| 5 | 70 | – | 30 | – |
The cylindrical coke samples were compressed by using the universal testing machine (Autograph AG-I 50 kN, Shimadzu Corp.) and the fracture strength of coke samples was measured. The cylindrical coke samples were loaded in the diametral direction at load speed of 1 mm/min, and then the fracture strength σ was calculated from the maximum load P when the sample fractured, diameter d and height l of the sample based on Eq. (1). Note that the number of the tests for each blending condition of coke was four.
2.3. Observation of Fractured Surface
The fractured surface of the coke samples after compression test was observed using the scanning electron microscopy (SEM, S-4800, Hitachi High-Technologies Corp.). Here, the accelerating voltage was 5.0 kV.
2.4. Evaluation of Internal Structure
The cylindrical coke samples were scanned by the X-ray CT (phoenix nanotom m, General Electric). Here, the tube voltage and current of X-ray were 60 kV and 300 μA. Also, the resolution and the slice width were 10 μm/pixel and 10 μm, respectively.
The voxels in X-ray CT image were then classified into pore, coke matrix or alumina bead based on the discriminant analysis method12) and the ternary images were obtained. The three-dimensional image (approximately 1200 × 1200 × 1000 voxels) of coke was constructed by stacking the ternary images and the internal structure of coke samples was evaluated. As shown in Fig. 1, the region of the sample was partitioned concentrically and in height direction, and then the existence ratio of pore, coke matrix or alumina bead was calculated by counting the voxels in each partitioned region. The number of partitions was determined by the number of voxels based on the square-root choice, and regions of sample were partitioned so that each region was equal in volume. Also, to investigate adhesiveness between alumina beads and coke matrices, the structure around alumina beads was evaluated quantitively. Focusing on the voxel image around an alumina bead shown in Fig. 2, it was found that the alumina bead was covered with coke matrix. Thus, the surface coverage was defined as the ratio of coke matrix voxels covering the surface of alumina beads and calculated from Eq. (2).
|
Surface coverage of beads=
The number of coke matrix voxels sharing a face, an edge or a vertex with voxels of alumina bead
The number of coke matrix and pore voxels sharing a face, an edge or a vertex with voxels of alumina bead
| (2) |
3. Numerical Analysis
3.1. Numerical Method
Fracture analysis was conducted for coke models with some spheres representing alumina beads using RBSM (Rigid Body Spring Model).13) In the RBSM, elements are assumed to be rigid bodies, and the surface force between elements is estimated by placing springs which resist relative displacement in vertical, tangential or rotational direction at the interface between the elements. The surface force between elements per unit area σ is expressed in Eq. (3) with relative displacement δ.
Here,
D is material constant matrix and relative displacement
δ was calculated from displacement of element
u. The displacement of elements
u was calculated by solving the element stiffness equations of three-dimensional RBSM described in
Eq. (4).
Here,
K is stiffness matrix, and
F is external force vector. Note that AMGS (Algebraic Multi-Grid Solver)
14) was employed as a matrix solver in this study.
3.2. Analytical Object
To conduct fracture analysis considering alumina beads as a model compound of low-quality coal, coke model with some spheres representing alumina beads were developed. The mesh in the analytical object was generated by the mesh generation software (Pointwise version 18.1 R1, Pointwise Inc.) so that the surface of alumina beads was smooth, and then the coke model shown in Fig. 3 was developed.
To investigate the effect of the volume ratio and the particle diameter of alumina beads on the fracture behavior, as shown in Fig. 4, analytical objects were developed by changing the number of alumina beads or the particle diameter. Also, the four coke models which differed only in the arrangement of alumina beads were developed using uniform random number and the effect of the arrangement on the fracture behavior was also investigated. Note that alumina beads were arranged so that they did not touch each other.
3.3. Numerical Condition
Fracture analysis assuming a uniaxial tensile test was performed for the coke models, and then fracture strength was calculated. For boundary conditions, the analytical object was bonded on the bottom side and forced displacement on the top side for the z-direction was given. The other sides were set to free. The spring constant of the springs placed at the interface between elements was calculated from the material properties shown in Table 3. Also, material property of coke matrix was set to the macro property15) that included pore and was calculated by the homogenization method. Moreover, the springs placed within an alumina bead were assumed not to fracture. The spring constant of the springs placed at the interface between alumina bead and coke matrix was set to the same value as that of springs placed at that between matrices. The fracture strength of the spring was set to 5 MPa based on the results from the diametral compression test for the coke prepared from only caking coke.16) When the stress of tensile spring placed at the interface between elements reached this value, all the springs placed at the interface was assumed to fracture.
Table 3. Material properties.
| Elastic modulus [GPa] | Poisson’s ratio [−] |
|---|
| Coke matrix15) | 10.0 | 0.21 |
| Alumina beads17) | 420 | 0.25 |
4. Results and Discussion
4.1. Effect of the Blending Conditions on Coke Structure and its Strength
Figure 5 shows SEM images of the fractured surface of coke with alumina beads. It was found that coke matrices adhered to alumina beads covering them. Also, coke samples would fracture at the interface between alumina bead and coke matrix because depressions where alumina beads were considered to exist were observed. This would be because the shrinkage ratio of alumina beads was lower than that of coal and crack was generated at these interfaces.

To investigate the effect of alumina beads on the macrostructure of coke, Fig. 6 shows the existence ratio of alumina bead in the height and radial directions. Here, error bars represent the standard deviation. In the height direction, while porosity decreased at the bottom (h = 0) and the top (h = 10) of coke, the existence ratio of coke matrix and alumina bead increased. This would be because alumina beads were transferred by the swelling of coal during the carbonization process. In the radial direction, while porosity decreased from the center (r = 0) toward the outside (r = 6), the existence ratio of coke matrix increased. In addition, the existence ratio of alumina bead was almost constant regardless of radial direction. These results indicated that the distribution of pore or alumina bead was non-uniform in coke samples.

Next, to investigate the structure around alumina beads, Fig. 7 shows the surface coverage for the volume ratio or the particle diameter of alumina beads. Focusing on the volume ratio of alumina beads shown in Fig. 7(a), the surface coverage decreased with an increase in the volume ratio. This is because the total surface area of alumina beads increases as well as the volume ratio of coal decreases as the volume ratio of alumina beads increases. For the particle diameter of alumina beads shown in Fig. 7(b), the surface coverage in the case of 0.3 mm was the highest. This would be because the total surface area of alumina beads with a diameter of 0.1 mm was larger than that of 0.3 mm, and thus the surface coverage in the case of 0.1 mm became low. Also, the lower surface coverage in the case of 0.5 mm than in the case of 0.3 mm would be caused by the difference in shrinkage ratio between alumina beads and coal. When the particle diameter increases on the condition of equality in the volume ratio, although total surface area of alumina beads decreases, surface area of an alumina bead increases. Thus, a crack generated at the interface between alumina bead and coke matrix became large and the surface coverage would decrease. These results suggested that the structure around alumina beads changed by the particle diameter on the condition of equality in the volume ratio.

Figure 8 shows the experimental results of the relationship between the fracture strength and (a) the volume ratio and (b) the particle diameter of alumina beads. Here, these values are the ones averaged over four experimental results and error bars represent the standard deviation. Focusing on Fig. 8(a), the fracture strength decreased with an increase in the volume ratio of alumina beads. This is because the volume ratio of coal decreases with an increase in that of alumina beads. Focusing on Fig. 8(b), the fracture strength decreased with an increase in the particle diameter of alumina beads. The distribution of alumina beads would not be uniform in coke sample because the number of alumina beads with a large diameter was smaller than that with a small diameter. As a result, the coke sample would fracture first at the part with a non-uniform structure.
4.2. Validation of Numerical Analysis
Figure 9 shows the numerical results of the relationship between the fracture strength and the volume ratio or the particle diameter of alumina beads. Here, these values are the average ones of numerical results for the four coke models which differ only in the arrangement of alumina beads on the same condition and error bars represent the standard deviation. As shown in Fig. 9(a), the fracture strength was negatively correlated with the volume ratio of alumina beads. Also, error bar in the case of 5 vol% was the largest. This is because the distribution of alumina beads varies widely by the small number of alumina beads. Focusing on Fig. 9(b), the fracture strength decreased with an increase in the particle diameter of alumina beads. These trends are consistent with the experimental results, and thus it is indicated that fracture analysis for coke models with alumina beads is available. It should be noted that the absolute value in fracture strength in the numerical solutions is different in the one in the measurements. This is because the appropriate parameters such as spring constant between coal alumina beads for the RBSM have not been found yet.

To qualitatively evaluate the fracture behavior of coke with alumina beads, Fig. 10 shows the appearance of fractured springs in fracture analysis using the RBSM. Red springs represent fractured ones. The springs placed at the interface between alumina bead and coke matrix which existed in the tensile direction fractured at the strain of 1.70 × 10⁻⁵. As strain increased, springs fractured from around fractured springs and along the interface between coke matrix and alumina bead. Therefore, the interface between coke matrices and alumina beads would become an origin of the fracture. This shows the similar trend with the result observed by SEM images of the fractured surface of coke sample shown in Fig. 5.

Next, the fracture behavior of coke with alumina beads was quantitatively evaluated. Figure 11 shows the cumulative proportion of fracture area to total area in the volume ratio or particle diameter of alumina beads. Note that the proportion of fracture area to total area is the sum of the fractured area divided by the sum of area of the interface between coke matrices and that between coke matrices and alumina beads. The total area differed by maximum 5% under each condition. On the whole, the interface between coke matrices and alumina beads fractured at first. In addition, it was found that not only the interface between coke matrix and alumina bead but also that between coke matrices fractured as the strain increased.
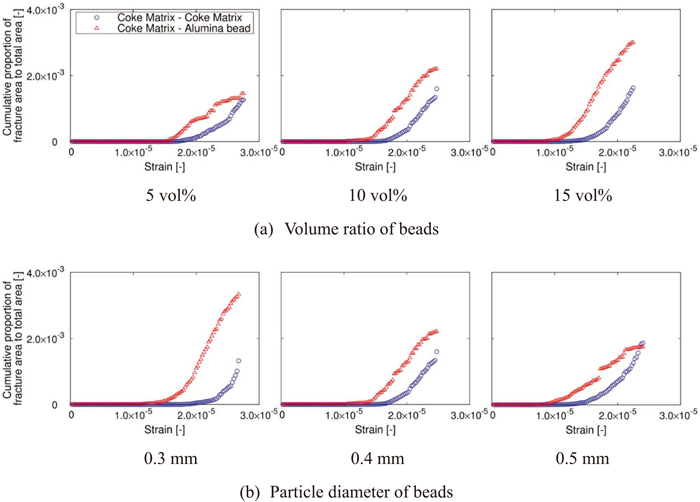
Furthermore, the effect of the blending conditions on fractured behavior was investigated. Focusing on the volume ratio of alumina beads shown in Fig. 11(a), the interface between coke matrix and alumina bead fractured at low strain with an increase in the volume ratio. This is because that total surface area of alumina beads increases and the interface which becomes an origin of the fracture increases. It was observed the interface between coke matrices also tended to fracture at low strain. This would be because alumina beads existed closely as the volume ratio of alumina beads increased and then stress concentrated at the coke matrices which existed between alumina beads. Focusing on the particle diameter of alumina beads shown in Fig. 11(b), as the particle diameter increased, the interface between coke matrix and alumina bead fractured at low strain. The distribution of alumina beads is biased in coke models because the number of alumina beads with a large diameter is smaller than that with a small diameter. Thus, this trend would be because coke models fractured at the non-uniform parts such as a part where many alumina beads existed. Also, the proportion of fractured area at the interface between coke matrix and alumina bead to total area increased as the particle diameter of alumina beads decreased. This is because total surface area of alumina beads increases. These results suggested that the interface between coke matrix and alumina bead is likely to fracture as compared with that between coke matrices.
5. Conclusion
To investigate the fracture behavior of coke with low-quality coal, using alumina beads as a model compound of low-quality coal, the effect of the blending conditions on coke structure or strength was investigated experimentally and numerically.
The evaluation of the three-dimensional structure in coke by the X-ray CT indicated that the distribution of pore or alumina bead was non-uniform in coke samples. Also, the observation of the fractured surface of the coke samples by the SEM showed that coke matrices adhered to alumina beads covering them. To quantitatively evaluate the adhesiveness, the surface coverage was defined as the ratio of coke matrix covering the surface of alumina beads. As a result, the surface coverage decreased with an increase in the volume ratio of alumina beads due to an increase in the total surface area of alumina beads as well as a decrease in the volume ratio of coal. On the other hand, the surface coverage decreased when the particle diameter of alumina beads was small and large due to an increase in the total surface area of alumina beads and the difference in shrinkage ratio between alumina beads and coal. Furthermore, the fracture strength decreased as the volume ratio and the particle diameter of alumina beads increased. Therefore, there is not necessarily a correlation between the adhesiveness and the fracture strength and other factors such as non-uniform distribution of alumina beans in coal sample might influence the fracture strength.
The fracture analysis for the coke models with some spheres representing the alumina beads indicated that the fracture strength was negatively correlated with the volume ratio and the particle diameter of alumina beads. To understand this relationship, the fracture behavior of the coke models was focused on. Increasing the volume ratio of alumina beads, the coke models are likely to fracture due to an increase in the interface between coke matrices and alumina beads, which became the fracture origin. In addition, the coke models with alumina beads with a large diameter is likely to fracture because the distribution of alumina bead is non-uniform in the coke models.
Above all, this study suggested that the distribution of low-quality coal in coke with low-quality coal as well as the adhesion failure has an effect on the strength of the coke.
References
- 1) M. G. K. Grant, A. C. D. Chaklader and J. T. Price: Fuel, 70 (1991), 181.
- 2) J. W. Patrick and A. E. Stacey: Fuel, 57 (1978), 258.
- 3) T. Arima: Tetsu-to-Hagané, 87 (2001), 274 (in Japanese).
- 4) Y. Kubota, S. Nomura, T. Arima and K. Kato: Tetsu-to-Hagané, 96 (2010), 328 (in Japanese).
- 5) Y. Hayashi, S. Aizawa, K. Uebo, S. Nomura and T. Arima: ISIJ Int., 54 (2014), 2503.
- 6) N. Amanat, N. Tsafnat, B. C. E. Loo and A. S. Jones: Scr. Mater., 60 (2009), 92.
- 7) N. Tsafnat, G. Tsafnat and A. S. Jones: Fuel, 87 (2008), 2983.
- 8) N. Tsafnat, N. Amanat and A. S. Jones: Fuel, 90 (2011), 384.
- 9) S. Nomura, T. Arima and K. Kato: Fuel, 83 (2004), 1771.
- 10) T. Kanai, Y. Yamazaki, X. Zhang, A. Uchida, Y. Saito, M. Shoji, H. Aoki, S. Nomura, Y. Kubota, H. Hayashizaki and S. Miyashita: J. Therm. Sci. Technol., 7 (2012), 351.
- 11) S. Matsuo, D. Igawa, T. Kanai, A. Toishi, Y. Saito, Y. Matsushita, H. Aoki, S. Nomura, H. Hayashizaki and S. Miyashita: ISIJ Int., 54 (2014), 2527.
- 12) N. Otsu: IEEE Trans. Syst. Man Cybern., 9 (1979), 62.
- 13) T. Kawai: The Finite Element Method in the 1990’s, Springer, Berlin (1991), 182.
- 14) H. P. C. Laboratory: AMGS, http://hpcl.info.kogakuin.ac.jp/lab/software/amgs, (accessed 2019-02-25).
- 15) K. Ueoka, T. Ogata, Y. Morozumi, H. Aoki, T. Miura, K. Uebo and K. Fukuda: Tetsu-to-Hagané, 92 (2006), 184 (in Japanese).
- 16) K. Hiraki, H. Hayashizaki, Y. Yamazaki, T. Kanai, X. Zhang, M. Shoji, H. Aoki, T. Miura and K. Fukuda: ISIJ Int., 51 (2011), 538.
- 17) H. Yanada, N. Shimizu and M. Nagai: Fine Ceramics Dictionary, Gihodo Shuppan Corporation, Tokyo, (1987), 31 (in Japanese).


