Welding and Joining
Effects of Mn and Al on Acicular Ferrite Formation in SAW Weld Metal
2021 Volume 61 Issue 5 Pages 1614-1622
Details
2021 Volume 61 Issue 5 Pages 1614-1622
The acicular ferrite (AF) formation behaviors of submerged arc weld metals with various Al/O ratios and Mn contents were investigated. The nucleation sites of AF consisted of inclusions surrounded by a TiO layer. The Al/O ratio affected the number of inclusions that acted as AF nucleation sites. At high Al/O ratios, the number of inclusions was low and the microstructure was coarse.
We considered that the formation of AF was promoted by the presence of the TiO layer via two mechanisms: good lattice matching with ferrite and formation of a Mn-depleted zone owing to the absorption of Mn. The Baker–Nutting orientation relationship between TiO and AF was observed. Moreover, we determined that Mn-depleted zones were formed around the inclusions surrounded by TiO. The Mn content of weld metals affected the formation of AF via the formation of Mn-depleted zones. When the Mn content of the weld metals was high, Mn-depleted zones were formed.
Submerged arc welding (SAW) is a welding method that requires high heat input and presents high efficiency. SAW is used in the industry for ship building and civil engineering projects where high toughness is required. The microstructure of SAW weld metals consists mainly of acicular ferrite (AF). AF is intragranular ferrite which is nucleated from inclusions in the weld metal and forms fine microstructure. To improve the toughness of the weld metal, it is important to increase its AF fraction.1,2,3) Generally, it is effective to control the hardenability,4,5) the welding cooling rate6) and the chemical compositions of the weld metal for higher AF fraction.
Regarding the chemical compositions of the weld metal, it is well known that the toughness of the weld metal depends on the Al/O ratio.7) The Al/O ratio is related to the oxygen potential after Al deoxidation and affects the composition and number of oxides formed during welding, which control the formation of AF, and consequently, the toughness of the weld metal. However, the toughness fluctuation was confirmed even at the optimal Al/O ratio. Thus, the variation of toughness at the same Al/O ratio condition is considered to be influenced by the other weld metal elements.
This study focuses on Mn, because Mn is one of the most important elements that affect the formation of AF in weld metals. Farrar and Watson8) investigated the effect of Mn on the AF fraction and indicated that, when the amount of Mn was smaller than a certain value, the AF fraction was extremely low. However, this relationship has not been described in detail.
In addition, Mn is a constituent of inclusions that promote the formation of AF.9,10,11,12) Yamada et al.13) reported that composite inclusions of spinel oxide (MnAl2O4) and amorphous Si–Mn oxide surrounded by a TiO layer acted as AF nucleation sites. Moreover, they reported the Baker–Nutting (B–N) orientation relationship between the TiO layer and adjacent ferrite grains. It was considered that the formation of AF was promoted owing to the good lattice matching between the TiO layer and ferrite grains.14)
Shigesato et al.15) indicated the presence of Mn-depleted zones around oxides in the weld heat-affected zone, which acted as AF nucleation sites. Mn is an austenite-stabilizing element; moreover, it is considered that the absorption of Mn by inclusions increases the Ae3 temperature of the austenite matrix adjacent to the inclusions and promotes the formation of AF. In addition, Seo et al.16) confirmed the presence of Mn-depleted zones in weld metals.
The amount of Mn affects the formation of AF; however, the reason is still unclear. In this study Mn effects on AF formation as a same Al/O ratio are investigated under the same welding condition.
Table 1 shows the chemical compositions of the submerged arc weld metals in this study. SAW was performed via one pass over the groove of 30 mm thick steel plates. The heat input was 65 kJ/cm, the carbon equivalent (Ceq = C + Mn/6 + (Cr + Mo + V)/5 + (Ni + Cu)/15) was approximately 0.4, and the oxygen content of the weld metal was approximately 0.03 mass%. Moreover, the Al/O ratios changed with the Al content.
| C | Si | Mn | Al | Ti | O | Others | Al/O | Ceq | |
|---|---|---|---|---|---|---|---|---|---|
| weld A | 0.07 | 0.23 | 1.6 | 0.013 | 0.018 | 0.027 | Cu,Ni,Cr,Mo,Nb,B,N | 0.48 | 0.40 |
| weld B | 0.06 | 0.24 | 1.6 | 0.029 | 0.017 | 0.029 | 1.00 | 0.40 | |
| weld C | 0.06 | 0.20 | 0.5 | 0.013 | 0.017 | 0.030 | 0.43 | 0.42 | |
| weld D | 0.06 | 0.21 | 0.5 | 0.026 | 0.018 | 0.032 | 0.81 | 0.43 |
After welding, Charpy impact tests were performed. The test specimens were sampled from 2 mm below the surface of the weld metal and the notch position was at the center of the weld metal. The ductile–brittle transition temperature (DBTT) was determined to be the transition temperature at which 50% brittle fracture appeared. Microstructures of the weld metals were observed by optical microscope over 10 fields in the area of 1000 μm×1000 μm. Electron back scattered diffraction (EBSD) measurements of the weld metal were performed at the step size of 0.5 μm. The number of inclusion particles in the weld metal was determined using field-emission scanning electron microscopy (FE-SEM) at the acceleration voltage of 10 kV over a 0.5 mm × 0.5 mm area. Furthermore, the inclusions that served as AF nucleation sites were observed using field-emission transmission electron microscopy at the acceleration voltage of 200 kV. The crystal structures of the inclusions were identified using their electron diffraction patterns and the element distributions were examined using energy dispersive X-ray spectroscopy (EDS). To observe the atomic structure of the interface between the oxides and steel matrix and to analyze the element distributions around the interface, the inclusions were observed in detail using aberration-corrected scanning transmission electron microscopy (STEM) at the acceleration voltage of 300 kV. The STEM specimens were prepared using the focused ion beam method at the acceleration voltage of 30 kV.
Figure 1 shows the relationship between the Al/O ratio and DBTT. For the high-Mn weld metals (Mn mass% ≒ 1.5), the highest toughness was obtained at the Al/O ratio of approximately 0.5, which was the most commonly reported optimum ratio,7) and the toughness decreased at higher Al/O ratios. Conversely, the toughness of the low-Mn weld metals (Mn mass% ≒ 0.5) was much lower than that of the high-Mn weld metals, although the toughness dependence on the Al/O ratio of the two types of weld metals was similar.

Effect of Al/O ratio and Mn for DBTT.
Figure 2 shows the optical micrographs of the weld metals in this study. The microstructures of the high-Mn weld metals (welds A and B) mainly consisted of AF. In addition, the microstructure of weld B was coarser than that of weld A. The microstructures of the low-Mn weld metals (welds C and D) were much coarser than those of the high-Mn weld metals. The AF size of weld C was markedly larger than that of welds A and B. Furthermore, AF formation was not confirmed in weld D and the microstructure was the coarsest of them.

Optical microscopy observations of weld metals.
Figure 3 shows the EBSD images of the weld microstructures, and the grain boundaries with misorientation of ≥15° are indicated by black lines. As depicted in Fig. 2, the microstructures of the high-Mn weld metals were refined, and the finest microstructures were obtained at the optimal Al/O ratio of approximately 0.5.

EBSD analysis of weld metal microstructures.
As the effective grain size (deff), which was defined by the equivalent circle diameter of the grains surrounded by the boundaries presented in Fig. 3 increased, the DBTTs of all weld metals increased (Fig. 4).

Relationship between deff and DBTT.
Figure 5 depicts the relationship between the Mn content of the weld metals and deff. As shown in Figs. 2 and 3, deff depended on the Mn content and increased when the Al/O ratio deviated from the optimum ratio for samples with the same Mn content. These results confirmed that controlling the Mn content and Al/O ratio are important for refining the microstructure and improving the toughness of weld metals.

Relationship between Mn content and deff.
To further investigate the effects of the Mn content and Al/O ratio on the formation of AF, inclusions acting as AF formation sites were identified. Figure 6 illustrated the EDS elemental mappings of the inclusions acting as AF formation sites of the weld metals. The main constituent elements of these welds were Si, Mn, Al, Ti, and O. Because S was not always present, it was concluded that it was probably not essential for the formation of AF. A Ti-containing outer layer that surrounded the inclusions was observed for weld A, B and C in this study and there was no significant difference in the coverage of TiO among these welds. The Ti-containing layer of weld A, which contained more Mn than weld C, was wider than that of weld C. However, it was unclear whether that affected the AF formation ability.
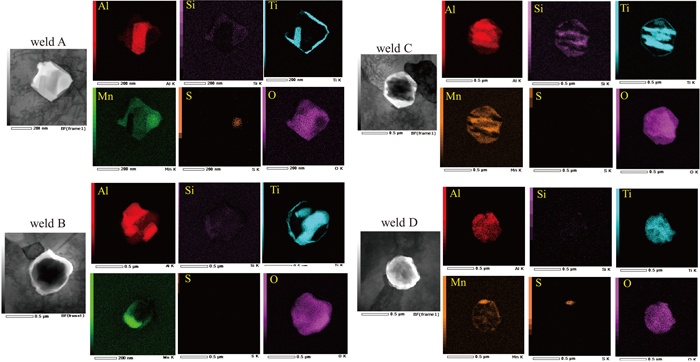
Results of EDS elemental mapping of the inclusions acting as AF formation sites.
Figure 7 illustrates the transmission electron microscopy (TEM) images of weld A. The AF formation sites were determined to be composite inclusions of MnAl2O4 and amorphous oxide surrounded by a Ti-containing layer. The electron diffraction pattern of the Ti-containing layer revealed that its crystal structure was B1 (NaCl type). Because the spectral peaks of O and N were observed in the pattern of this layer, it was hypothesized that the layer consisted of Ti (O, N). The spectral peak of N was observed in the electron energy loss spectroscopy (EELS) profile of the layer, although it was weaker than that of O. In this study, this Ti-containing layer was assumed to be TiO because Yamada et al.13) reported similar inclusions as being TiO. The configuration of the inclusions in weld C was similar; however, the TiO layer was thinner.

TEM observation results of inclusions acting as AF formation sites (weld A). (Online version in color.)
Figure 8 illustrates the TEM images of weld B. The inclusions acting as AF nucleation sites in welds B (high Al/O ratio) consisted of (Al–Ti)- and (Al–Mn–Ti–(Si))-based oxides. The configuration of the inclusions in weld D was similar. However, TiO layers were detected around several inclusions in weld B but not around the inclusions in weld D.

TEM observation results of inclusions acting as AF formation sites (weld B). (Online version in color.)
We investigated the TiO layers surrounding the inclusions that formed AF in welds A and C in more detail. Figure 9 illustrates the bright-field TEM images of the inclusions and Mn concentration profiles around the inclusions. The concentration profiles along the lines in Fig. 9 were obtained by EDS analysis. For weld C, which contained little Mn (Mn mass% ≒ 0.5), the Mn concentration in the steel matrix was almost constant. Conversely, for weld A, which contained more Mn (Mn mass% ≒ 1.6), a Mn-depleted zone was distinctly observed around the TiO layer/steel matrix interface.

Mn concentration profiles around the inclusions (weld A and C). (Online version in color.)
These results are summarized in Table 2. AF was observed where the inclusions were surrounded by TiO layers (welds A, B, and C), which implied that regardless of the type of inclusions, the presence of the TiO layer around inclusions was important to promote AF formation. Furthermore, the formation of the Mn-depleted zone appeared to increase the probability of the formation of AF.
| Sample | Main compositions | Number of TiO/Number of observed inclusions | Mn depleted zone | deff |
|---|---|---|---|---|
| weld A | Amorphous + MnAl2O4 | 6/6 | formed | 4.3 |
| weld B | (Al–Ti)-based + (Al–Mn–Ti–(Si))-based oxide | 5/6 | formed | 6.7 |
| weld C | Amorphous + MnAl2O4 | 4/6 | ― | 9.6 |
| weld D | (Al–Ti)-based + (Al–Mn–Ti–(Si))-based oxide | 0/6 | ― | 19.5 |
Figure 10 illustrates the relationship between the deff and the number of Si-, Mn-, Al-, and Ti-containing inclusions (defined as N4), which are presumed to be potential AF nucleation sites. The number of inclusions was determined using FE-SEM. The Si-, Mn-, Al-, and Ti-containing inclusions were presumed to be potential AF nucleation sites, and therefore, were counted. N4 decreased and deff increased as the Al/O ratio increased. It was considered that high Al/O ratios led to the formation of Al2O3, which resulted in the decrease in the number of inclusions.17) In addition, when the Mn content was changed, although N4 was almost unchanged, deff changed significantly.

Relationship between N4 and deff.
Aberration-corrected STEM was used to analyze the element distributions at the TiO layer/steel matrix interface in more detail. The bright-field and high-angle annular dark field (HAADF) images of the inclusions and the concentration distributions of Mn, Ti, and O in Fig. 11 confirmed that the TiO layer contained Mn.

Bright-field images of the inclusions and the concentration distribution of Mn, Ti and O (weld A).
Figure 12 illustrates the high-magnification HAADF image of the TiO layer/steel matrix interface. The incident electron beams were oriented along the [1 1 0] direction of the bcc Fe crystals for the steel matrix and [1 0 0] direction of the B1 structure for the TiO layer. The deviations from those directions were very small because the HAADF image illustrates the atomic rows of both the steel matrix and TiO layer. This indicated that the orientation relationship between the steel matrix and TiO layer accurately satisfied the B–N relationship in the observed region, that is, AF nucleated on the inclusions. We did not investigate whether the orientation relationship at the TiO layer/steel matrix interface always satisfied the B–N relationship accurately, although it was within several degrees from the B–N relationship for all samples examined in this study (Fig. 7).

HAADF images of the interface between the TiO layer and the steel matrix.
Figure 13 presents the Mn, Ti, O, Si, and Fe concentration profile along the line perpendicular to the TiO layer/steel matrix interface. EDS measurements were performed using an incident electron beam oriented along the [1 1 0] direction of the Fe crystals, which was almost identical to the [1 0 0] direction of TiO, as illustrated in Fig. 12. Under these conditions, the TiO layer/steel matrix interface was expected to be nearly parallel to the electron beam because the habit plane was presumed to be plane (0 0 1) of Fe and TiO. However, the TiO layer/steel matrix interface was not necessarily a flat plane, which degraded the spatial resolution of the analysis near the interface. Moreover, electron probes broadened in the specimens. In this study, although the beam diameter was quite small (approximately 0.1 nm), the specimen thickness was approximately 100 nm so that the probe could broaden to approximately 10 nm inside the specimens. Therefore, the spatial resolution was not too high, and thus, the concentration profiles in Fig. 13 are not steep at the interface. Nevertheless, the profiles presented flat regions in the TiO layer, where the Mn/Ti ratio was approximately 1/9. The absolute values of the concentrations were not entirely reliable because the K factors for the EDS quantitative analysis, in particular those of light elements, are affected by electron channeling when the incident beam coincides with a zone axis. In addition, although the TiO layer contained a certain amount of N, which was detected using EELS, the contribution of N was ignored when calculating the compositions because the EDS peak of N overlapped with the low-energy peak of Ti. Although the quantitative analysis results are still disputable, our results indicated that the TiO layer contained Mn and N.

Quantitative analysis of concentration profiles by EDS (weld A).
As illustrated in Fig. 14, the presence of a Mn-depleted zone in the vicinity of the TiO layer/steel matrix interface was also confirmed, and the Mn concentration in the steel matrix was reduced by approximately 1 at% at the interface.

Mn concentration profiles around the inclusions (weld A).
Typically, the formation mechanism of intragranular AF at inclusions is discussed using two theories: the good lattice matching with ferrite and formation of the Mn-depleted zone.
Inclusions, such as TiN,10) MnAl2O4,8) MnTi2O4,12) and TiO13) are considered to promote the formation of AF because of their good lattice matching with ferrite. This is one of the possible AF formation mechanisms in this study. The B–N orientation relationship between TiO and AF was observed in this study; however, the differences in deff values between the high- and low-Mn weld metals illustrated in Fig. 9 could not be explained using this mechanism. The ferrite grain size of high-Mn weld metals (welds A and B) was much smaller than that of low-Mn metals (welds C and D) even if the number of inclusions was almost the same for both types of weld metals, which indicated that the inclusions in the high-Mn metals could promote the transformation of ferrite.
Another possible mechanism is the formation of the Mn-depled zone. Mn-depleted zones were reported around MnS and Ti2O3 in the heat affected zone of the weld15,18,19) and weld metals16) and promoted the intragranular transformation of ferrite. In this study, we determined that Mn-depleted zones could be formed around the TiO-surrounded inclusions that consisted of amorphous Si–Mn oxide and MnAl2O4 (welds A and C) and also around the TiO-surrounded inclusions that consisted of Al–Ti and Al–Mn–Ti–(Si) oxides (weld B). It was not clear why the compositions of the inclusions depend on the Al contents in this study, but the presence of the TiO layer around inclusions was important to promote AF formation, regardless of the type of inclusions. The Mn-depleted zone around Ti2O3 was considered to be formed via the absorption of Mn into the oxide.18,20) Takamura et al.21) and Yamamoto et al.18) considered that oxides that contained many cation vacancies could absorb Mn from the steel matrix because the absorbed Mn atoms rapidly diffused in the oxides via cation vacancies. According to Takamura et al.,21) Ti2O3 and TiO are cation-vacancy types of oxides, and thus, not only Ti2O3 but also TiO is considered to be able to absorb Mn and form Mn-depleted zones. Koseki et al.22) obtained the Mn concentration profiles at the interfaces between various oxide powders and a low alloy steel matrix and observed the absorption of Mn by TiO and the formation of the Mn-depleted zone around the TiO layer/steel matrix interface.
In this study, we confirmed that Mn-depleted zones were formed near the TiO layer/steel matrix interface of high-Mn weld metals (welds A and B). Two possibilities are considered. One is that the Mn-depleted zone formed because of the absorption of Mn by the TiO layer. In this case, the TiO layer would be generated at a higher temperature, and consequently, Mn atoms would be absorbed into it at lower temperatures. The other possibility is that the Mn-depleted zone formed when the Ti–Mn oxide layer precipitated on the inclusions in the austenite matrix. In this case, the TiO layer and the Mn depleted zone were formed simultaneously. In both cases, the TiO layer seems to be generated at a temperature higher than 700 deg.C because Mn-depleted zone is not formed below 700 deg.C as Mn atoms hardly diffuse.15) On the other hand, there is a possibility that the TiO layer precipitated after AF was generated. Takada reported that Ti diffused at a low temperature (600–700 deg.C) in an amorphous B2O3, which was a low melting point oxide, and TiO was formed after AF nucleation.23) In the current study B2O3 was not found, so that the diffusion rate of Ti was not so fast at a low temperature. Although the transformation temperature of AF is not confirmed, it is considered to be lower than 600 deg.C according to the previous reports.6,24) Therefore, we considered that the TiO layer was generated at a higher or the same temperature of Mn-depleted zone formation and the generation of TiO layer contributed to the formation of Mn-depleted zone. The formation process of TiO and Mn-depleted zones around them should be investigated in detail in future studies.
4.2. The Effects of Mn Content and Al/O Ratio on the Formation of AFThe TiO-surrounded inclusions became AF nucleation sites, as indicated in Table 2. Moreover, the Mn content and Al/O ratio affected the formation of AF (deff). Thus, we considered that the Mn contents of weld metals affected the formation of AF via the formation of Mn-depleted zones around the TiO layer. For high-Mn weld metals (welds A and B; 1.6 mass% Mn), Mn-depleted zones were formed. In contrast, Mn-depleted zones were not detected for low-Mn weld metals (welds C and D; 0.5 mass% Mn). One possibility is that the amount of absorption of Mn is small due to the thinner TiO layer. Another possibility is that the quantity of Mn-depletion was too small to detect by EDS analysis even if Mn-depleted zones were formed in low Mn weld metals. The amount of depletion in high-Mn weld metals (welds A and B) was approximately 1 mass%. When the Mn content in steel decreases by 1 mass%, the temperature of the γ → α transformation increases by approximately 50 K.18) In the case of low-Mn weld metals, even if the Mn-depleted zone was formed, the driving force of the transformation from γ to AF might not be sufficient because the amount of depletion in low-Mn weld metals was lower than 0.5 mass% (Mn content of matrix; 0.5 mass%). However, The Mn detection limit of the EDS analysis was approximately 0.3–0.5 mass%, and thus, it might be difficult to detect quantitatively the presence of the Mn-depletion zone in low-Mn weld metals which contain less than 0.5 mass% Mn.
The TiO layer of the low-Mn weld metals was thinner than that of the high-Mn ones. That implied that the Mn content affected the formation of the TiO layer. Although the formation mechanism of the Mn-depleted zone has not been elucidated, a certain amount of Mn is necessary for the formation of the Mn-depleted zone. That is consistent with the results reported by Farrar and Watson,8) who indicated that the AF fraction abruptly decreased to almost zero as the Mn content decreased below 1 mass%.
The number of inclusions that could act as AF nucleation sites is another important factor affecting the microstructure. Moreover, the Al content affects the number of inclusions.4,7,17,25,26) When the Al content is excessive, Al2O3 particles, which do not act as AF nucleation sites, are mainly formed. Consequently, the number of inclusions that could serve as AF nucleation sites decreases.
Larger amounts of AF were formed when the TiO layer was present and the Mn-depleted zone was formed around it (welds A and B) than when the TiO layer was present but the Mn-depleted zone did not form (weld C). Moreover, the formation of AF was promoted by the presence of the TiO layer itself, even when the Mn-depleted zone did not form around it, as determined by comparing welds C and D. Therefore, we concluded that the formation of AF was promoted by the presence of the TiO layer via both mechanisms: the good lattice matching with ferrite and formation of the Mn-depleted zone owing to the absorption of Mn by the TiO layer, and summarized our findings in Fig. 15.

Schematic diagrams about effect of the Mn and Al contents on AF formation. (Online version in color.)
High-Mn weld metals with optimum Al/O ratios, such as weld A (1.6 mass% Mn, Al/O = 0.48), which possessed the finest AF microstructure of all analyzed samples, contained numerous inclusions that could act at AF nucleation sites. The surface of these inclusions was surrounded by TiO, which indicated the good lattice matching with ferrite. Furthermore, Mn-depleted zones were formed around the inclusions, which increased the driving force of the γ → α transformation. Therefore, the probability of AF formation in weld A was very high.
Conversely, weld C (0.5 mass% Mn, Al/O = 0.43), a low-Mn weld metal with optimal Al/O ratio, contained as many inclusions as weld A. In addition, even though TiO was formed on the surface of its inclusions, no Mn-depleted zone was observed in this sample. For weld B (1.6 mass% Mn, Al/O = 1.00), a high-Mn weld metal with high Al/O ratio, both the TiO layer and Mn-depleted zone were formed around the inclusions. However, the number of inclusions that could act as AF nucleation sites was smaller than that of weld A. Consequently, the probability of AF formation for welds B and C was lower than that of weld A.
Lastly, no TiO layer or Mn-depleted zone were observed for weld D, a low-Mn weld metal with high Al/O ratio (0.5 mass% Mn, Al/O = 0.81). Moreover, the number of inclusions for this weld was small, and therefore, no AF was formed and the weld presented very coarse microstructure.
The toughness and AF formation behavior of SAW metals with various Al/O ratios and Mn contents were systematically investigated, and the following conclusions were drawn.
• The toughness obtained at the Al/O ratio of approximately 0.5 was higher than that obtained at the Al/O ratio of approximately 1.0.
• Even when the Al/O ratio was optimal (Al/O≒0.5), the microstructures of low-Mn weld metals were much coarser and their DBTTs were much higher than those of high-Mn weld metals.
• The Al/O ratio was related to the number of inclusions that acted as AF nucleation sites. At high Al/O ratios, the number of inclusions was low and the microstructure was coarse.
• AF was formed at the inclusions surrounded by a TiO layer, and the B–N orientation relationship between TiO and AF was observed.
• The TiO layer contained a significant amount of Mn (> 6 at%) and Mn-depleted zones were formed around the TiO layer in high-Mn weld metals. The formation of the Mn-depleted zones significantly depended on the Mn content. When the Mn content of the weld metals was high (1.6 mass%), Mn-depleted zones were formed. The decrease in the Mn content of the weld metals reduced or eliminated the formation of Mn-depleted zones.
• From the above results, we concluded that the formation of AF in weld metals was promoted by the presence of the TiO layer because of two mechanisms: good lattice matching between TiO and ferrite and formation of the Mn-depleted zone.