Transformations and Microstructures
Resistance to Temper Softening of Low Carbon Martensitic Steels by Microalloying of V, Nb and Ti
2021 年 61 巻 5 号 p. 1641-1649
詳細
2021 年 61 巻 5 号 p. 1641-1649
The resistance to temper softening in low carbon martensite with its underlying origin, by microalloying of strong carbide-forming alloying elements (V, Nb and Ti) to an Fe-0.1C-1.5Mn-0.05Si (mass%) alloy, was investigated in this study. With similar hardness in as-quenched condition in all the alloys used, the hardness of tempered martensite is increased by V, Nb and Ti additions, particularly after treatment at higher temperature with longer time. The increment in hardness becomes larger by more amount of V addition, while with almost the same amount of microalloying additions, Nb and Ti provide larger strengthening than that of V. Atom probe measurements have revealed that a high density of nano-sized alloy carbides are formed in those alloys with V, Nb and Ti additions at 923 K, where large secondary hardening was observed. At 723 K, where there is some resistance to temper softening, however, almost no precipitation of V, Nb and Ti can be detected. The X-ray line profile analysis of the tempered alloys implies that the reduction in dislocation density during tempering is strongly retarded by V, Nb and Ti additions. This should be the major reason for their resistance to temper softening at relatively lower temperature, even without nano-precipitation of alloy carbides.
As-quenched martensite in carbon steels cannot be directly used in industry due to its poor toughness regardless of its high strength. Tempering process is necessary for martensitic steels to control the microstructure and properties for structural applications. Generally, the hardness of low and medium carbon lath martensite becomes monotonously decreased by tempering, due to the reduction in both dislocation density by recovery, and solute carbon by carbide precipitation.1) Such a softening can be effectively suppressed by the additions of substitutional alloying elements, which is known as the resistance to temper softening and the underlying origin varies depending on the type of element.2) For example, in steels with the additions of non-carbide-forming elements such as Mn, Si and Al, the factor controlling the growth rate of cementite changes from the long-range diffusion of C in ferrite into the partitioning of alloying element between ferrite and cementite,3,4) which retards the coarsening rate of cementite and concomitant softening.5) Besides that, the additions of Si and Al contribute to the softening resistance also due to inhibited transition from fine metastable ε carbide to coarse cementite.6,7) On the other hand, when steels containing carbide-forming elements such as Cr, Mo, V, Ti and Nb, are tempered at relatively high temperature above 500°C, fine precipitation of alloy carbide occurs after the dissolution of cementite, leading to the increment in hardness and secondary hardening.8) The magnitude of resistance to temper softening becomes larger with the increment in the amount of alloy addition, while relatively larger contribution to hardness can be obtained by strong carbide-forming elements when compared at the same alloy content. Secondary hardening occurs only when the amount of Mo addition is larger than 1 mass%, but does not occur even with 4 mass% of Cr addition.9,10) On the contrary, in the case of V as a strong carbide-forming element, secondary hardening was reported to occur even with the addition less than 0.2 mass%.11) This is because the solubility of strong carbide-forming element in ferrite is extremely small, and thus finer alloy carbide is formed with larger driving force for precipitation.12)
By using transmission electron microscopy (TEM), the precipitation behaviors in tempering of steels containing strong carbide-forming element (M; M = V, Nb, Ti) were widely investigated in the past. Nishida and Tanino13) studied the V-added steels and reported the nano-precipitation of B1-structured MC-type alloy carbide holding Baker-Nutting orientation relationship ((001)α//(001)MC, [100]α//[110]MC) with martensitic matrix. The same phenomenon was also observed in Nb-added14) and Ti-added15) steels, respectively. However, regarding the precipitation strengthening in martensitic steels, very few research was performed to quantitatively analyze the dispersion of nano-sized alloy carbide, which is crucial for the discussion on its contribution to resistance to temper softening. On the other hand, it is widely known that the addition of substitutional alloying elements retards recovery and recrystallization,16) while the associated strain aging was also systematically studied in ferritic steels.17) These results suggest the occurrence of solute clustering and segregation in the vicinity of dislocation during tempering of martensite,13) which was recently confirmed by experiments.18) Namely, the addition of strong carbide-forming elements contributes to resistance to temper softening, possibly through the alloying effects on recovery of dislocation as well.19)
Therefore, the tempering behaviors of martensite in V, Nb and Ti-microalloyed low carbon steels were systematically investigated in this study, to clarify the mechansism(s) of resistance to temper softening through quantitative evaluation of hardness and microstructural evolutions.
An Fe-0.1C-1.5Mn-0.05Si (mass%) alloy was used as the Base alloy, while the alloys with further additions of 0.1 or 0.4 mass% V, 0.1 mass% Nb, 0.1 mass% Ti, were used for comparison in this study (Hereafter, unless otherwise specified, the alloy composition will be denoted in mass%). The chemical compositions of the alloys used are shown in Table 1, together with the solution temperature of alloy carbide (MC) in γ calculated by using Thermo-Calc® (TCFE9 thermodynamic database).
| Alloy | C | Mn | Si | V | Nb | Ti | N | P, S, O | Fe | Sol. temp. of MC/K |
|---|---|---|---|---|---|---|---|---|---|---|
| Base | 0.08 | 1.50 | 0.05 | <0.003 | <0.003 | <0.002 | 0.0009 | <0.002 | Bal. | / |
| 0.1 V | 0.08 | 1.51 | 0.05 | 0.10 | <0.003 | <0.002 | 0.0007 | <0.002 | 1069 | |
| 0.4 V | 0.07 | 1.49 | 0.05 | 0.43 | <0.003 | <0.002 | 0.0010 | <0.002 | 1170 | |
| 0.1 Nb | 0.08 | 1.50 | 0.05 | <0.003 | 0.10 | <0.002 | 0.0008 | <0.002 | 1459 | |
| 0.1 Ti | 0.07 | 1.50 | 0.05 | <0.003 | <0.003 | 0.09 | 0.0008 | <0.002 | 1441 |
The specimens for heat treatments with the dimensions of 5 mm × 5 mm × 3 mm were cut out from the alloys after homogenization at 1423 K for 345.6 ks. Afterwards, the specimens were austenitized at 1473 K or 1523 K (above the solution temperature of MC) for 0.6 ks, and immediately quenched into water to obtain as-quenched martensitic structure. Then, tempering treatment was performed at various temperatures (623 K–923 K) lower than A1 (973 K) for various times (60 s–43.2 ks). To eliminate the influence of decarburization during heat treatments, the as-quenched and tempered specimens were mechanically polished with emery papers (#220–#1500), diamond slurry (3 and 1 μm) and colloidal silica suspension to obtain the mirror surface. The hardness of each specimen was measured by using micro Vickers hardness testing machine (Matsuzawa AMT-X7AFS). After 12 measurements under the load of 9.8 N (1000 gf) with an inter-point distance of 500 μm, average hardness excluding the maximum and minimum values was used.
The polished specimens were then etched with a 3% nital solution, whose microstructure was observed by using scanning electron microscopy (SEM: JSM-7001F). In addition, the specimens electro-polished in an ethanol solution containing 6% perchloric acid with a voltage of 25 V were measured by electron backscatter diffraction (EBSD) under the condition of 25 kV for accelerating voltage, 10 nA for current, 0.5 μm for step size, respectively. From the obtained grain boundary map, the grain size defined as the average intercept length of the boundaries with misorientation larger than 2° was measured following the previous work.20)
In order to quantitatively evaluate the dispersion of nano-sized alloy carbide, the needle-shaped specimens were cut out from the polished surface by using focused ion beam (FIB: FEI QUANTA 3D) for three-dimensional atom probe (3DAP: CAMECA LEAP-4000HR) analysis in the voltage pulse mode. The measurements were carried out under the condition of a pulse fraction of 20%, a pulse rate of 200 kHz, a specimen temperature of 50 K. The obtained data was analyzed following our previous report, where the solute enriched regions containing more than 10 M atoms (since the detection efficiency of atom probe is ~37%, actually 27 M atoms are contained with a radius of ~0.5 nm under the assumption of spherical shape) were taken to be the precipitated MC alloy carbide.21) On the other hand, the dislocation density in each specimen, after electro-polishing to remove the strain, was measured by using X-ray diffractometer (XRD: Bruker D8 ADVANCE). Cu target (Kα1 wavelength = 0.15406 nm) was used to measure the line profile with the diffraction angle (2θ) from 35° to 125°, a step size of 0.01°, a tube voltage of 40 kV and a current of 35 mA, respectively. The dislocation density was estimated through analyzing 5 bcc diffraction peaks, i.e., 011, 002, 112, 022 and 113, based on the modified Warren-Averbach method.22)
Figure 1 shows the variations in hardness of each alloy with tempering time at different temperatures. The hardness in as-quenched (As Q.) condition is ~370 HV, with negligible difference among different alloys. The hardness of the Base alloy is monotonously decreased by tempering, while the softening rate becomes higher at high temperature. With the microalloying additions of V, Nb and Ti, although the alloying effects are small at low temperature of 623 K (Fig. 1(a)), relatively higher hardness than the Base alloy can be obtained at temperatures higher than 723 K (Figs. 1(b)–1(d)). Such a resistance tends to be larger at higher tempering temperature and longer tempering time. Moreover, secondary hardening occurs in the 0.4 V, 0.1 Nb and 0.1 Ti alloys tempered at 923 K for 0.3 ks (Fig. 1(d)).

Hardness variations of various alloys tempered at (a) 623 K, (b) 723 K, (c) 823 K and (d) 923 K for various times. (Online version in color.)
Figures 2(a) and 2(b) (Graphical abstract) plot the hardness of the tempered alloys and the hardness increment from that of the Base alloy (ΔHV) against the tempering parameter with taking the bulk C content into account23)
| (1) |

Variations in (a) hardness and (b) hardness increment from Base alloy with tempering parameter. (Online version in color.)
The results of microstructural observation and quantitative evaluation will be introduced in this section. Figure 3 shows the SEM images of the Base alloy, and also the 0.4 V alloy which has the largest alloying effect as mentioned above. Both alloys in as-quenched condition represent lath martensitic structure (Figs. 3(a), 3(b)). After tempering at relatively lower temperature of 723 K for 0.3 ks, submicron-sized cementite is precipitated in the Base alloy (Fig. 3(c)). There is no evident difference in the dispersion of cementite by 0.4 V addition (Fig. 3(d)). After tempering at relatively higher temperature of 923 K for 0.3 ks, lath structure still remains and can be easily identified in both alloys. Cementite becomes coarsened in the Base alloy (Fig. 3(e)), but its volume fraction appears to be reduced in the 0.4 V alloy (Fig. 3(f)). It was also confirmed that the dispersion of cementite in the 0.1 V, 0.1 Nb and 0.1 Ti alloys is intermediate between those in the Base and 0.4 V alloys. Figure 4 shows the grain boundary maps of the Base and 0.4 V alloys, respectively. In as-quenched condition, both alloys have typical martensitic structures24) with a mixture of low-angle and high-angle grain boundaries (Figs. 4(a), 4(b)). Even after tempering at 923 K for 0.3 ks, the average intercept length remains almost unchanged with the experimental error taken into account (Figs. 4(c), 4(d)).

SEM images of (a)(c)(e) Base alloy and (b)(d)(f) 0.4 V alloy, respectively. (a)(b) as-quenched, (c)(d) tempered at 723 K for 0.3 ks and (e)(f) tempered at 923 K for 0.3 ks. θ : cementite.

Grain boundary maps of (a)(c) Base alloy and (b)(d) 0.4 V alloy, respectively. (a)(b) as-quenched, (c)(d) tempered at 923 K for 0.3 ks. d: average grain intercept length. (Online version in color.)
Figure 5 shows the typical atom maps of carbide-forming element M and C in various alloys obtained by 3DAP measurements. After tempering at 723 K for 0.3 ks, M and C atoms in various alloys appear to be homogeneously distributed without any enrichment in local regions (Figs. 5(a)–5(d)). In contrast, local enrichment of M and C can be clearly seen in the alloys tempered at 923 K for 0.3 ks, indicating the nano-precipitation of MC alloy carbide. In the 0.4 V alloy, carbide precipitates are aligned along line features (Fig. 5(f)), presumably on dislocations as previously reported.13) In other alloys (Figs. 5(e), 5(g), 5(h)), it is highly possible that the observed precipitates are formed on dislocations as well due to the lower energy barrier for precipitation. After analyzing 3DAP data, the dispersion of MC precipitates in terms of number density and radius is quantified and shown in Figs. 6(a) and 6(b), respectively, with the assumption of spherical particle shape based on the method in our previous report.25) MC precipitates were not detected in various alloys tempered at 723 K except for the 0.4 V alloy containing a low number density of MC. In contrast, MC is precipitated in all the alloys tempered at 923 K, and the number density becomes higher by increasing the V content. Compared at almost the same amount of addition, the number density in the 0.1 Ti alloy is significantly higher than that in the 0.1 V alloy, and similar to that in the 0.1 Nb alloy (Fig. 6(a)), while the size of MC becomes larger with the increment in V content and tempering temperature, and NbC and TiC are formed in slightly finer size than VC (Fig. 6(b)). Thus, larger precipitation strengthening is expected at higher tempering temperature, with larger amount of alloy addition, and with Nb or Ti addition rather than V. All of these are consistent with the magnitude in resistance to temper softening shown in Fig. 3(b).

Three-dimensional atom maps of (a) 0.1 V, (b) 0.4 V, (c) 0.1 Nb and (d) 0.1 Ti alloys tempered at 723 K for 0.3 ks; (e) 0.1 V, (f) 0.4 V, (g) 0.1 Nb and (h) 0.1 Ti alloys tempered at 923 K for 0.3 ks, respectively. (Online version in color.)

(a) Number density and (b) average radius of MC precipitates formed in various tempered alloys. (Online version in color.)
Frequency distribution analysis26) was further performed to examine solute clustering during tempering. In this analysis, the measured 3DAP dataset was divided into blocks with a certain size (e.g. containing 100 ions in this study). The frequency of subjected solute concentration in each block is compared with binomial distribution (completely random distribution), and the deviation is evaluated by Pearson coefficient (μ). μ value becomes 0 when solute atom distribution is completely random, whereas varies asymptotically to 1 with the increasing degree of inhomogeneity. Figure 7(a) shows the analysis result of V atoms in the 0.4 V alloy as an example. The measured data of the specimen tempered at 723 K shown in staircase shape is almost consistent with the binomial distribution, with a small μ value of 0.03. In contrast, in the specimen tempered at 923 K with the precipitation of VC, a large number of blocks with high V content exist, corresponding to a μ value increased to 0.65. Figure 7(b) shows the result of solute M atoms in the martensitic matrix in various tempered alloys after removing MC precipitates from the dataset. The μ value in all the cases is extremely small, but slightly larger than that in the as-quenched (As Q.) condition. This implies the existence of inhomogeneity in the distribution of M atoms corresponding to the formation of atomic-scale cluster, which cannot be detected by normal analysis.

(a) Frequency distribution of V content in blocks containing 100 ions in 0.4 V alloy tempered at different temperatures. (b) Deviation in distribution of M atoms from random distribution (μ value) in various tempered alloys. Data of 923 K in (b) correspond to martensitic matrix without MC precipitates. (Online version in color.)
In addition to precipitation of nano-sized alloy carbide and formation of cluster, variations in dislocation density should also occur during tempering process. Figure 8 shows the line profiles in the vicinity of 110bcc diffraction peak obtained by XRD measurements. During tempering at 723 K, the diffraction peak in the as-quenched Base alloy becomes sharpened gradually with time due to the recovery of dislocations (Fig. 8(a)), and the peak width in the 0.4 V alloy is comparatively broader than that in the Base alloy after tempering under the same condition (Fig. 8(b)). Figure 9 shows the dislocation density evaluated through analyzing various diffraction peaks based on modified Warren-Averbach method. It can be seen that the microalloying does not affect the dislocation density in as-quenched condition. However, after tempering at 723 K, different from the monotonous reduction in dislocation density with time in the Base alloy, such a reduction is suppressed in the alloys with either of the microalloyed elements (Fig. 9(a)), and this suppression tends to be larger at longer holding time. At relatively higher temperature of 923 K, more prominent suppression occurs by microalloying and a high dislocation density can be observed even after prolonged tempering (Fig. 9(b)). The suppression effects on dislocation recovery does not vary much among different elements at 723 K, whereas Nb and Ti additions appear to have larger effects than V at 923 K. These results indicate that in addition to the precipitation strengthening of nano-sized alloy carbide, the suppression of recovery by microalloying also contributes to the resistance to temper softening.

XRD line profiles in the vicinity of 110bcc diffraction peak of (a) Base alloy in as-quenched and tempered conditions, (b) Base and 0.4 V alloys tempered at 723 K for 0.3 ks.

Variations in dislocation density in various alloys with tempering time at (a) 723 K and (b) 923 K, respectively. (Online version in color.)
The resistance to temper softening by microalloying of V, Nb and Ti was clearly seen through hardness measurements in this study. Based on the quantitative evaluation of microstructural evolutions mentioned in the preceding section, the mechanism of resistance to temper softening will be discussed in the following.
The strength of metallic materials is generally determined by the strengthening originating from solute elements, grain boundaries, precipitates and dislocations, which act as obstacles to dislocation movement.27) Our group recently studied the ferrite/bainite in microalloyed steels strengthened by VC precipitation and reported that the yield strength becomes overestimated by simply adding the amounts by various strengthening factors, whereas shows good agreement with that estimated from the combined strengthening of precipitates and dislocations as shown in the following equation.20)
| (2) |
Regarding the solid solution strengthening, the supersaturation of solute C atoms in as-quenched martensite becomes gradually decreased with the precipitation of cementite by tempering.29) At the same temperature, it was confirmed by Thermo-Calc® that the solubility limit of cementite in ferrite is almost unchanged by the microalloying additions of V, Nb and Ti. As for the microalloying elements in this study, even if all of them are in solid solution without the precipitation of MC, the strengthening can be roughly estimated to be < 3 HV according to the report by Takeuchi,30) which does not contribute to the resistance to temper softening. EBSD grain boundary maps in Fig. 4 reveal small difference in grain size among various alloys, whose contribution to resistance is also limited. Furthermore, the size of cementite can be estimated to be ~100 nm from SEM images in Fig. 3. Even with the volume fraction in equilibrium (~1.2%), its precipitation strengthening by Orowan model31) is estimated to be only ~13 HV. Therefore, the difference in distribution of cementite among various alloys should not be the main cause of resistance to temper softening.
Multiple research groups including the present authors’ have recently reported that the amount of precipitation strengthening of nano-sized MC alloy carbide can be predicted by Ashby-Orowan model.20,32,33,34) In this study, the dispersion of MC was quantified by using 3DAP, and the strengthening amount can thus be estimated by Ashby-Orowan model using the following equations.31)
| (3) |
| (4) |
| (5) |

Comparison of hardness increment from Base alloy (a) with precipitation strengthening predicted by Ashby-Orowan model, and (b) with dislocation strengthening predicted by Bailey-Hirsch model. (Online version in color.)
The dislocation strengthening is generally estimated by using the Bailey-Hirsch equation as follows.
| (6) |
By using Eq. (2), the combined strengthening of precipitates and dislocations under various tempering conditions is compared with experimentally measured resistance to temper softening in Table 2. The overall trend is that the resistance to temper softening at 723 K by microalloying additions can be mainly explained by dislocation strengthening. In the 0.4 V alloy, precipitation strengthening also has some contribution. This is also true in the 0.1 V, 0.1 Nb and 0.1 Ti alloys after prolonged tempering. As for 923 K, it can be clearly seen that the resistance to temper softening is dominated by precipitation strengthening from the early stage of tempering.
| Tempering condition | Alloy | ΔHV, ppt | ΔHV, dis | (ΔHV, ppt2 + ΔHV, dis2)1/2 | ΔHV, exp | Notes |
|---|---|---|---|---|---|---|
| 723 K, 0.3 ks | 0.1 V | 0 | 10 | 10 | 17 ± 7 | Dominated by ΔHV, dis except for 0.4 V alloy |
| 0.4 V | 21 | 24 | 32 | 43 ± 5 | ||
| 0.1 Nb | 0 | 15 | 15 | 17 ± 8 | ||
| 0.1 Ti | 0 | 25 | 25 | 16 ± 6 | ||
| 723 K, 43.2 ks | 0.1 V | – | 41 | ≧ 41 | 45 ± 3 | |
| 0.4 V | – | 51 | ≧ 51 | 72 ± 6 | ||
| 0.1 Nb | – | 47 | ≧ 47 | 44 ± 4 | ||
| 0.1 Ti | – | 48 | ≧ 48 | 45 ± 4 | ||
| 923 K, 0.3 ks | 0.1 V | 41 | – | ≧ 41 | 51 ± 3 | Dominated by ΔHV, ppt |
| 0.4 V | 178 | 37 | 182 | 148 ± 3 | ||
| 0.1 Nb | 78 | – | ≧ 78 | 99 ± 3 | ||
| 0.1 Ti | 121 | – | ≧ 121 | 107 ± 3 |
–: not measured; ΔHV, exp: experimentally measured hardness increment from Base alloy; ΔHV, ppt: hardness increment estimated from dispersion of MC precipitates; ΔHV, dis: hardness increment estimated from difference in dislocation density.
The magnitude of resistance to temper softening by microalloying additions in this study is in the order as: 0.4 V > 0.1 Nb ≈ 0.1 Ti > 0.1 V. This should be due to the fact that at 923 K where precipitation strengthening dominates, higher density of VC is precipitated at by increasing the amount of V addition from 0.1 to 0.4. Moreover, compared at similar amount of addition with the 0.1 V alloy, finer MC is precipitated in the 0.1 Nb and 0.1 Ti alloys, implying that alloy carbide is more easily nucleated. Generally, the nucleation in precipitation reactions is strongly dependent on the degree of supersaturation in matrix. The driving force for MC precipitation in various alloys is thus calculated through Thermo-Calc®, using the following equation proposed in our previous report.37)
| (7) |
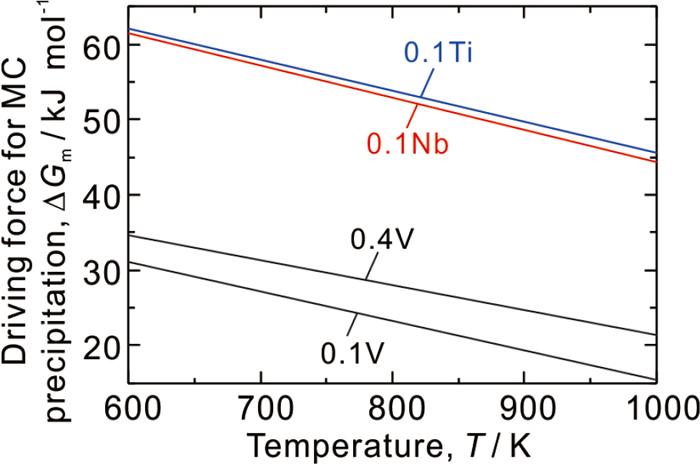
Calculated driving force for MC precipitation from martensite with cementite in paraequilibrium, in various alloys tempered at different temperatures. (Online version in color.)
On the other hand, although Fig. 11 shows that the driving force for MC precipitation becomes larger at lower temperature, MC precipitation was not detected in the specimens tempered at 723 K for 0.3 ks. This should be caused by the tardy precipitation kinetics at lower temperature, which is controlled by the diffusion of carbide-forming elements. Although it was reported that dislocation pipe diffusion also works in the case of MC precipitation during tempering,39) if the volume diffusivity in ferrite40) is simply assumed, the diffusion distance of carbide-forming elements in tempering at 923 K for 0.3 ks is estimated to be ~100 nm, while that at 723 K for 0.3 ks is only ~1 nm which is insufficient for MC precipitation. Undoubtedly, when the tempering time becomes longer, MC precipitation will occur and contribute to the resistance to temper softening eventually.
XRD results clearly reveal that V, Nb and Ti atoms in solution or as clusters suppress the reduction in dislocation density during tempering at low temperature or for short time. C atoms in tempered martensite are known to be segregated at grain boundary or dislocation.29) When strong carbide-forming elements, i.e. V, Nb and Ti, are added, attractive M-C interaction41) might give rise to their co-segregation at dislocation42) or formation of M-C dipole,43,44) triggering some synergic effects on strain aging and dislocation recovery behaviors. This point has not been confirmed by experiments in this study, which still needs to be investigated in detail in the future.
In this study, the origin of resistance to temper softening in low carbon martensitic steels by microalloying of V, Nb and Ti was investigated. The conclusions can be drawn as follows.
(1) Low carbon martensite becomes monotonously softened by tempering, while the resistance to temper softening occurs by small additions of V, Nb and Ti, whose alloying effects are larger at higher temperature with longer time.
(2) Precipitation of nano-sized MC alloy carbide occurs by tempering at high temperature. More MC precipitates are formed with increased V content, while NbC and TiC are more finely dispersed than VC when compared at the same amount of addition.
(3) The resistance to temper softening by microalloying additions is dominated by precipitation strengthening of MC at higher temperature, and by suppression of dislocation recovery at lower temperature.
This work was financially supported by CREST Basic Research Program entitled “Creation of Innovative Functions of Intelligent Materials on the Basis of Element Strategy” (2011–2016) funded by Japan Science and Technology Agency, and Grant-in-Aid for Scientific Research (A) No. 17H01330 (2017–2019) funded by Japan Society for the Promotion of Science. The authors also acknowledge the Iron and Steel Institute of Japan for Research Promotion Grant (2019–2020).