Abstract
Cokes play an important role in the blast furnace as a spacer for maintaining gas permeability. Since blast furnaces with large inner volumes exceeding 5000 m3 are now common in Japan, use of high strength coke has become a crucial issue for modern blast furnaces. However, general methods for evaluating coke strength, for example, the drum test, are insufficient for understanding the breakage behavior of coke in detail. In order to evaluate the coke breakage behavior in blast furnaces, a coke breakage model based on the discrete element method (DEM) with cluster particles and parallel bonds was developed.
According to experiments using the indirect tensile test, the tensile strength of cokes shows a wide distribution because of the randomness of the pore arrangement. Therefore, a DEM simulation model for coke breakage was developed considering pores with random positions. DEM simulations of the indirect tensile test were conducted for 10 cases of random pore arrangements for each of Coke A (small porosity) and Coke B (large porosity). The tensile strength obtained from the experiments and DEM simulations was compared by a Weibull analysis. The simulation results were in agreement with the experimental results including the distribution of coke strength. Finally, the probability distributions of coke breakage obtained from the Weibull analysis were applied to the DEM simulation result of the material flow in a 5000 m3 blast furnace, and the percentage of coke breakage in the deadman region of the blast furnace was evaluated for Coke A and Coke B.
1. Introduction
The permeability of a blast furnace is an important factor for stable operation since the blast furnace is a counter-current packed bed reactor. In the blast furnace as a packed bed, coke particles play a role as spacers which maintain gas permeability and support the load of the burden materials. On the other hand, ore particles cannot play a role as spacers in the lower part of the blast furnace because ore softens and melts as it descends through the blast furnace. For this reason, coke is required to maintain the packed bed structure throughout the blast furnace.
Over the past few decades, steel companies in Japan have increased productivity by expanding the internal volume of blast furnaces with the aim of improving economic competitiveness. At present, half of the blast furnaces in Japan are large blast furnaces with internal volume exceeding 5000 m3. However, high quality raw materials, especially high strength coke, have been required as the internal volume of the blast furnace has increased. At the same time, pulverized coal injection from the blast furnace tuyeres has also been widely adopted in recent years. Therefore, it is also essential to design coke properties suitable for ensuring gas permeability under low coke ratio operation. Against this background, it is necessary to understand the behavior of coke particles in the blast furnace from the viewpoint of mechanics among coke particles.
The coke strength indices of drum index (DI), tumbler index (TI) and coke strength after reaction (CSR) are commonly used to manage coke quality for stable blast furnace operation. These strength indices are associated, respectively, with degradation due to impact force,1,2) degradation due to stress in the packed bed3) and degradation due to gasification4,5) in the blast furnace. Although these are clear and easy-to-use indices for managing actual blast furnace operation, they do not directly represent actual physical phenomena such as coke crushing under compressive stress in the blast furnace. Therefore, new approaches for evaluating coke strength that are consistent with the actual mechanical phenomena in blast furnaces are needed.
In recent years, the Discrete Element Method (DEM) has been applied to the analysis of the particle flow, stress distribution and particle tracking of charged raw materials in blast furnaces.6,7,8) DEM is a numerical simulation method in which the translational and rotational motions of all particles are directly calculated based on the physical interaction forces between particles, such as the compressive/shear forces and rolling friction forces acting on the particles, and is an excellent analysis method for simulating complicated mechanical phenomena of multi-particle systems. Numerical simulation of the plastic deformation of particles in a packed bed has also been reported as an extension technology of DEM.9) Moreover, numerical simulation of brittle fracture phenomena is also possible by modeling brittle materials as a large number of pseudo-particle assemblies,10,11) and this numerical simulation method can be applied to the analysis of the brittle fracture phenomena of coke particles under the burden load in the blast furnace. For example, Kim et al. performed a numerical simulation of the fracture behavior of cylindrical coke test pieces using a DEM model with pseudo-particle aggregates, and clarified the effects of pore size and anisotropic pore shape on coke strength.12,13)
On the other hand, it is known that the fracture behavior of individual coke particles differs even in samples made of the same material because coke is a brittle material. Although Kim et al. confirmed the agreement of the coke breakage phenomena in the experimental results and DEM simulation results by comparing representative cases,12) the strength distribution of coke breakage has not been studied. Since the coke particles in a blast furnace break in order from the lower end of the strength distribution, a DEM model of coke breakage considering the coke strength distribution is required in order to evaluate coke breakage behavior in blast furnaces.
In this paper, indirect tensile tests of sample cokes were carried out to clarify the fundamental fracture characteristics of cokes. Next, a DEM model of a coke test piece considering the pore structure was constructed based on the results of the indirect tensile tests and microscopic observation of the pores in coke. A numerical simulation of the indirect tensile test was then carried out, and the results were compared with the experimental results including the dispersion of the coke strength distribution. Finally, the probability of coke breakage in the blast furnace was estimated by combining the coke strength distribution obtained in this study and a DEM simulation of the burden material flow in an actual 5000 m3 blast furnace.
2. Measurement of Coke Strength by Indirect Tensile Test
In general, a test piece of a certain length is necessary in order to measure the tensile strength of materials such as steel. However, it is difficult to prepare a large number of coke samples with a shape suitable for tensile testing because coke is a granular material with a size of several tens of mm. Therefore, the tensile strength of the coke samples was measured by an indirect tensile test which is normally used to measure the tensile strength of brittle materials such as concrete. The experimental method of the indirect tensile test is described below.
2.1. Experimental Method
A schematic diagram of the indirect tensile test is shown in Fig. 1. A coke test piece having a cylindrical shape is cut out and a load is applied in the diameter direction of the cylinder. Then, a uniform tensile stress is generated in the section on the compression axis, as shown in Fig. 1. The stress distribution of the brittle coke is similar to that of an elastic material in the condition of small deformation before fracture. Therefore, the tensile stress acting on this section on the compression axis is calculated by the following equation.14)
In
Eq. (1),
σ is the tensile stress of the test piece,
P is the compressive load and
d and
l are the diameter and height of the cylindrical test piece, respectively. When the compressive load is gradually increased, the cylindrical test piece eventually breaks at the cross section of the compression axis. The tensile strength of the test piece can be calculated from the compressive load
P at the moment of breakage and
Eq. (1).

The tensile strength of homogeneous materials is independent of the size of the test piece. However, the tensile strength of coke varies depending on the size of the cylindrical test piece because coke is a porous brittle material, and pores and cracks in the coke cause stress concentrations. Sakai et al. classified coke structures as “centimeter structure (macro-structure),” “millimeter structure (meso-structure)” and “micro/nano-structure” according to the maximum crack size in the coke structure, and estimated the mechanical strength of each structure.15) This result is in good agreement with the characteristic that the strength of coke decreases as the size of the coke increases. Sakai et al. also suggested that the structural scale of lump coke in the blast furnace is the “millimeter structure,” which plays an essential role in blast furnace operation. Therefore, in this study, coke test pieces with a millimeter structure (test piece size on the order of 10 mm and average internal crack size of 0.5 to 1.0 mm) were prepared to correspond to the coke breakage behavior in the blast furnace.
In this study, the two kinds of coal shown in Table 1 were selected, and two kinds of sample coke, Coke A and Coke B, were prepared by carbonization. In carbonization, the coal was charged into a carbonization furnace at 750°C, after which the furnace temperature was raised to 1100°C over a period of 18 h and held for 2 h, and then the coke was discharged. In Table 1, Ro is the mean maximum reflectance of vitrinite in oil, MF is the maximum fluidity measured with a Gieseler plastometer and VM is the percentage of volatile matter. The coals for Coke A and Coke B were selected in order to show the relationship between the coke structure and coke breakage behavior clearly. A high quality coal suitable for dense, high-strength coke was selected for Coke A, and a slightly low quality coal that easily generates pores and lowers coke strength was selected for Coke B. The prepared sample cokes were filled with resin, polished, and observed using a microscope. The observed micrographs of the sample cokes are shown in Fig. 2. Coke A has small pores and low porosity, whereas Coke B has coarse pores and high porosity. In order to quantify the pore structures of the two cokes, the area ratio and mean diameter of pores were calculated from the micrographs of the two coke samples in Fig. 2. The pore area ratio and mean pore diameter of Coke A and Coke B are shown in Table 2. Pores with a diameter of 0.5 mm or more were used for the calculation of the area ratio and mean diameter of pores because the millimeter structures in the coke have a large effect on the coke breakage behavior in the blast furnace.
Table 1. Properties of coals for coke samples.
| Ro (%) | logMF (log(ddpm)) | VM (d.b.mass%) |
|---|
| Coal A | 1.05 | 2.079 | 24.3 |
| Coal B | 0.73 | 3.802 | 36.0 |
Table 2. Pore area ratio and diameter of coke samples.
| Area ratio of pore (%) | Equivalent pore diameter (mm) |
|---|
| Coke A | 19.3 | 0.64 |
| Coke B | 33.5 | 1.00 |
Cylindrical test pieces of these two kinds of sample coke having a diameter of 10 mm and height of 6 mm were prepared as test pieces for the indirect tensile test. In order to evaluate the distribution of tensile strength, 20 cylindrical test pieces were cut out from each of the Coke A and Coke B samples. In this experiment, an AUTOGRAPH AGS-H material testing machine was used. A pressing speed of 0.016 mm/s was applied in the indirect tensile test.
2.2. Experimental Results
The relationship between tensile stress and strain on the coke test pieces was obtained using the load and displacement data obtained by the indirect tensile test. The tensile stress applied to the coke test pieces was calculated using Eq. (1). The strain was calculated as [depression displacement of coke specimen]/[diameter of coke specimen].
Figure 3 shows three representative cases extracted from the datasets of stress-strain curves of Coke A and Coke B. In all cases, tensile stress increases as compressive strain increases, and then tensile stress rapidly decreases when the test piece breaks. Detailed observation during the indirect tensile test revealed that the test pieces broke when the tensile stress dropped sharply for the first time. The subsequent increase in tensile stress is thought to be caused by further compression of the broken test pieces. Therefore, this study provided that the test piece broke at the point when the tensile stress suddenly decreased by 0.1 MPa or more, as shown by the arrows in Fig. 3. The tensile strength of the coke test piece was defined by the tensile stress at the time of breakage.
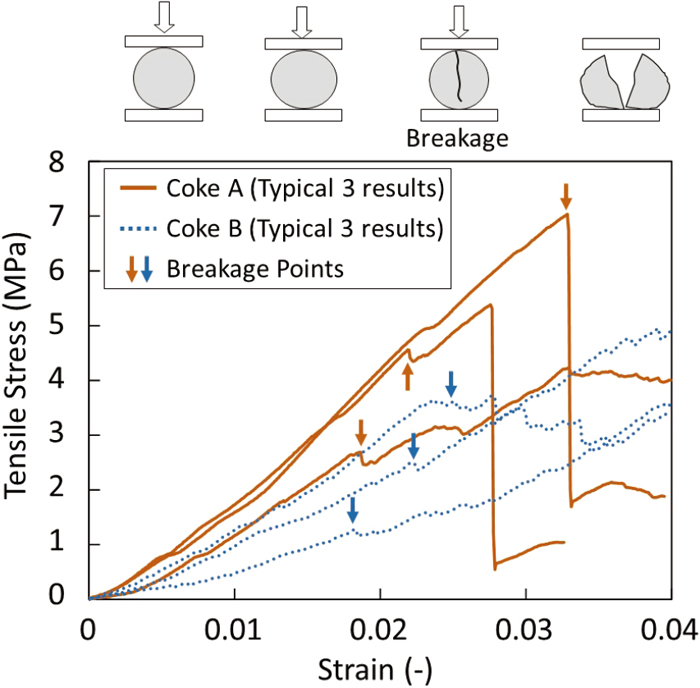
A comparison of the tensile stress-strain curves of 20 test pieces of each of Coke A and Coke B confirmed that the tensile stress-strain curves and the tensile strength values were different for each test piece, even with test pieces from the same coke sample. On the other hand, there is clearly a difference between the stress-strain curves of Coke A and Coke B. The slope of the tensile stress-strain curve before the breakage point means the stiffness of the coke test pieces. From the stress-strain curves, it was found that the stiffness of Coke A is larger than Coke B, and it was also found that the tensile strength of Coke A is higher than that of Coke B.
Next, the distribution of tensile strength for Coke A and Coke B is shown in Fig. 4 as a histogram in order to compare the variation of tensile strength. There is a clear difference in the tensile strength distributions of Coke A and Coke B. Large variations can be observed in the tensile strength distributions of both Coke A and Coke B, but there is also a clear difference in the tensile strength distributions of the two cokes. Comparing the mode of tensile strength of Coke A and Coke B, the mode of tensile strength of Coke A is higher than that of Coke B. Because coke breakage starts from coarse pores, the higher mode of tensile strength of Coke A is considered to be due to its characteristics of a small pore area ratio and small pore size.

In addition, the tensile strength of both Coke A and Coke B varies significantly, reaching a range of about three times the mode of tensile strength. The pores of the coke become starting points of breakage because coke is a porous body. However, even in test pieces from the same coke sample, the arrangement of pores is different in each test piece. It is presumed that this randomness of the pore arrangement of coke causes variations in tensile strength.
3. Numerical Simulation of Coke Breakage Behavior using DEM
The experimental results in the previous chapter confirmed that cokes with different average pore sizes and porosities also have different tensile strengths. Furthermore, it was found that the tensile strength of the test pieces varied from test piece to test piece, even though the test pieces were cut from the same coke sample. In this chapter, a numerical simulation model of coke breakage using DEM was developed, and a numerical simulation was carried out under the conditions of the indirect tensile test in order to clarify the effect of the pore structure of coke on the coke tensile strength distribution.
3.1. Coke Breakage Model using DEM
An extended DEM using pseudo-particle aggregates connected by cylindrical elastic bodies (parallel bonds)10) was used to simulate the breakage behavior of the bulk material. The schematic image of the material breakage model using parallel bonds is shown in Fig. 5.
At first, no load is applied to the bulk material, and all the contact points between the pseudo-particles are connected by parallel bonds. When an external force is applied to the bulk material, the pseudo-particles move, and compressive force
(
F
pb
n
)
, shear force
(
F
pb
s
)
, bending moment (Ms) and torsion moment (Mn) act on the parallel bonds because the parallel bonds are connected to the moving particles. The maximum tensile stress σp and maximum shear stress τp generated in a parallel bond are expressed by the following equation according to the theory of cylindrical beam stress.
|
σ
p
=
-
F
pb
n
A
+
|
M
s
|R
I
| (2) |
|
τ
p
=
F
pb
s
A
+
|
M
n
|R
J
| (3) |
where,
R is the radius of the parallel bond,
A is the cross-sectional area of the parallel bond,
I is the moment of inertia of the parallel bond and
J is the polar moment of inertia of area of the parallel bond. These values can be calculated from the parallel bond radius
R using the equations shown in
Table 3. A parallel bond breaks when the maximum tensile stress acting on the parallel bond exceeds the tensile strength of the parallel bond (
σp ≥
σc), or when the maximum shear stress exceeds the shear strength (
τp ≥
τc). As the number of broken parallel bonds increases, the cracks in the bulk material develop and reach the condition of breakage of the bulk material. A Voigt model with a linear spring and a dashpot was used to model the collision of pseudo-particles. The pseudo-particle size must be small enough to construct the major pore structure of coke, but the calculation load may increase significantly if the pseudo-particle size is too small. In this study, the pseudo-particle size was determined to be 0.5 mm because the dominant pore size for coke breakage in the blast furnace is about 0.5–1.0 mm. Since there is no clear restriction on the parallel bond diameter, the parallel bond diameter was determined to be 0.5 mm, which was the same as the pseudo-particle diameter, and the stiffness and strength of the parallel bonds were adjusted to agree with the experimental results. The coke test pieces were modeled with approximately 3000 pseudo-particle assemblies.
Table 3. Calculation parameters for DEM simulation.
| Particles | Number | 2833–3610 |
| Radius [m] | 0.25 × 10⁻³ |
| Density [kg/m3] | 1500 |
| Normal stiffness [N/m] | 1.6 × 10⁶ |
| Shear stiffness [N/m] | 1.6 × 10⁶ |
| Friction coefficient | 1.0 |
| Damping Coefficient | 0.7 |
| Parallel bonds | Normal stiffness [(N/m)/m2] | 4.1 × 10¹² |
| Shear stiffness [(N/m)/m2] | 4.1 × 10¹² |
| Tensile strength, σc [Pa] | 36 × 106 |
| Shear strength, τc [Pa] | 36 × 106 |
| Radius, R [m] | 0.25 × 10⁻³ |
| Area, A [m2] | πR2 |
| Moment of inertia of area, I [m4] | πR4/4 |
| Polar moment of inertia of area, J [m4] | πR4/2 |
| Time step [s] | 4.5 × 10⁻⁸ |
Next, the concept of modeling the pore structure will be described. Kim et al.12) proposed a modeling method for the coke pore structure in which dummy particles of the same size as the pores are mixed in the pseudo-particles and are filled in the shape of the test piece. After filling, the dummy particles are removed to create voids simulating coke pores. However, in this method, the arrangement of the pseudo-particles constituting the coke substrate structure also changes when the pore arrangement changes. Since the breakage behavior of the pseudo-particle aggregate is affected by the arrangement of the pseudo-particles, this approach is not suitable for a precise investigation of the effect of the pore structure. Therefore, the following new method for modeling the pore structure is proposed in the present study.
A schematic diagram of the modeling of the pore structure in this study is shown in Fig. 6. First, the pseudo-particles are filled by their own weight to form the same cylindrical pseudo-particle aggregate as the test piece, which corresponds to a coke test piece without pores. Then, virtual spheres simulating pores is superposed on the cylindrical pseudo-particle aggregate. The positions of the virtual spheres are determined by random numbers. Pores in the coke are reproduced by deleting the pseudo-particles overlapped with the pore spheres from the cylindrical pseudo-particle aggregate. This method makes it possible to evaluate the effect of the pore structure precisely because the pseudo-particle arrangement of the coke substrate is the same in all analysis conditions. Finally, the contact points between all the pseudo-particles were connected by parallel bonds with zero strain.
The general-purpose DEM simulation software PFC3D was used for the numerical calculations in this study.
3.2. Calculation Conditions
The calculation parameters for the DEM simulation are shown in Table 3. The parameters of the parallel bond were determined as follows using the load-displacement curves obtained in the indirect tensile test in Chapter 2.
The normal stiffness and shear stiffness of the parallel bonds were determined so that the slopes of the stress-strain curve of the numerical simulation were in agreement with that of the experimental result of Coke A at the time before breakage. The data with the highest tensile strength were used for each of the experimental results and the numerical simulation results in order to compare the stress-strain curves before breakage precisely. The parameters of the parallel bond strength σc, τc were determined so that the average tensile strength of the numerical simulation results was in agreement with that of the experimental results of Coke A.
In this study, it was assumed that Coke A and Coke B had different porosities and average pore sizes, and the matrices had the same properties. Therefore, the parameters of the pseudo-particles and parallel bonds were the same for Coke A and Coke B. In order to reflect the difference in the pore structures of Coke A and Coke B, the diameter and total volume ratio of the virtual pore spheres were determined to correspond to the average pore diameter and pore area ratio observed with a microscope, as shown in Table 2.
As described above, it is thought that the variation in tensile strength observed in the experiment was caused by the difference in the pore arrangement of each coke test piece. Therefore, 10 cases of coke test piece models were prepared for each of Coke A and Coke B, in which the pore arrangement was changed by using random numbers, while the diameter and the total volume ratio of the virtual pore spheres were constant. Cross-sectional images of the coke test piece models are shown in Fig. 7. The pores are structured as voids of the pseudo-particles, and the models of Coke A and Coke B reflect the difference in pore diameter and total pore volume between the two cokes. Coke test piece models No. 1 to No. 10 were prepared for each of Coke A and Coke B, in which the pore arrangement was changed randomly as shown in the examples in Fig. 7. Coke test piece models could be constructed with the same pore diameter and total pore volume but different pore arrangements for each of Coke A and Coke B.

The calculation conditions of the DEM simulation of the indirect tensile test are shown in Fig. 8. The diameter and height of the cylindrical test piece were 10 mm and 6 mm, respectively. The mechanical condition of the indirect tensile test was reproduced by placing the fixed plate below the cylindrical test piece and moving the upper plate downward, as the movable plate, in the diameter direction of the cylinder. In order to reduce the calculation time, the descent speed of the moving plate was set to be 100 times that of the experiment. In addition, gravity acceleration was applied vertically downward in Fig. 8.
3.3. Results of Numerical Simulation
In this study, 10 coke test piece models were prepared for each of Coke A and Coke B, and numerical simulations of the indirect tensile test were performed. Here, three typical cases (Examples 1, 2 and 3) are extracted from the results of the numerical simulation for each of Coke A and Coke B. Figure 9 shows the tensile stress-strain curves of the typical examples. The stress-strain curves of Coke A and Coke B obtained by the numerical simulation showed the same tendency as the experimental results in Fig. 3, demonstrating that the coke test piece model in this study can accurately simulate the compression/breakage phenomena of coke. The arrows in the graph indicate the position where the tensile stress initially drops more than 0.1 MPa, where the principal parallel bonds in the coke test piece model have been broken and then the coke test piece has broken. Although the timing of coke breakage is different for each test piece, when the tensile stresses at the breakage points are compared, it is clear that Coke A has higher tensile strength than Coke B. In this calculation, the same parameters for the parallel bonds and pseudo-particles and the same pseudo-particle arrangement were used for the test piece models of Coke A and Coke B. This means the difference in tensile strength between Coke A and Coke B is caused by the effects of the difference in the pore size and porosity of the two cokes. From the above, the experimental fact that pore size and porosity have large effects on coke strength was successfully simulated by the DEM model.

Since each of the 10 cases with different pore arrangements has the same pore diameter and total pore volume, the difference of the breakage phenomena can be attributed to the difference in the pore arrangement. Thus, the numerical simulation confirmed that tensile strength varies according to the pore arrangement, even if the pore size and porosity are the same.
In all cases calculated in this study, breakage of the coke test pieces occurred with strain in the range of 0.010 to 0.025. Therefore, the crack propagation behavior of the test piece models of Coke A and Coke B was investigated in detail. Typical results for Coke A and Coke B are shown in Figs. 10 and 11, respectively. Figures 10 and 11 illustrate the state of the coke test piece model before breakage (strain = 0.010), at the breakage point (at the timing of the arrows in Fig. 9) and after breakage (strain = 0.025, 0.030) for each case. Here, a blue pseudo-particle indicates that the connected parallel bonds have not been broken, and a gray pseudo-particle indicates that one or more of the connected parallel bonds have been broken. Before breakage (strain = 0.010), almost all parts of the coke test pieces were not broken. Subsequently, at the breakage point, that is, at the point where a rapid decrease in tensile strength was observed, some parallel bonds broke at the upper and lower ends of the coke test pieces. In other words, the breakage site existed only in a part of the test piece at this timing. However, because the tensile stress decreased drastically at this timing, it is thought that the parallel bonds of the principal part supporting the structure of the coke test piece broke at this point, and breakage of the coke test piece started. Thereafter, a crack developed on the vertical line passing through the central axis as the strain of the test piece increased. At this stage, the tensile stress appears to be higher than at the breakage point, but this was caused by the further compression of the broken pieces of the coke test piece.

In Figs. 10 and 11, it was observed that 1 or 2 particles separated from the coke test piece. Qualitatively, this means the phenomenon of generation of coke fines. However, there is still a problem in the quantitative evaluation of the generation of coke fines because the pseudo-particle size is too large to simulate the behaviors of coke fine particles. If smaller pseudo-particles are used in the simulation model, it will also be possible to simulate the generation of coke fines.
4. Discussion
4.1. Discussion using Weibull Analysis
In order to quantitatively evaluate the tensile strength of the coke test pieces obtained by the experiment and DEM simulation including the tensile strength distribution, an analysis using a Weibull model was carried out. According to the theory of the Weibull model, the breakage probability F(σ) under the condition that tensile stress σ is applied to a test piece can be expressed by the following equation.
|
F(σ)=1-exp{
-
(
σ
σ
0
)
m
}
| (4) |
Here,
σ0 is a representative value of the tensile strength of the test piece, and
m is the Weibull modulus, which is a parameter indicating the relative dispersion of tensile strength from the representative value of tensile strength
σ0. When the variation in tensile strength is small, the Weibull modulus
m becomes large. In a Weibull analysis, the analysis is performed by a Weibull plot obtained by logarithmic deformation of
Eq. (4). The experimental results of the indirect tensile tests (20 samples for each of Coke A and Coke B) and the results of the DEM simulation (10 cases with random pore arrangements for each of Coke A and Coke B) are summarized by the Weibull plot in
Fig. 12. The mean-rank method was applied in order to evaluate the breakage probability from the experimental results of the indirect tensile test and the dataset of the DEM simulation. That is, the data for an experiment performed
n times are sorted in ascending order (
σ1,
σ2, …,
σN), and the breakage probability
F(
σi) when tensile stress
σi is applied to the test piece is calculated by the following equation.

In the Weibull plot, the intersection of the data plots with the x-axis is the logarithm of the representative value of tensile strength ln(σ0), and the slope of the graph is the Weibull modulus m. From the Weibull plot of the experimental results, the representative values of the tensile strength σ0 of Coke A and Coke B were found to be 5.5 MPa and 3.1 MPa, respectively, and the Weibull moduli m were 2.7 and 2.0, respectively. However, the Weibull plot obtained by the DEM simulation shows that the representative values of tensile strength σ0 are 4.7 MPa and 1.9 MPa, respectively, and the Weibull moduli m were 5.6 and 4.5, respectively. Comparing the experimental results with the DEM simulation results, the representative value of the tensile strength σ0 of Coke A was larger than that of Coke B, and it was also found that the Weibull modulus m of Coke A was larger than that of Coke B. This means that the relative dispersion of the tensile strength of Coke A was smaller than that of Coke B. The coke breakage model in this study successfully simulated the same tendency as the experimental results of the coke breakage behavior including the dispersion of tensile strength. However, the results of the DEM simulation showed larger Weibull modulus values than the experimental results; i.e., the variation in tensile strength in the DEM simulation results was smaller than that in the experimental results. These differences are considered to be due to the assumptions of the DEM simulation model, namely, that the pores are of uniform size and spherical shape and the strength of the substrate is constant. Further development will be needed to improve the accuracy of the DEM model by reflecting the detailed pore structure, such as the pore size distribution and pore shape, in the DEM model. Information concerning the substrate strength, which is related to the properties of the coal, will be also effective for improving the accuracy of the DEM model, where the hardness test proposed by Uebo et al.16) is considered to be appropriate for estimating the substrate strength.
4.2. Evaluation of Percentage of Coke Breakage in Blast Furnace
The ratio of coke breakage in a blast furnace was estimated using the above results. Using the parameters σ0 and m of Coke A and Coke B obtained by the Weibull analysis, the breakage probability F(σ) of each coke can be obtained by substituting these parameters into Eq. (4). Figure 13 shows the relationship between the tensile stress applied to Coke A and Coke B and the breakage probability F(σ). Coke A shows a lower breakage probability than Coke B in all tensile stress ranges. It was also found that the breakage probabilities of both Coke A and Coke B increase as the compressive load increases. When a tensile stress of 5 MPa is applied to the coke samples, the breakage rates of Coke A and Coke B are 54% and 94%, respectively.

The burden load on the packed coke particles in the blast furnace can be calculated by another type of DEM simulation which can calculate the flow of the burden material particles in the entire blast furnace. However, we confirmed that the stress distribution in the blast furnace is discontinuous and a large burden load is applied to a particular few coke particles.6) Therefore, in order to evaluate the coke breakage in the blast furnace precisely, it is necessary to consider not only the breakage probability of the coke, but also the frequency distribution of the compressive stress on the individual coke particles in the blast furnace. In this study, the coke breakage behavior in the blast furnace was estimated based on a probabilistic analysis by focusing on the coke in the deadman region of the blast furnace, which is subjected to the highest burden load.
Figure 14 shows the results of a DEM simulation of the burden material flow for a blast furnace with an inner volume of 5000 m3 and the probability distribution of the tensile stress acting on the coke particles in the blast furnace g(σi). g(σi) means the probability that the tensile stress acting on the coke is between
σ
i
-
1
2
Δσ
and
σ
i
+
1
2
Δσ
. In this study, the analysis was performed assuming Δσ = 0.5 MPa. The calculation conditions for the DEM simulation of the burden material flow have already been presented in a previous report.17) The calculation procedure of the probability distribution g(σi) is as follows. First, the coke particles (number of particles n = 1063) in the observation region are extracted from the DEM simulation result. In this study, the deadman region of the blast furnace shown by the square frame in Fig. 14 was used as the observation region. Next, the compressive force applied to each particle is obtained. Each coke particle has multiple contact points and is subjected to a complicated compressive force field. In this study, the maximum value of these compressive forces fmax was considered to contribute to coke breakage. Assuming that the coke particles are spherical in shape with a diameter D, the tensile stress generated inside the coke particle can be calculated by the following equation.18)
The probability distribution of tensile stress was constructed by calculating the tensile stress applied to all deadman coke particles. The right side of Fig. 14 shows the probability distribution of the tensile stress of the coke particles in the deadman region. It was found that tensile stress was less than 1 MPa in 78% of the coke particles even in the deadman region, which is subjected to a large burden load.
Based on the above findings, the coke breakage probability in the blast furnace can be expressed as the sum of the products of the probability distributions.
|
H=
∑
i
g(
σ
i
)F(
σ
i
)
| (7) |
Using Eq. (7), the coke breakage probabilities in the deadman region were evaluated under the conditions where Coke A and Coke B were applied to a blast furnace with an inner volume of 5000 m3. The solid red and blue lines in Figs. 15 and 16 show the probability distributions of coke breakage in Fig. 13, and the green bars show the probability distribution of tensile stress in the deadman region in Fig. 14. As shown in Eq. (7), the breakage probability of the coke in the deadman region is the product of these values, as shown by the red bars in Figs. 14 and 15. As a result, the percentage of coke breakage in the deadman region is evaluated by the area of the red bars in Figs. 14 and 15. The percentage of coke breakage in the deadman region is 1.9% with high strength Coke A, but increases to 8.7% when low strength Coke B is used. These results confirmed that the tensile strength of the coke greatly affects coke breakage in the deadman region of the blast furnace. Furthermore, according to the probability distribution of coke breakage in the deadman region (red bars), the largest amount of coke breakage occurs at a tensile stress of 2 MPa. These results indicate that it is preferable to design coke with emphasis on tensile strength of around 2 MPa in order to minimize coke breakage in the blast furnace.

5. Conclusion
A coke breakage model based on DEM was developed in order to quantitatively estimate the breakage phenomena of coke in a blast furnace. First, an indirect tensile test was conducted on cylindrical coke test pieces, and the tensile strength of the coke test pieces was measured in detail, including the strength distribution. Subsequently, in order to calculate the breakage behavior of coke particles by DEM simulation, a coke test piece model in which pseudo-particles were connected by parallel bonds was constructed, and a pore structure model considering a random arrangement of pores was introduced to simulate the distribution of tensile strength of the coke test pieces. The tensile strength data obtained by the experiment and DEM simulation were compared by a Weibull analysis, confirming that the experimental results were in agreement with the numerical analysis results. Thus, the coke breakage model considering the pore arrangement developed in this study is effective for estimating coke breakage behavior. In order to apply this model for analysis of the coke breakage behavior in blast furnaces, the breakage probability distribution of coke obtained by the Weibull analysis was applied to the result of a DEM simulation of the burden material flow in a 5000 m3 blast furnace, and the percentage of coke breakage in the deadman region of the blast furnace was quantitatively determined. The results suggested that it is preferable to design coke with an emphasis on tensile strength of around 2 MPa in order to minimize coke breakage in the deadman region.
These findings and the coke breakage model by DEM with pseudo-particle aggregates provide useful information from the viewpoint of coke breakage in the blast furnace. It is expected that the coke model can be applied to the design of the optimum coke structure considering the mechanical conditions in the blast furnace in the future.
Acknowledgement
This research was carried out as a part of a program funded by the New Energy and Industrial Technology Development Organization (NEDO) from FY 2012 to FY 2014.
Symbols
σ: Tensile stress (Pa)
P: Compressive load (N)
d: Diameter of cylindrical test piece (m)
l: Cylindrical test piece height (m)
σp: Maximum tensile stress acting on parallel bonds (Pa)
τp: Maximum shear stress acting on bonds (Pa)
F
pb
n
: Axial compressive force acting on parallel bonds (N)
F
pb
s
: Shear force acting on parallel bonds (N)
Ms: Bending moment acting on parallel bonds (N m)
Mn: Torsion moment acting on parallel bonds (N m)
R: Radius of parallel bonds (m)
A: Cross-sectional area of parallel bonds (m2)
I: Moment of inertia of area of parallel bonds (m4)
J: Polar moment of inertia of area of parallel bonds (m4)
σc: Tensile strength of parallel bonds (Pa)
τc: Shear strength of parallel bonds (Pa)
F: Breakage probability (-)
σ0: Representative value of tensile strength for Weibull analysis (Pa)
m: Weibull modulus (-)
g: Probability distribution of tensile stress acting on coke in blast furnace (-)
σi: Average value of interval i in probability distribution histogram of tensile stress (Pa)
Δσ: Interval width of probability distribution histogram of tensile stress (Pa)
fmax: Maximum value of compressive force applied to coke particles (N)
H: Percentage of coke breakage (-)
References
- 1) H. Yamaoka and K. Nakano: Tetsu-to-Hagané, 86 (2000), 733 (in Japanese).
- 2) Y. Iwanaga and K. Takatani: Tetsu-to-Hagané, 74 (1988), 624 (in Japanese).
- 3) K. Katayama, S. Wakabayashi, T. Inada, K. Takatani and H. Yamaoka: Tetsu-to-Hagané, 83 (1997), 91 (in Japanese).
- 4) H. Haraguchi, T. Nishi, Y. Miura, M. Ushikubo and T. Noda: Tetsu-to-Hagané, 70 (1984), 2216 (in Japanese).
- 5) K. Yamaguchi and T. Uno: Tetsu-to-Hagané, 85 (1999), 578 (in Japanese).
- 6) T. Nouchi, T. Sato, M. Sato, K. Takeda and T. Ariyama: ISIJ Int., 45 (2005), 1426.
- 7) Z. Fan, S. Igarashi, S. Natsui, S. Ueda, T. Yang, R. Inoue and T. Ariyama: ISIJ Int., 50 (2010), 1406.
- 8) F. Bambauer, S. Wirtz, V. Scherer and H. Bartusch: Powder Technol., 334 (2018), 53.
- 9) G. Frenning: Chem. Eng. Sci., 65 (2010), 2464.
- 10) D. O. Potyondy and P. A. Cundall: Int. J. Rock Mech. Min. Sci., 41 (2004), 1329.
- 11) S. Ishihara, Q. Zhang and J. Kano: J. Soc. Powder Technol. (Jpn.), 51 (2014), 407 (in Japanese).
- 12) S. Kim and Y. Sasaki: ISIJ Int., 50 (2010), 813.
- 13) S. Kim and Y. Sasaki: Fuel, 106 (2013), 357.
- 14) T. Akazawa: J. Jpn. Soc. Civ. Eng., 29 (1943), 777 (in Japanese).
- 15) M. Sakai, R. Nishimura, M. Nishimura and K. Fukuda: Tetsu-to-Hagané, 92 (2006), 164 (in Japanese).
- 16) K. Uebo, S. Aizawa and S. Yoshida: Tetsu-to-Hagané, 92 (2006), 177 (in Japanese).
- 17) K. Takahashi, T. Nouchi, M. Sato and T. Ariyama: ISIJ Int., 55 (2015), 1866.
- 18) Y. Hiramatsu, Y. Oka and H. Kiyama: J. Min. Metall. Inst. Jpn., 81 (1965), 1024 (in Japanese).


