Special Issue on "Recent Progress in Inclusion/ Precipitate Engineering"
Thermodynamics of Molten MnS–FeS and CrS–FeS System at 1843 K
2021 年 61 巻 9 号 p. 2345-2354
詳細
2021 年 61 巻 9 号 p. 2345-2354
Phase equilibria in Fe–Mn–S and Fe–Cr–S ternary systems at 1843 K were investigated experimentally, respectively. The main characteristic of these two systems at 1843 K was confirmed to be a wide miscibility gap between two liquid phases: molten metal alloy phase and molten sulfide phase. Through metal/sulfide equilibrium method, activity of constituents in sulfide phase were determined in Fe–Mn–S and Fe–Cr–S systems separately. The activity curves of constituents in sulfide phase were estimated by utilizing regular solution model.
Alloying elements such as Mn, Cr are commonly used in steelmaking. These two chemical elements have stronger affinity with sulfur than iron according to a sulfide forming tendency order:1) Zr>Ti>(Mn)>Nb>V>(Cr)>Al>Mo>W>(Fe)>Ni>Co>Si. Hence, in Mn, Cr added steel, sulfides which consist of MnS–CrS–FeS may form.2,3) FeS content in solid MnS–CrS is low3) and sometimes it was ignored. In this study, we consider it as a component in sulfide phase.
Composition of sulfide phase is important to know, because different sulfide component affects the quality of the steel in terms of transverse ductility, corrosion resistance and machinability.4,5,6,7,8,9) Moreover, the morphology of sulfide inclusion is closely related to its composition, which determines the precipitation mode as eutectic or monotectic during solidification of steel.3)
To control and estimate sulfide formation, it is fundamentally important to know the equilibria involving MnS–CrS–FeS phase in the Fe–Cr–Mn–S system. According to a hypothetical CrS–MnS pseudobinary diagram,3) liquid CrS–MnS exists over a wide composition range at the steel solidification temperature ranges. Also, it is well-known that FeS is a low-melting agent. Therefore, in order to obtain an adequate description of the sulfide formation in Fe–Cr–Mn–S system, it is firstly important to have a good representation of the properties of the liquid MnS–CrS–FeS phase. However, the thermodynamics information of liquid MnS–CrS–FeS phase is very limited.
From a viewpoint of CALPHAD method: the phase behavior of multicomponent can be interpreted based on the extrapolation from lower-order binary system. Thus, binaries of MnS–FeS and CrS–FeS are necessary to know in order to express the property of MnS–CrS–FeS phase.
The phase diagram involving binary sulfide phase in Fe–Mn–S and Fe–Cr–S systems were studied in considerable detail since 1930’s.10,11) And quantitative modeling to calculate the phase diagram of Fe–Mn–S and Fe–Cr–S systems were developed from 1970’s. Hillert,12) Ohtani,13) and Oikawa14) in their studies considered the solution phase of the two systems as (Fe,Mn)(S,Va) and (Fe,Cr)(S,Va) where Va is a hypothetical vacant component. Thus, the modeling turned ternary Fe–Mn–S and Fe–Cr–S system into a reciprocal quaternary Fe–FeS–MnS–Mn and Fe–FeS–CrS–Cr system. They were able to reveal important features in agreement with experimental results from 1930’s, such as miscibility gaps in liquid phase. In spite of their excellent description of the solution phase, it is not easy to extend their results to Fe–Cr–Mn–S system, because 1). Properties of Mn–Cr–S system is not available; 2). By adding a vacant component will make the quaternary Fe–Cr–Mn–S system far more complicated to express.
The purpose of present study was to describe the thermodynamic properties of molten MnS–FeS and CrS–FeS using a simple regular solution model without considering the vacancies. To be noticed, this simple expression of MnS–FeS and CrS–FeS is not intended to describe accurately the phenomenon in Fe–Mn–S and Fe–Cr–S system over the whole composition ranges. This simple regular solution model is expected to be used in extrapolation of molten MnS–CrS–FeS systems in which FeS effect is not as important as that in Fe– FeS–MnS–Mn or Fe–FeS–CrS–Cr systems.
As a result, in this study we considered the solution phase in Fe–Mn–S or Fe–Cr–S systems as liquid metal phase and liquid sulfide phase separately. Activity of constituents in liquid sulfide phase can be obtained using the traditional Metal/Sulfide equilibrium method at 1843 K. Metal/Sulfide experiments had been performed by Vogel at 1930’s. However, at that time, Vogel paid more attention on drawing phase diagram and raw experimental data was limited. In order to achieve accurate activity information of sulfide phase, we did the similar Metal/Sulfide equilibrium experiments at 1843 K. According to present experimental activity information, thermodynamic expressions of molten MnS–FeS and CrS–FeS sulfide phase using simple regular solution model was determined.
Metal/sulfide phase equilibria in Fe–Mn–S and Fe–Cr–S alloys were experimentally measured, respectively. A vertical tube resistance furnace was used for heating samples as schematically in Fig. 1. The starting materials used in this study were electrolytic iron powders (95%+ purity, Wako Pure Chemical Industries, Ltd.), iron sulfide lumps (50%+ purity, Wako Pure Chemical Industries, Ltd.) and manganese flake (99% purity, HIRANOSEIZAEMONSYOUTEN Co, Ltd.) for Fe–Mn–S alloy, or electrolytic iron powders (95%+ purity, Wako Pure Chemical Industries, Ltd.), iron sulfide lumps (50%+ purity, Wako Pure Chemical Industries, Ltd.) and chromium lumps (99% purity, HIRANOSEIZAEMONSYOUTEN Co, Ltd.) for Fe–Cr–S alloy. For each run, approximately 23 grams of the starting materials with designed proportions were mixed in an alumina crucible placed in an outer magnesia protecting crucible. Then the samples were placed in the hot zone of the furnace. The samples were heated in an argon atmosphere to 1843 K and held at the temperature for 4 hours. The temperature was controlled by a Pt-Rh (R-type) thermocouple positioned just below the sample. Preliminary experiment was done using the same initial alloying composition with different holding time: 2, 4 and 6 hours. The chemical composition of metal and sulfide phases were examined. The analyzed compositions keep the same at 2, 4 and 6 hours respectively. From this evidence, 4 hours was considered sufficient to reach equilibrium and it was selected as the experimental holding time. When the heating procedure was finished, the sample was quickly withdrawn from the furnace and quenched by impinging Ar gas on the surface of the sample.

Schematic diagram of vertical tube resistance furnace.
After quenching, longitudinal section from each reaction product was cut off, embedded, ground and polished. SEM-EDS (Scanning Electron Microscopy with Energy Dispersive X-ray Spectroscopy) was used for microscopic analysis and to confirm the equilibrium composition of sulfide phase.
The equilibrium composition of metal alloy phase was determined from bottom cutting blocks of each reaction product. Specifically, the composition of Mn or Cr in metal alloy phase were determined by ICP-AES (Inductively Coupled Plasma- Atomic Emission Spectroscopy), and the composition of S in metal alloy phase was determined by an inert gas fusion technique using LECO-CS844 Carbon/Sulfur Element Analyzer.
One typical microstructure of the equilibrated samples at 1843 K is shown in Fig. 2. In the figure, sulfur-rich phases indicated by dark regions are distributed in the matrix of iron-rich phase (light region). To be noticed, two kinds of morphology of sulfur-rich phase were observed. One was spherical-like which are mostly distributed at top part of the sample as shown in Fig. 2(a), while the other was particle-like which were dispersed along the whole cross section of the sample as shown in Figs. 2(a) and 2(b). As the particle-like phases were very small (several microns) compared to spherical-like phases (several tens of microns) and evenly distributed in the whole sample, it was reasonable to consider that the very small particle-like ones were precipitated products during quenching. Therefore, at 1843 K, the coexisting phases were two: liquid Fe-rich Fe–Mn–S (or Fe–Cr–S) metal alloy phase and spherical S-rich sulfide phase (for convenience, the following mentioned sulfide phase in the article are all refers to the equilibrated spherical-like ones). As sulfide phase is spherical, it indicates that sulfide phase is also liquid state at 1843 K. Also, due to the density difference of metal and sulfide, it is reasonable that sphere sulfide floated to the top part of the sample during experiment. The formation of this characteristic, i.e. two liquid phase equilibrium, was confirmed for all the experimental samples in present work. This result agrees with Vogel’s.10,11)
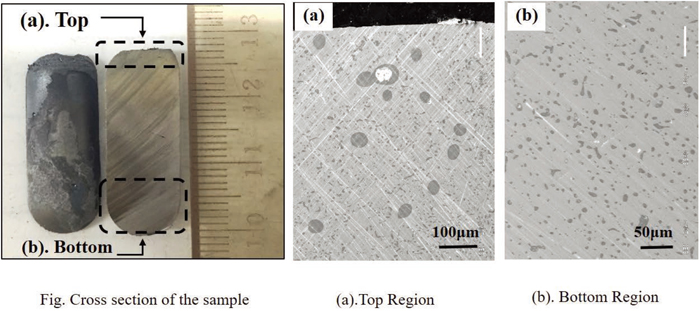
Typical micrograph of cross section of alloy equilibrated at 1843 K. (Online version in color.)
With the clear identification of the equilibrium phases, sulfide phase composition was determined by SEM-EDS according to spherical sulfide and metal phase composition was determined by ICP and inert gas fusion technique using metal pieces from bottom part of the sample.
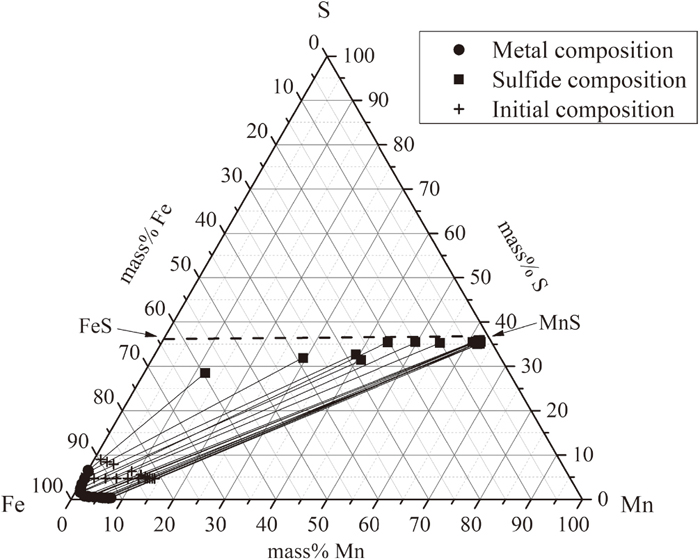
3.1.1. Equilibria of Fe–Mn–S System at 1843 KThe chemical analyzed results of metal alloy phase and sulfide phase in Fe–Mn–S system are shown in Table 1. The relationship between metal compositions and sulfide compositions is plotted in Fig. 3(a). In the figure, solid circles and squares denote experimental composition of metal phases and sulfide phases separately. Cross marks represent initial composition of the starting mixtures. Tie-lines between solid circles and squares indicate observation of two-phase equilibrium at that compositions. It is apparent that the initial composition locates on the tie-line indicating that the determination method for metal and sulfide composition is appropriate.
| Heats No. | Metal alloy-Experimental | Metal alloy-Calculated | Sulfide phase-Experimental | Sulfide phase-Calculated | |||||
|---|---|---|---|---|---|---|---|---|---|
| [%S] | [%Mn] | xFe | [%S] | [%Mn] | [%Fe] | xMnS | aMnS | aFeS | |
| 101 | 0.31 | 7.66 | 0.92 | 35.11 | 62.47 | 2.43 | 0.96 | 1.01 | 0.02 |
| 102 | 0.28 | 7.26 | 0.92 | 35.50 | 62.23 | 2.27 | 0.97 | 0.88 | 0.02 |
| 103 | 0.31 | 6.57 | 0.93 | 35.38 | 62.09 | 2.54 | 0.96 | 0.93 | 0.02 |
| 104 | 0.33 | 6.07 | 0.93 | 35.53 | 62.41 | 2.07 | 0.97 | 0.94 | 0.02 |
| 105 | 0.40 | 5.53 | 0.94 | 35.73 | 61.82 | 2.45 | 0.96 | 1.05 | 0.03 |
| 106 | 0.50 | 4.35 | 0.95 | 34.95 | 62.01 | 3.03 | 0.95 | 1.08 | 0.04 |
| 107 | 0.52 | 3.24 | 0.96 | 35.55 | 61.47 | 2.98 | 0.95 | 0.87 | 0.04 |
| 108 | 0.64 | 3.01 | 0.96 | 35.45 | 61.36 | 3.19 | 0.95 | 0.99 | 0.05 |
| 109 | 0.75 | 2.30 | 0.96 | 35.44 | 60.85 | 3.71 | 0.94 | 0.90 | 0.06 |
| 110 | 1.59 | 1.05 | 0.96 | 35.26 | 54.59 | 10.14 | 0.85 | 0.82 | 0.14 |
| 111 | 1.64 | 0.94 | 0.96 | 35.43 | 49.70 | 14.88 | 0.77 | 0.76 | 0.14 |
| 112 | 2.44 | 0.64 | 0.95 | 35.38 | 44.34 | 20.28 | 0.69 | 0.69 | 0.20 |
| 113 | 3.45 | 0.40 | 0.94 | 31.42 | 40.98 | 27.60 | 0.60 | 0.53 | 0.27 |
| 114 | 4.72 | 0.35 | 0.92 | 32.68 | 39.32 | 28.00 | 0.59 | 0.52 | 0.34 |
| 115 | 6.21 | 0.30 | 0.89 | 31.84 | 29.42 | 38.74 | 0.44 | 0.47 | 0.39 |
| 116 | 6.51 | 0.11 | 0.89 | 28.45 | 11.97 | 59.58 | 0.17 | 0.17 | 0.41 |
Experimental results on the phase equilibria of Fe–Mn–S system at 1843 K.
For sulfide phase, according to Fig. 3(a), S concentration are almost fixed parallel to FeS–MnS line at low Fe containing samples. However, S concentration decreases with increasing of Fe especially for samples of No. 113 to No. 116. The reason is that FeS in sulfide phase tends to dissolve in metal alloy phase when moving towards Fe–FeS binaries at 1843 K as sulfide is in equilibrium with excess amount of metal alloy in the experiments. In present work, as we are more focusing on MnS sulfide at low Fe containing region where the ratio of Mn, Fe atoms and s atom is close to 1:1, it is reasonable to assumed sulfide phase as FeS, MnS mixtures.
An enlarged diagram of Fe-rich corner was shown in Fig. 3(b). The present results agree well with former researchers.10,15,16) At different Mn concentrations, when sulfide forms, there is a certain S solubility limit. With an increasing of Mn concentrations, the solubility of S decreases. As Fe, Mn, S atoms substitute each other at a certain composition range from the results, metal alloy phase was assumed as a mixture of Fe, Mn, S atoms in this study.

Enlarged iron-rich corner of Fig. 3(a), Mn, S relations when sulfide forms.
The chemical analyzed results of metal alloy phase and sulfide phase in Fe–Cr–S system are shown in Table 2. The relationship between metal compositions and sulfide compositions of Fe–Cr–S system is shown in Fig. 4(a). Tie-lines between solid circles and squares indicate observation of two-phase equilibrium at that compositions. In this figure, initial composition didn’t locate just on the tie-line. It shifted horizontally a little bit towards Cr side. The reason is that in the starting materials Cr lumps contains about 5000 ppm oxygen. During the melting process, a little amount of Cr combined with O leading to a loss of Cr content in the final metal alloy phase. However, this result didn’t affect the equilibrium between metal alloy phase and sulfide phase.
| Heats No. | Metal alloy-Experimental | Metal alloy-Calculated | Sulfide phase-Experimental | Sulfide phase-Calculated | |||||
|---|---|---|---|---|---|---|---|---|---|
| [%S] | [%Cr] | xFe | [%S] | [%Cr] | [%Fe] | xCrS | aCrS | aFeS | |
| 201 | 1.98 | 21.52 | 0.74 | 36.01 | 60.89 | 3.10 | 0.95 | 0.91 | 0.08 |
| 202 | 2.14 | 20.23 | 0.75 | 36.89 | 59.08 | 4.03 | 0.94 | 0.94 | 0.09 |
| 203 | 2.44 | 18.27 | 0.77 | 36.36 | 58.61 | 5.03 | 0.93 | 0.99 | 0.11 |
| 204 | 2.40 | 16.45 | 0.79 | 35.95 | 57.91 | 6.14 | 0.91 | 0.92 | 0.11 |
| 205 | 2.43 | 14.37 | 0.81 | 36.78 | 56.85 | 6.38 | 0.91 | 0.86 | 0.12 |
| 206 | 2.89 | 12.29 | 0.82 | 37.20 | 52.76 | 10.05 | 0.85 | 0.88 | 0.15 |
| 207 | 2.92 | 11.20 | 0.83 | 37.54 | 52.37 | 10.08 | 0.85 | 0.83 | 0.16 |
| 208 | 3.14 | 9.86 | 0.84 | 37.75 | 51.07 | 11.18 | 0.83 | 0.80 | 0.18 |
| 209 | 3.71 | 8.01 | 0.85 | 38.46 | 43.16 | 18.39 | 0.72 | 0.75 | 0.22 |
| 210 | 3.96 | 6.64 | 0.86 | 37.71 | 40.70 | 21.59 | 0.67 | 0.67 | 0.24 |
| 211 | 4.60 | 6.12 | 0.86 | 36.92 | 35.18 | 27.90 | 0.58 | 0.68 | 0.27 |
| 212 | 5.44 | 5.26 | 0.85 | 37.34 | 23.21 | 39.45 | 0.39 | 0.65 | 0.31 |

Experimental results on the phase equilibria of Fe–Cr–S system at 1843 K.
For sulfide phase, as S concentration are almost fixed along FeS–CrS line, we assumed sulfide phase as FeS, CrS mixtures. CrS/FeS ratio increases in sulfide phase as Cr concentrations increasing in metal alloy phase.
Figure 4(b) shows the Cr, S relations when sulfide forms. Present results showed same trend as Vogel’s.11) With an increasing of Cr concentrations, the solubility of S in metal alloy decreases. Compared with MnS–FeS sulfide forming case (Fig. 3(b)), the S solubility is apparently larger though at high Cr concentrations. It meets the results that Cr has lower affinity with S than Mn. For metal alloy phase, it can be assumed as a mixture of Fe, Cr, S atoms.
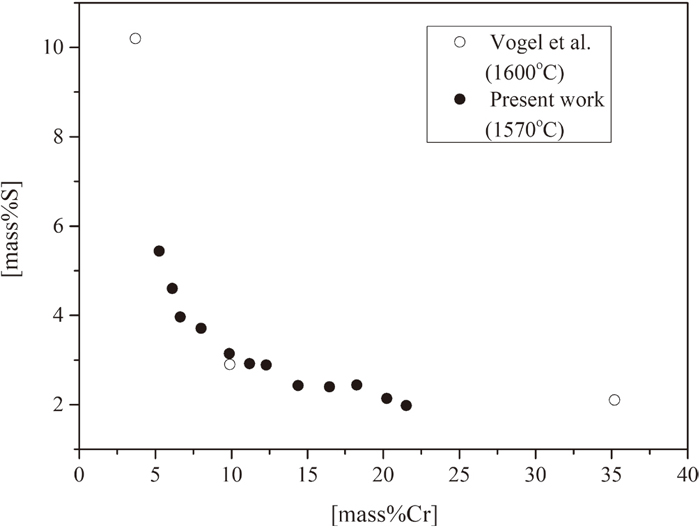
Enlarged iron-rich corner of Fig. 4(a), Cr, S relations when FeS–CrS sulfide forms.
To be noticed, in real steelmaking practice, even for free machining steels in which sulfur is intentionally added (usually 0.1–0.3 mass%), the sulfur concentration is under the solubility limit curves in Figs. 3(b) and 4(b) at normal Mn (usually <2 mass%) or Cr (usually 10–20 mass%) added steel. It meets the fact that in real practice, FeS–MnS or FeS–CrS will not form at 1843 K. Hence, in real practice, the detected sulfide in final products forms during cooling and solidification of steel due to decrease of sulfide solubility in steel and also sulfur segregation.
3.2. Activity of Constituents in Molten Sulfide Phase 3.2.1. Activity of MnS and FeS in Molten Sulfide Phase of Fe–Mn–S System at 1843 KBecause the main characteristic of Fe–Mn–S ternary system at 1843 K is the equilibria of two phases, the system can be expressed as controlled by the following two chemical equations:
| (1) |
| (2) |
Left-hand side of the chemical equations represent constituents of molten metal alloy phase and right-hand side of the chemical equations represent constituents of molten sulfide phase.
If KMnS(liq.) and KFeS(liq.) are the equilibrium constants of reaction (1) and (2) respectively, the activities of MnS and FeS can be determined by the following equations:
| (3) |
| (4) |
The activity coefficients of Mn and S were expressed as functions of [mass%Mn] and [mass%S] according to Wagner’s formalism17) as following:
| (5) |
| (6) |
According to Eqs. (3), (4), (5), (6), in order to determine aMnS and aFeS, values of KMnS(liq.), KFeS(liq.), γFe,
Values of
The KFeS(liq.) value was obtained as follows: according to references,18,20) standard Gibbs free energy change ΔG0 (J/mol) of reaction (7) and (8) were referred.
| (7) |
| (8) |
By combining Eqs. (7) and (8),
| (9) |
| (10) |
The
Values of
| (11) |
| (12) |
In the equation, aMnS is unity when it is pure MnS. For experiments of No. 101 to No. 109, it can be assumed that MnS in sulfide phase obeys Rault’s law, because the MnS content is very close to pure MnS. Hence, for experiments of No. 101–No. 109, the activity of MnS can be replaced as:
| (13) |
By substituting Eq. (13) into Eq. (12), for experimental data points of No. 101–No. 109, we have:
| (14) |
In the equation, the unknown variables are only

Derivation of eMnS and KMnS in Fe–Mn–S system at 1843 K.
According to Eq. (11),
The derived value of
| Author(s) | T/K | |
|---|---|---|
| C. W. Sherman et al. | −0.025 | 1873 |
| S. Ban-ya et al. | −0.026 | 1823 |
| Present authors | −0.021 | 1843 |
On knowing all the values of KMnS(liq.), KFeS(liq.), γFe and

Activity of sulfide phase in MnS–FeS system at 1843 K.
For Fe–Cr–S ternary system, the analytical treatment is similar to Fe–Mn–S ternary system. Since the main characteristic of Fe–Cr–S ternary system at 1843 K is the equilibria between metal and sulfide phases, the system were expressed as controlled by the following two chemical equations:
| (15) |
| (16) |
Left-hand side of the chemical equations represent constituents of liquid metal alloy phase and right-hand side of the chemical equations represent constituents of liquid sulfide phase.
If KCrS(liq.) and KFeS(liq.) are the equilibrium constants of reaction (15) and (16) respectively, the activities of CrS and FeS can be determined by the following equations:
| (17) |
| (18) |
Since logfCr and logfS can be expressed as functions of [mass%Cr] and [mass%S] by Eqs. (19) and (20), finally Eq. (17) yields function of aCrS against [mass%Cr] and [mass%S] as Eq. (22).
| (19) |
| (20) |
| (21) |
| (22) |
Values of
In the Eq. (22), aCrS is unity when it is pure CrS. For experiments of No. 201 to No. 207, it can be assumed that CrS in sulfide phase obeys Rault’s law, because the CrS concentration is close to pure state of CrS. Hence, for experiments of No. 201–No. 207, the activity of CrS can be replaced as:
| (23) |
By substituting Eq. (23) into Eq. (22), for experimental data points of No. 201–No. 207, we have:
| (24) |
In the equation, the unknow factors are
Derivation of eCrS and KCrS in Fe–Cr–S system at 1843 K.
According to Eq. (21),
The derived value of
| Author(s) | T/K | |
|---|---|---|
| N. R. Griffing | −0.019 | 1873 |
| A. Adachi et al. | −0.020 | 1923 |
| S. Ban-ya et al. | −0.0107 | 1823 |
| J. G. Dondelinger | −0.0117 | 1823 |
| Present authors | −0.0113 | 1843 |
By utilizing the derived KCrS(liq.),

Activity of sulfide phase in CrS–FeS system at 1843 K.
Thermodynamic assessment was based on the experimental activity information. The objective is to determine the expressions to describe the thermodynamic properties of molten sulfide phase.
3.3.1. Thermodynamic Expressions of Molten MnS–FeS PhaseA regular solution model was applied in order to express the activities of sulfide phase across a wide composition range. The mole excess Gibbs free energy change of mixing of MnS–FeS phase,
| (25) |
The unknown parameter ΩFeS−MnS was evaluated from the present experimental results as follows:
Activity coefficients of MnS and FeS, γMnS and γFeS in sulfide phase can be expressed by the following well known equation:28)
| (26) |
| (27) |
By substituting Eq. (25) into Eqs. (26) and (27), we have:
| (28) |
| (29) |
In the Eqs. (28) and (29), activity coefficients of MnS and FeS can be obtained directly from section 3.2.1, therefore the unknow factor in the equations is only ΩFeS−MnS. If taking lnγMnS of Eq. (28) as vertical axis and
Figure 9 represents the result. In the figure, blank symbols are samples outside of stoichiometric range. Ignoring these points, according to the slope of fitting line, value of ΩFeS−MnS/RT were derived as −0.3119. Thus,

Derivation of ΩFeS–MnS/RT of MnS–FeS system at 1843 K.
From this result, through Eqs. (28), (29), activity coefficients and activity of FeS and MnS can be calculated at any composition. The estimated activity curves of MnS and FeS in sulfide phase were plotted in Fig. 6. As can be seen, the calculated curves fit well with the experimental results at XMnS>0.6. The activities show a little negative deviation from the ideal behavior.
3.3.2. Thermodynamic Expressions of Molten CrS–FeS PhaseThe mole excess Gibbs free energy change of mixing of FeS–CrS phase,
| (30) |
The unknown parameter ΩFeS−MnS was evaluated from the present experimental results as follows:
Activity coefficients of CrS and FeS, γCrS and γFeS in sulfide phase were expressed according to Eqs. (31) and (32):
| (31) |
| (32) |
By substituting Eq. (30) into Eqs. (31), (32) and rearrangement, we have functions of lnγCrS against
| (33) |
| (34) |
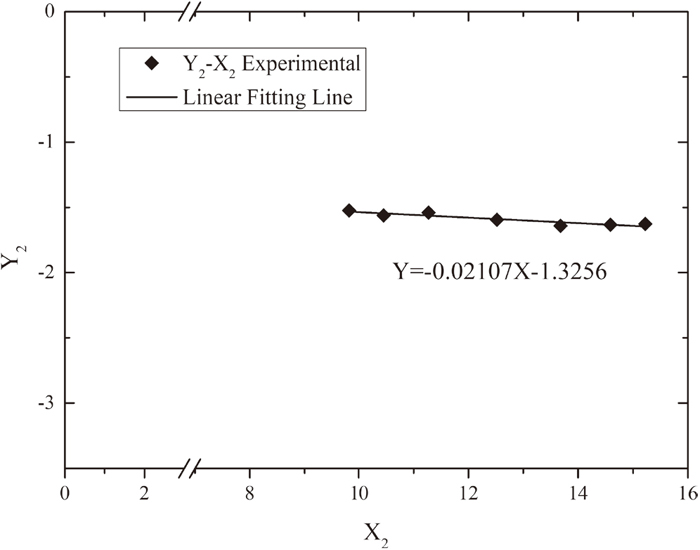
In the equation, the activity coefficient of CrS and FeS in sulfide phase can be obtained from section 3.2.2, thus unknow of ΩFeS−CrS/RT can be derived from the slope of lnγCrS-
Figure 10 represents the results. In the figure, blank points seem very strange although sulfide compositions of these samples locate on the stoichiometric range according to Fig. 4(a). The reason of this discrepancy is still unclear. Similar to Fe–Mn–S system, we achieved the fitting line by ignoring the four strange samples. Value of ΩFeS−CrS/RT was derived from slope as 0.2594, thus
| (35) |
| (36) |
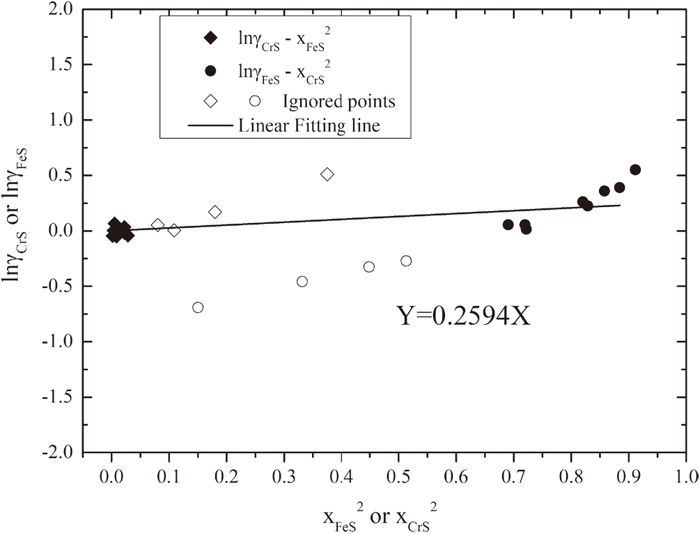
Derivation of ΩFeS–CrS/RT of CrS–FeS system at 1843 K.
According to this result, the activity curves of CrS and FeS in sulfide phase were evaluated in Fig. 8. As can be seen, the calculated curves fit well with the experimental results at XCrS>0.75. The activities of CrS and FeS are very close to ideal activity lines.
3.4. Application of the ResultsThermodynamic expressions of molten MnS–FeS and CrS–FeS system were determined using a simple regular solution model from present work. To be noticed, the simple regular expression of MnS–FeS and CrS–FeS is not intended to describe accurately the phenomenon in Fe–Mn–S and Fe–Cr–S system over the whole composition ranges. However, it is able to estimate liquid sulfide compositions at low FeS-containing ranges such as the results shown in Figs. 6 and 8.
The derived ΩFeS−MnS and ΩFeS−CrS is expected to be used in extrapolation of molten MnS–CrS–FeS systems. If thermodynamic properties of molten MnS–CrS–FeS can be expressed using regular solution model as
(1) The equilibrium relations between sulfide and metal alloy phases in Fe–Mn–S and Fe–Cr–S systems at 1843 K were experimentally measured, respectively. Molten MnS–FeS and CrS–FeS sulfide phase were confirmed to form in Fe–Mn–S and Fe–Cr–S systems, respectively. Solubility of sulfur changes with initial [mass% Mn] or [mass% Cr] when FeS–MnS or FeS–CrS forms. In real steelmaking practice, sulfide phase will not form at 1843 K in Mn or Cr alloyed steel as [mass% S] is controlled low enough without reaching S solubility limit.
(2) Interaction coefficients
(3) The excess Gibbs free energy of mixing of molten MnS–FeS and CrS–FeS phase at 1843 K were expressed by utilizing regular solution model as follows, respectively. The standard state of MnS, CrS, FeS were pure liquid state at 1843 K.
(4) The activity curves of constituents in MnS–FeS and CrS–FeS sulfide phase were estimated at 1843 K, respectively. The activities of MnS and FeS in sulfide phase show a little negative deviation from the ideal behavior. The activities of CrS and FeS in sulfide phase are very close to ideal behavior.
The authors wish to thank Professor Tetsuya Nagasaka, Takehito Hiraki and Professor Yasushi Sasaki (both Graduate School of Engineering, Tohoku University) for their valuable suggestions and encouragement. One of the authors (Yan Lu) gratefully acknowledges a scholarship provided by China Scholarship Council for his doctor study in Tohoku University. Also, financial support from ISIJ research grant and Nippon Steel Stainless Steel Corporation is gratefully appreciated.