Abstract
Controlling inclusion content in high chromium steel is very important to prevent submerged entry nozzle from clogging in continuous casting and avoid the negative impacts of inclusions on steel properties. Therefore, effects of temperature and content of elements on phase stability diagram should be clarified in chromium bearing steel. However, the effect of chromium content on boundaries of MgO, MgO∙Al2O3 and Al2O3 in phase stability diagram are much different among the researchers. The direction of boundaries shift is affected by chromium content differently. Temperature dependencies of deoxidation equilibrium constants below 1873 K are also scattered. Calcium, which is used to avoid the negative effect of MgO∙Al2O3 inclusion, enlarges liquid region in phase stability diagram. However, the region replaced by liquid oxide is understood differently in low alloyed steel and high chromium steel. In TiOX–Al2O3–MgO system inclusion, commercial thermochemical software predicts that boundaries of Ti2O3, Ti3O5, Al2O3 and TiOx–Al2O3 shift toward lower titanium content in high chromium steel. However, the calculated phase stability diagrams vary among studies even in liquid iron or low alloyed steel. Therefore, equilibrium experiments under various conditions and reliable technique of thermodynamic calculation with high accuracy are desired.
1. Introduction
MgO·Al2O3 spinel inclusions in high chromium steel are known to be detrimental to surface quality and mechanical properties such as formability and resistance to fatigue and fracture. The shortcomings intrinsically result from its high melting point and high hardness. There exist the other problems of plant operation from refining to casting. MgO·Al2O3 spinel inclusions are apt to adhere to the inner wall of the SEN (submerged entry nozzle) during casting. As a result, nozzle clogging decreases productivity and small debris flaked from the deposition results in surface defects.1,2,3,4) The temperature of molten high chromium steel during casting is lower than that of liquid iron or low alloyed steel. Therefore, acquisition of thermodynamic data in lower temperature below 1873 K are also important, especially at as low as 1773 K. Some inclusions found in steel products have been reported to originate from refining slag entrapped during AOD (Argon Oxygen Decarburization) or ladle process. Alumina content in entrapped slag particle increases during the production process because of temperature drop from ladle to casting. Increase of alumina content in inclusion promotes precipitation of MgO∙Al2O3 phase. Presence of MgO∙Al2O3 in molten steel facilitates nozzle clogging due to the strong adherability as mentioned above. However, there are few thermodynamic data of high chromium steel under the condition of low temperature because many studies have mainly targeted low alloyed steel with high liquidus temperature.
On the other hand, spinel inclusions could facilitate the formation of equiaxed crystal in ferritic stainless steel containing titanium through promoting the formation of titanium nitride, TiN, which has good lattice consistency with delta ferrite.5,6,7) Titanium is also added to high chromium steel in order to fix soluble carbon and nitrogen which result in grain-boundary corrosion by forming chromium deplete zone. Added titanium would partially oxidize and form some oxides, Ti2O3 and Ti3O4.8) Moreover, Al2O3–TiOx–(MgO) oxide could be formed in Al killed steel.9) The oxide deteriorates steel quality for the same reason as the spinel oxide does.
For the reasons stated above, it is very important to control inclusion composition in commercially operated steelmaking processes. In the past, many studies on controlling inclusion have been executed in liquid iron, low alloyed steel and high chromium steel. Park et al.10) published comprehensive review targeted at spinel inclusion in stainless steel. Liu et al.11) and Deng et al.12) also performed reviews on formation and evolution of inclusion for various grades of steel. However, the published values on thermodynamic calculation differ from one another to no small extent. Especially, the effects of chromium content on the behaviors of MgO·Al2O3 spinel and TiOx–Al2O3 inclusions are quite different among studies. Therefore, it is difficult to determine suitable deoxidation conditions for operation. In the present paper, the differences on thermodynamic estimation and the necessary future works for controlling inclusion composition are discussed.
2. Inclusion of MgO–Al2O3(−CaO) System
2.1. Phase Stability Diagram of MgO, MgO–Al2O3 and Al2O3 System
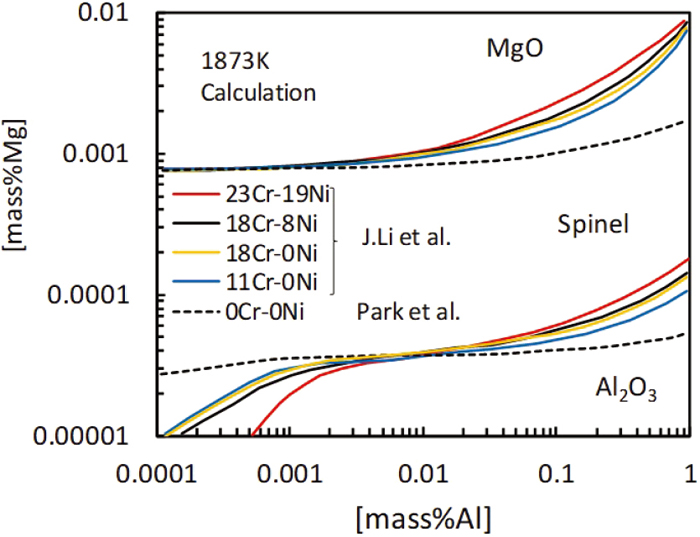
Park et al.10) and Li et al.13,14) calculated phase stability diagram of MgO, MgO·Al2O3 and Al2O3 inclusions using commercial thermochemical software and database (FactSage) at 1873 K in molten steel containing various chromium contents, respectively. For comparison, their calculated results are shown in Fig. 1. The figure shows that the boundaries of MgO/MgO·Al2O3 and MgO·Al2O3/Al2O3 shift toward higher magnesium content with increasing of chromium content when aluminum content is more than 0.003 mass%. On the other hand, the boundary of MgO/MgO·Al2O3 is less affected by chromium and aluminum contents. The boundary of MgO·Al2O3/Al2O3 shifts toward lower magnesium content with increasing of chromium content when aluminum content is less than 0.003 mass%.
In the above-mentioned thermochemical software, the calculation is based on thermodynamic model and database. The calculation procedures inside the programs are complicated. As a result, it is difficult to assess the contribution of various factors including equilibrium constants of deoxidation reactions, first and second order interaction parameters. The results by the commercial software with are compared with those calculated by conventional thermodynamic method. The adopted procedure and thermodynamic parameters are the same as those proposed by Itoh et al.15) Reactions treated here are expressed by Eqs. (1), (2), (3) and the deoxidation constants of them are given by Eqs. (4), (5), (6) according to the earlier publications.16,17,18) The activities of MgO and MgO·Al2O3 are unity and 0.8 at MgO saturation and those of Al2O3 and MgO·Al2O3 are unity and 0.47 at Al2O3 saturation, respectively.18) Interaction parameters listed in Table 1 contains the parameters
e
Mg
Cr
,
e
Al
Cr
and
e
O
Cr
to take the effect of chromium content into consideration.
|
Al
2
O
3
(s)=2
Al
_
+3
O
_
| (2) |
|
MgO(s)⋅
Al
2
O
3
(s)=
Al
2
O
3
(s)+MgO(s)
| (3) |
|
log
K
MgO
=log
a
Mg
⋅
a
O
a
MgO
=-4.280-
4 700
T
| (4) |
|
log
K
Al
2
O
3
=log
a
Al
2
⋅
a
O
3
a
Al
2
O
3
=11.620-
45 300
T
| (5) |
|
log
K
MgO⋅
Al
2
O
3
=log
a
MgO
⋅
a
Al
2
O
3
a
MgO⋅
Al
2
O
3
=-0.820-
1 085
T
| (6) |
Table 1. First and second order interaction parameter,
e
i
j
,
r
i
j
and
r
i
j,k
in molten steel used in this work.
| i |
e
i
Al
|
e
i
Mg
|
e
i
O
|
e
i
Cr
|
|---|
| Al | 0.04319) | −0.01920) | −1.9817) | 0.009621) |
| Mg | −0.01720) | 0 | −43016) | 0.04722) |
| O | −1.1717) | −28016) | −0.1719) | −0.03223) |
|
r
Al
O
= 40,17)
r
Al
Al,O
= −0.028,17)
r
Al
Mg,O
=−26015) |
|
r
Mg
O
= 350000,16)
r
Mg
Al,O
= −230,15)
r
Mg
Mg,O
= −6100016) |
|
r
O
Mg
= −20000,16)
r
O
Al,O
= 47.4,17)
r
O
Mg,O
= 46200016) |
As shown in Fig. 2, the calculated results indicate that both boundaries of MgO/MgO·Al2O3 and MgO·Al2O3/Al2O3 shift toward lower magnesium content with increasing of chromium content. The direction of shits derives from the positive value of
e
Mg
Cr
(0.047). The sign of the parameter would be reliable because
e
Mg
Cr
proposed by the other studies indicates positive values, 0.01( Nadif et al.24)) and 0.022 (Jo et al.25)). By comparing Fig. 2 with Fig. 1, it would be suggested that the phase stability diagram in Fig. 1 should be re-considered because chromium content has opposite effect on the shifting direction of phase boundaries.

In some experimental research with high chromium steel, the boundary of MgO/MgO·Al2O3 was identified. Liu et al.26) executed the laboratory-scale crucible experiment with molten steel containing 11 mass% chromium at 1873 K and Todoroki et al.4) investigated the inclusions in molten steel samples containing 23.5 mass% chromium at commercially operated continuous casting. The results of them are marked with broken circle in Fig. 3. The thermodynamic calculation is carried out on the basis of the same condition as the experiments and the calculated results are also shown in the figure. By comparison of experimental and calculated results, the calculated boundary between MgO and MgO·Al2O3 is located at higher magnesium content excessively in high aluminum content (>0.3 mass%) and at lower magnesium content too much in low aluminum content (<0.1 mass%).
2.2. Influence of Equilibrium Constants on Phase Stability Diagram
Here, it is discussed whether the discrepancy mentioned above could be explained with selected combination of deoxidation equilibrium constants. Liu et al.11) pointed out that the boundaries between stable phases would shift depending on the combination of deoxidation equilibrium constants as shown in Fig. 4. The figure indicates that both boundaries of MgO/MgO·Al2O3 and MgO·Al2O3/Al2O3 shift toward lower magnesium content when lower equilibrium constant of KMgO is adopted. In fact, there is greater variability among the equilibrium constants of KMgO as listed in Table 2. Similarly, the boundaries shift depending on equilibrium constants of KAl2O3 and KMgO⋅Al2O3 which are listed in Tables 3 and 4. However, it is difficult to explain the experimental results locating at both sides of the calculated line because the selected combination of equilibrium constants could shift the boundary almost parallel. It suggests that the interaction parameters affect the position of boundaries.

Table 2. Equilibrium constants of Mg–O system in liquid iron at 1873 K.
| year | logK | Author | Ref.No. |
|---|
| 1974 | −7.86 | G. K. Sigworth et al. | 27 |
| 1974 | −5.5 | V. I. Yavoiskii et al. | 28 |
| 1977 | −5.12 | E. B. Teplitskii et al. | 29 |
| 1980 | −9.24 | A. P. Gorobetz | 30 |
| 1985 | −8.54 | I. S. Kulikov | 31 |
| 1986 | −5.7 | M. Nadif et al. | 32 |
| 1991 | −7.74 | E. T. Turkdogan | 33 |
| 1994 | −7.8 | R. Inoue et al. | 34 |
| 1997 | −7.86 | H. Ohta et al. | 35 |
| 1977 | −6.03 | Q. Han et al. | 36 |
| 1997 | −6.8 | H. Itoh et al. | 16 |
| 2000 | −7.21 | J. D. Seo et al. | 37 |
| 2003 | −7.24 | W. G. Seo et al. | 38 |
| 2009 | −7.59 | N. Satoh et al. | 39 |
| 2011 | −8.07 | J. Gran et al. | 40 |
Table 3. Equilibrium constants of Al–O system in liquid iron at 1873 K.
| year | logK | Author | Ref.No. |
|---|
| 1974 | −13.34 | G. K. Sigworth et al. | 27 |
| 1980 | −13.6 | S. Gustafsson et al. | 41 |
| 1988 | −13.6 | Steelmaking Data Sourcebook (JSPS) | 19 |
| 1994 | −13.35 | H. Suito et al. | 42 |
| 1994 | −13.3 | S. W. Cho et al. | 43 |
| 1995 | −14.01 | S. Dimitrov et al. | 44 |
| 1997 | −12.57 | H. Itoh et al. | 17 |
| 1998 | −12.99 | J. D. Seo et al. | 45 |
| 2009 | −12.84 | N. Satoh et al. | 39 |
| 2003 | −13.34 | H. Ohta et al. | 21 |
Table 4. Equilibrium constants of MgO·Al
2O
3 = MgO+Al
2O
3 at 1873 K.
| year | logK | Author | Ref.No. |
|---|
| 1965 | −0.84 | H. R. Rein et al. | 46 |
| 1991 | −1.18 | O. Knacke et al. | 47 |
| 2000 | −1.4 | K. Fujii et al. | 18 |
So far it is assumed that the inclusions form by deoxidation reaction. However, some researchers have proposed that a part of spinel inclusions in molten steel might be caused by slag entrainment. Hojo et al.48) added strontium carbonate as a tracer at tapping from AOD to ladle or at tundish in stainless steel production plant to investigate the origin of inclusion formation as shown in Fig. 5. As a result, they found that MgO–Al2O3 spinel could precipitate in the suspended AOD slag droplets with decreasing of temperature in molten steel from refining to casting process through thermodynamic calculation. Similar findings have been published by other researchers.49,50,51,52) Kim et al.49) indicated the variation in inclusion composition as shown in Fig. 6. Ehara et al.51,52) showed that the change in alumina content in inclusion roughly corresponds to the calculated result considering temperature drop as depicted in Fig. 7. However, both values are not sufficiently in good agreement. One of the reasons might result from the selection of deoxidation equilibrium constant of KAl2O3 because various values of the constant have been published by many researchers.17,19,27,39,45) Figure 8 shows the relationship between logKAl2O3 and reciprocal of temperature. The figure suggests that the variation among the proposed values are 1.0 (from −13.6 to −12.6) at 1873 K and 1.6 (from −15.5 to −13.9) at 1773 K. In other word, it means that the equilibrium constant varies more widely at lower temperature. It might result from few studies at the temperature as low as 1773 K, which is below melting point of liquid iron.

Many researchers have proposed utilization of calcium to render detrimental spinel inclusions harmless.53) Calcium in molten steel forms liquid oxide and transforms MgO·Al2O3 spinel inclusion into MgO–Al2O3–CaO system inclusion. Yang et al.54) performed the thermodynamic calculation using the same method as Itoh et al.15) and evaluated the effect of calcium treatment on phase stability diagram of inclusion in low carbon Al killed steel without chromium as shown in Fig. 9. The figure shows that the width of MgO·Al2O3 region between MgO and Al2O3 would not change whereas the region of liquid oxide 12CaO·7 Al2O3 increases by replacing spinel region. On the other hand, Li et al.13,14) calculated phase stability diagram in 11 mass%Cr and 18 mass%Cr steel with thermochemical software. As shown in Fig. 10, the calculated results indicate that the width of MgO·Al2O3 region between MgO and Al2O3 becomes narrower with increasing of calcium content, which disagrees with those by Yang et al.54) It is absolutely unclear why the influence of calcium content on shrinkage behavior of MgO·Al2O3 region varies depending on the presence of chromium in steel. For the reasons stated above, it is necessary to re-evaluate the thermodynamic data including equilibrium constants and interaction parameters in high chromium steel in order to understand stability phase diagram of MgO–Al2O3–CaO system and to control the inclusion content.

3. Inclusion of TiOx–Al2O3–MgO System
3.1. Phase Stability Diagram in Inclusion of TiOx–Al2O3 System
The studies aimed at Ti bearing Al killed steel have been carried out on a basis of thermochemical software by Kang et al.55) and Li et al.,13,14) respectively. The reported results are shown in Fig. 11. The figure indicates that the phase boundaries slightly shift toward lower magnesium content with increasing of chromium content. However, the phase stability diagram in Fe–Al–Ti–O system is controversial even in liquid iron without chromium although the topic has been studied by many researchers.55,56,57,58,59) Ruby-Meyer et al.56) executed thermochemical software calculation on phase stability diagram and indicated that liquid phase exists between Ti2O3 and Al2O3 region at 1793 K. On the other hand, the other researchers55,57,58,59) could not find liquid phase in the range of [Al]>0.001 mass% even at 1873 K. The calculated results except that by Ruby-Meyer et al. are shown in Fig. 12. The figure indicates that the published values differ from one another. Therefore, it is much anticipated that the thermodynamic calculations are verified with equilibrium experiments in both liquid iron and high chromium steel.

Kim et al.49) studied inclusions consisting of CaO–SiO2–Al2O3–MgO–TiO2 in samples of 18Cr-8Ni stainless steel product. They found that inclusion of slag origin is entrapped from slag into molten steel, partly is deoxidized by added titanium and increases the content of TiO2 in inclusion due to temperature drop from AOD to mold as shown in Fig. 13. As a result, MgO·Al2O3 and TiO2 inclusions with high melting point precipitate as shown in Fig. 14.


Phase stability diagrams of TiOX–MgO–Al2O3 system were calculated using thermochemical software at 1873 K PO2=10−13 atm by Park et al.9) and at 1873 K PO2=10−12 atm by Li et al.,60) respectively. The former assessed the effect of slag basicity and indicated that the inclusions change from liquid to spinel + liquid as basicity increases. The latter evaluated the influence of CaF2 content in slag and indicated that the inclusions change from TiOx–Al2O3(Sp) to MgO–Al2O3–TiOX(TiSp)+liquid, MgO+MgO−Al2O3–TiOX(TiSp)+liquid with increasing of CaF2 content in slag as shown in Fig. 15 (Sample A: premelted before slag/metal reaction, Sample A3: after reaction with slag containing 10.07 mass%CaF2). Li et al.60) suggested that increase in MgO content in inclusion could be explained by the effect of CaF2 on magnesium content in molten steel on a basis of thermodyanamic calculation. As seen above, the influence of slag is not negiligible in both slag entrainment and control of minor constituent.
4. Thermodynamic Analysis
Wagner’s61) equation has been widely used to calculate thermodynamic relationship. Additionally, Darken’s quadratic formalism62,63) and Redlich-Kister type polynomial64,65) have been proposed. Especially, the latter has been arduously adopted for calculation targeted at high alloyed steel.8,39,66,67,68) Recently, it is clarified that deoxidation equilibrium could be predicted with a high degree of accuracy by taking into consideration the third order interaction parameter in Fe–Ni alloy.69) More application of Redlich-Kister type polynomial to various high alloyed steel could be expected in the future.
5. Conclusions
Controlling inclusion content in high chromium steel is very important to prevent submerged entry nozzle from clogging in continuous casting and avoid the negative impacts of inclusions on steel properties including surface defects. Therefore, reliable thermodynamic data is necessary. However, the published boundaries of MgO, MgO∙Al2O3 and Al2O3 in phase stability diagram of chromium bearing steel are much different among the researchers. The boundaries shift toward lower magnesium content according to the calculation on a basis of interaction parameters and deoxidation equilibrium constants. On the other hand, whereas thermochemical software calculates quite different results. Research on temperature dependency of deoxidation equilibrium constants below 1873 K is also important for controlling inclusions. However, the deoxidation equilibrium constants at low temperature vary among the studies. Calcium has been used to avoid the negative effect of MgO∙Al2O3 inclusion, but the region replaced by liquid oxide in phase stability diagram is understood differently between low alloyed steel and high chromium steel.
In TiOx–Al2O3–MgO system inclusion, thermochemical software suggests that the boundaries of Ti2O3, Ti3O5, Al2O3 and TiOx–Al2O3 shift toward the lower titanium content on the whole, but there exists a problem that calculated phase stability diagrams vary among studies even in liquid iron or low alloyed steel. Moreover, it is reported that basicity and CaF2 content of slag have a strong influence on content of TiOx–Al2O3–MgO system inclusion, but the behaviors are not fully clarified.
As noted above, equilibrium experiments at various conditions are much expected to establish reliable thermodynamic data. For the purpose, new thermodynamic calculation technique with high accuracy, for example, Redlich-Kister type polynomial, should also be targeted at high chromium steel.
Acknowledgments
This study was carried out with the support and advice of the Iron and Steel Institute of Japan, “Clean Cr steel production by slag, inclusion control” research group. We would like to express our deepest gratitude to the Iron and Steel Institute of Japan and its study group.
References
- 1) H. Todoroki and N. Shiga: Proc. Int. Cong. on the Science and Technology of Steelmaking, ISIJ, Tokyo, (2008), 121.
- 2) H. Todoroki and Y. Kobayashi: Proc. Asia Steel 2009 Int. Conf., (Busan), KIMM, Daejeon, (2009), CD-ROM.
- 3) K. Sakata: ISIJ Int., 46 (2006), 1795.
- 4) H. Todoroki, F. Kirihara, Y. Kanbe and Y. Miyazaki: Tetsu-to-Hagané, 100 (2014), 539 (in Japanese).
- 5) H. Fujimura, S. Tsuge, Y. Komizo and T. Nishizawa: Tetsu-to-Hagané, 87 (2001), 707 (in Japanese).
- 6) K. Kimura, S. Fukumoto, G. Shigesato and A. Takahashi: Tetsu-to-Hagané, 98 (2012), 601 (in Japanese).
- 7) T. Koseki and H. Inoue: J. Jpn. Inst. Met., 65 (2001), 644.
- 8) S. H. Seok, T. Miki and M. Hino: ISIJ Int., 49 (2009), 1850.
- 9) J. H. Park, S. B. Lee and H. R. Gaye: Metall. Mater. Trans. B, 39 (2008), 853.
- 10) J. H. Park and H. Todoroki: ISIJ Int., 50 (2010), 1333.
- 11) C. Liu, X. Gao, S. Ueda, M. Guo and S. Kitamura: ISIJ Int., 60 (2020), 1835.
- 12) Z. Deng, Z. Liu, M. Zhu and L. Huo: ISIJ Int., 61 (2021), 1.
- 13) J. Li, G. Cheng, Q. Ruan, J. Li, J. Pan and X. Chen: ISIJ Int., 58 (2018), 1042.
- 14) J. Li, G. Cheng, Q. Ruan, J. Pan and X. Chen: ISIJ Int., 58 (2018), 2280.
- 15) H. Itoh, M. Hino and S. Ban-ya: Tetsu-to-Hagané, 84 (1998), 85 (in Japanese).
- 16) H. Itoh, M. Hino and S. Ban-ya: Tetsu-to-Hagané, 83 (1997), 623 (in Japanese).
- 17) H. Itoh, M. Hino and S. Ban-ya: Tetsu-to-Hagané, 83 (1997), 773 (in Japanese).
- 18) K. Fujii, T. Nagasaka and M. Hino: ISIJ Int., 40 (2000), 1059.
- 19) The Japan Society for the Promotion of Science, the 19th Committee on Steelmaking: Steelmaking Data Sourcebook, Gordon and Breach Science Publications, New York, (1988), 50.
- 20) V. G. Mizin, Y. A. Agejev, A. Y. Zaslaysky, Y. A. Danilovich, S. A. Arehugov and N. A. Tulyn: Proc. 9th Japan-USSR Joint Symp. on Physical Chemistry of Metallurgical Processes, ISIJ, Tokyo, (1983), 92.
- 21) H. Ohta and H. Suito: ISIJ Int., 43 (2003), 1301.
- 22) Q. Han: Proc. 6th Int. Iron Steel Congress, Vol. 1, ISIJ, Tokyo, (1990), 166.
- 23) T. Itoh, T. Nagasaka and M. Hino: ISIJ Int., 40 (2000), 1051.
- 24) M. Nadif and C. Gatellier: Process Technology, Proc. 5th Int. Iron and Steel Congress, ISS, Warrendale, PA, (1986), 741.
- 25) S. K. Jo, B. Song and S. H. Kim: Metall. Mater. Trans. B, 33 (2002), 703.
- 26) C. Liu, X. Gao, S. Ueda and S. Kitamura: ISIJ Int., 59 (2019), 268.
- 27) G. K. Sigworth and J. F. Elliott: Met. Sci., 8 (1974), 298.
- 28) V. I. Yavoiskii, L. P. Volojimorov, V. P. Lujin, N. M. Kapitza and E. B. Teplitzkii: Akad. Nauk SSSR Met., 2 (1974), 14.
- 29) E. B. Teplitskii and L. P. Valdimirov: Russ. J. Phys. Chem., 51 (1977), 831.
- 30) A. P. Gorobetz: Metall. Koksokhim., 69 (1980), 34.
- 31) I. S. Kulikov: Izv. Akad. Nauk Metall., 6 (1985), 9.
- 32) M. Nadif and C. Gatellier: Rev. Metall., Cah. d’Inf. Tech., 83 (1986), 377.
- 33) E. T. Turkdogan: Steel Res., 62 (1991), 379.
- 34) R. Inoue and H. Suito: Metall. Mater. Trans. B, 25 (1994), 235.
- 35) H. Ohta and H. Suito: Metall. Mater. Trans. B, 28 (1997), 1131.
- 36) Q. Han, D. Zhou and C. Xiang: Steel Res., 68 (1997), 9.
- 37) J. D. Seo and S. H. Kim: Steel Res., 71 (2000), 101.
- 38) W. G. Seo, W. H. Han, J. S. Kim and J. J. Pak: ISIJ Int., 43 (2003), 201.
- 39) N. Satoh, T. Taniguchi, S. Mishima, T. Oka, T. Miki and M. Hino: Tetsu-to-Hagané, 95 (2009), 827 (in Japanese).
- 40) J. Gran and D. Sichen: Metall. Mater. Trans. B, 42 (2011), 921.
- 41) S. Gustafsson and P. O. Mellberg: Scand. J. Metall., 9 (1980), 111.
- 42) H. Ohta and H. Suito: The Final Report of Ultra Clean Steel Research Group, Thermodynamics of Production of Ultra Clean Steel, ISIJ, Tokyo, (1999), 66.
- 43) S. W. Cho and H. Suito: ISIJ Int., 34 (1994), 177.
- 44) S. Dimitrov, A. Weyl and D. Janke: Steel Res., 66 (1995), 3.
- 45) J. D. Seo, S. H. Kim and K. R. Lee: Steel Res., 69 (1998), 49.
- 46) H. R. Rein and J. Chipman: Trans. Met. Soc. AIME, 233 (1965), 415.
- 47) O. Knacke, O. Kubaschewski and K. Hesselmann: Thermochemical Properties of Inorganic Substances, 2nd ed., Springer-Verlag, Berlin, (1991).
- 48) M. Hojo, R. Nakao, T. Umezaki, H. Kawai, S. Tanaka and S. Fukumoto: ISIJ Int., 36 (1996), S128.
- 49) J. W. Kim, S. K. Kim, D. S. Kim, Y. D. Lee and P. K. Yang: ISIJ Int., 36 (1996), S140.
- 50) W. Y. Cha, D. S. Kim, Y. D. Lee and J. J. Pak: ISIJ Int., 44 (2004), 1134.
- 51) Y. Ehara, S. Yokoyama and M. Kawakami: Tetsu-to-Hagané, 93 (2007), 208 (in Japanese).
- 52) Y. Ehara, S. Yokoyama and M. Kawakami: Tetsu-to-Hagané, 93 (2007), 475 (in Japanese).
- 53) B. Harkness and D. Dyson: Proc. METEC Cong. ’94, (Dusseldorf), VDEh, Dusseldorf, (1994), 70.
- 54) W. Yang, L. Zhang, X. Wang, Y. Ren, X. Liu and Q. Shan: ISIJ Int., 53 (2013), 1401.
- 55) Y. B. Kang and J. H. Lee: ISIJ Int., 57 (2017), 1665.
- 56) F. Ruby-Meyer, J. Lehmann and H. Gaye: Scand. J. Metall., 29 (2000), 206.
- 57) H. Matsuura, C. Wang, G. Wen and S. Sridhar: ISIJ Int., 47 (2007), 1265.
- 58) W. Y. Kim, J. O. Jo, C. O. Lee, D. S. Kim and J. J. Pak: ISIJ Int., 48 (2008), 17.
- 59) M. A. Van Ende, M. Guo, R. Dekkers, M. Burty, J. Van Dyck, P. T. Jones, B. Blanpain and P. Wollants: ISIJ Int., 49 (2009), 1133.
- 60) J. Li and G. Cheng: ISIJ Int., 59 (2019), 2013.
- 61) C. Wagner: Thermodynamics of Alloys, Addison-Wesley, Cambridge, MA, (1952), 47.
- 62) L. S. Darken: Trans. Metall. Soc. AIME, 239 (1967), 80.
- 63) L. S. Darken: Trans. Metall. Soc. AIME, 239 (1967), 90.
- 64) M. Hillert and L.-I. Staffansson: Acta Chem. Scand., 24 (1970), 3618.
- 65) N. Saunders and A. P. Miodownik: Calphad (Calculation of Phase Diagrams), A Comprehensive Guide, Pergamon, Oxford, UK, (1998), 91.
- 66) T. Miki and M. Hino: ISIJ Int., 45 (2005), 1848.
- 67) R. Yamamoto, H. Fukaya, N. Satoh, T. Miki and M. Hino: ISIJ Int., 51 (2011), 895.
- 68) Y. Bi, A. V. Karasev and P. G. Jönsson: ISIJ Int., 53 (2013), 2099.
- 69) H. Fukaya, S. Suzuki, K. Kajikawa, B. Blanpain, M. Guo and A. Malfliet: JSW Tech. Rev., 69 (2018), 9.


