2. Experimental Procedures
JIS-S35C commercial structural carbon steel (0.35C, 0.2Si, 0.72Mn, 0.016P, 0.015S, 0.01Cu by mass%) was used in this study. A ferrite–pearlite microstructure was obtained by austenitization at 1273 K for 3.6 ks followed by furnace cooling. An optical microscope was used for microstructure observation. A sample was prepared by standard mechanical grinding and polishing procedures, and final polishing using an alumina polishing suspension. The sample was additionally etched in 5% Nital for about 10 s in order to reveal the microstructure.6,7,9)
A round tensile test specimen with a diameter of 3.5 mm and a gage length of 25 mm was prepared, and tensile tests were conducted at a strain rate of 3.3×10⁻² s−1 at various temperatures between 77 and 773 K using a gear-driven-type tensile test machine. The deformation temperatures were controlled by using liquid nitrogen (77 K), an environmental chamber (123–373 K) and a heating furnace (473–573 K).13) σ and ε after the maximum load point were calculated by the following equations:6,7,8,14,15)
|
σ=
P
π
a
2
(
1+
2R
a
)
log(
1+
a
2R
)
| (1) |
where
P is the load,
a0 is the initial radius of the cross section,
a is the radius of the neck section and
R is the radius of the curvature of the neck profile. These values were obtained from the tensile test specimens, which were interrupted at an arbitrary
ε after the maximum load point.
6,7) In the measurements of
R, the appearance of the neck profile was observed through a digital microscope and the contour of the necked region was approximated by the arc of a circle.
9)
After the tensile tests, the fracture surface of the specimens and the cross-sectional planes parallel to the tensile direction at various ε levels were observed by scanning electron microscopy (SEM). Here, the samples for SEM observation of the cross-sectional planes parallel to the tensile direction were prepared by the same method as in the case of the microstructure observation using an optical microscope.6,7,9) The cross-sectional planes parallel to the tensile direction were also observed by using a SEM equipped with a measurement system of electron back scattering diffraction (EBSD). The observation surface for EBSD measurement was polished with a solution of 10 vol% perchloric acid + 90 vol% acetic acid. The EBSD pattern was analyzed as the possible phases were set as body-centered cubic (BCC), and the scanning pitch was 20–50 nm with an acceleration voltage of 15 kV.
3. Results and Discussion
3.1. Temperature Dependence on Mechanical Properties of Ferrite–Pearlite Steel
Figure 1 shows an optical micrograph of the FP steel. The volume fraction of pearlite is 42% and the average ferrite grain size measured by the linear intercept method is 25 μm. Figure 2 shows the s–e curves of the FP steel at various temperatures. The s value increased with a decrease in the temperature and the test specimen at 77 K fractured in a brittle manner. Figure 3 shows the lower yield strength (LYS), tensile strength (TS), uniform elongation (U.El) and total elongation (T.El) as a function of deformation temperature. When the deformation temperature was reduced, LYS and TS increased and the difference between LYS and TS became smaller. The U.El and T.El decreased when the yield ratio was close to 1 at temperatures below about 200 K. On the other hand, when the deformation temperature was increased from 673 to 773 K, the TS increased but the U.El and T.El decreased. This seems to be associated with the blue brittleness.5) In carbon steels, the flow stress increased and the elongations decreased at temperatures between 600 and 800 K, and those temperatures depend on the carbon content.5) This is associated with solute carbon or nitrogen and is considered to be a type of strain aging. The change in flow stress due to the blue brittleness is also influenced by the strain rate and becomes larger at a smaller strain rate.5) Because the strain rate was 3.3×10⁻² s−1 in the present study, the increment of the flow stress due to the blue brittleness seems to be smaller. Figure 4 shows the s–e curves at strain rates of 3.3×10⁻⁴ s−1 (solid lines) and 3.3×10⁻² s−1 (dashed lines) at 673 and 773 K. s was larger at the strain rate of 3.3×10⁻⁴ s−1 at both temperatures, and a serrated flow was observed in the s–e curves at 3.3×10⁻⁴ s−1. These results indicate that the increment of the flow stress due to the blue brittleness was larger at lower strain rates.5) On the other hand, as is discussed later, the effect of the blue brittleness on the mechanical properties was applicable for TS, U.El and T.El in the present FP steel, but the reduction of area was almost the same at temperatures higher than 296 K. Figure 5 shows the area fraction of brittle fracture and the reduction of area as a function of deformation temperature. When the temperature was reduced, the area fraction of brittle fracture increased and the reduction of area decreased. The reduction of area decreased gradually and a river pattern was observed below 223 K. The reduction of area decreased to less than 5% at 77 K. It can be seen in Fig. 5 that the area fraction of brittle fracture was 50% at 160 K. The effect of the temperature on the total elongation, as seen in Fig. 3, differed from the effect on the reduction of area. The effect of deformation temperature on the tensile deformation behavior up to the fracture, which is also related to the total elongation and the reduction of area, is discussed in the next section based on the σ–ε relationship up to the plastic deformation limit.
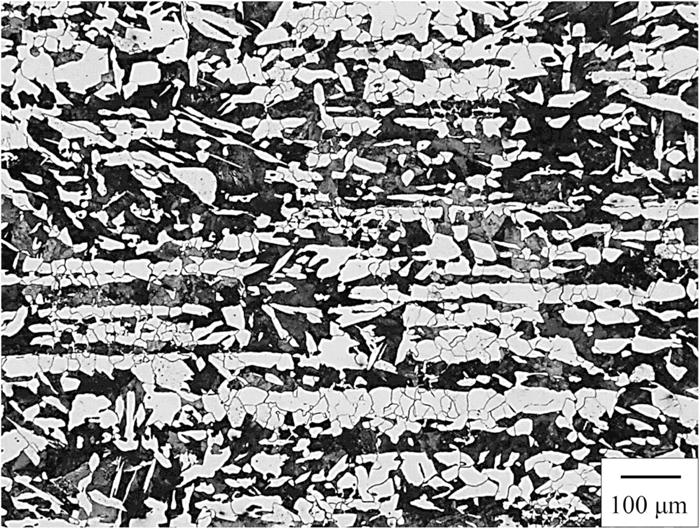
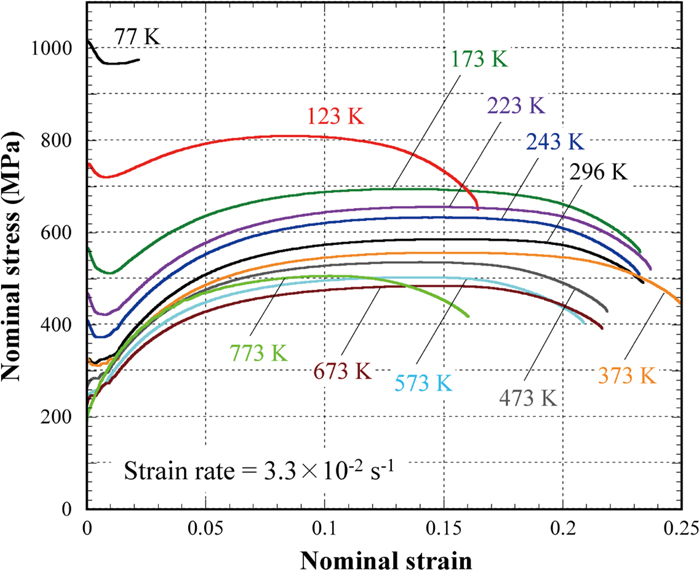

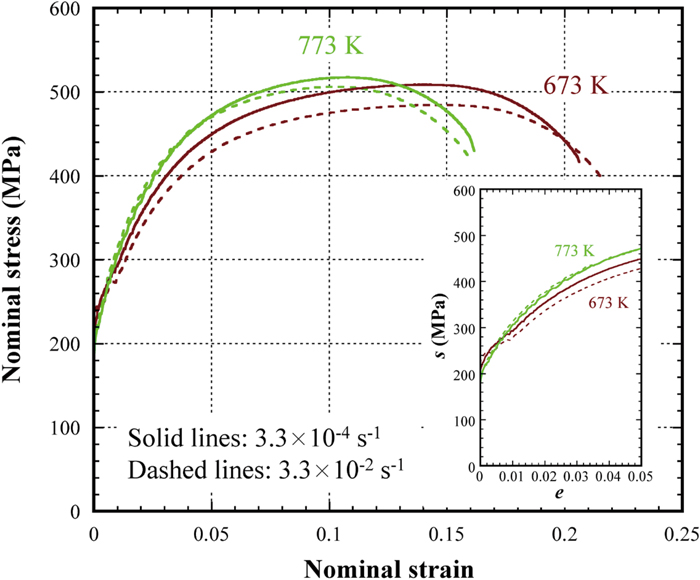
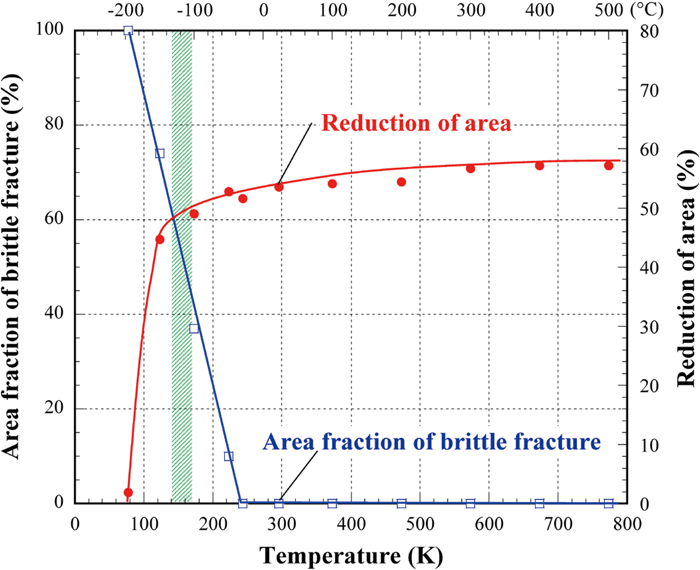
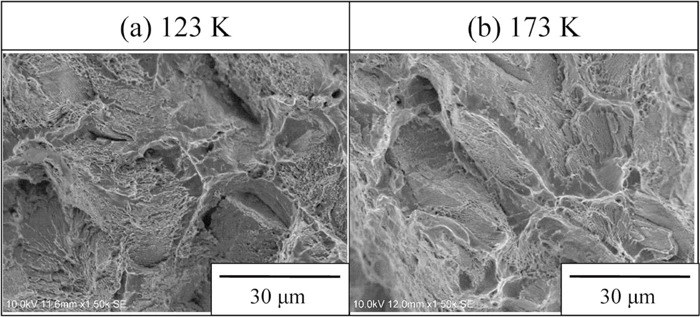
Figure 6 shows the fracture surfaces of the FP steel at various deformation temperatures between 77 and 773 K. The insets in the upper left corners are low-magnification images of the fractured specimen at each temperature. Full dimples can be seen at temperatures higher than 243 K and dimples of almost the same size were observed in most cases. On the other hand, a river pattern was observed in part of the fracture surfaces at temperatures below 223 K. As described earlier, the change in the fracture surface with a decrease in the temperature is associated with the reduction of area below 223 K, as seen in Fig. 5. Figure 7 shows high-magnification images of microvoid coalescence at 123 K (a) and 173 K (b), at which the area fraction of brittle fracture is greater than 40%. Those microvoid coalescences seem to be formed by a ductile fracture mechanism and consist of small regions formed by the pearlite lamellae. Such microvoids were also observed in the fracture process zone of pearlite steel.16) The test specimen exhibited a brittle fracture immediately after yielding at 77 K, and only the river pattern was observed. Based on the low-magnification image of the fracture surface, it was found to be an intergranular fracture at 77 K.

Figure 8 shows the σ–ε relationship up to the plastic deformation limit in the FP steel at various temperatures. Here, the plots represent the σ and ε values estimated using Eqs. (1) and (2), and the lines represent the calculated ones by using the following Hollomon equation:17)
where
K and
n are constants, respectively.
17,18,19) The values of
K and
n at each temperature are summarized in
Table 1. The
σ value at a given
ε increased with a decrease in the temperature. The
ε at the plastic deformation limit (
εpdl) decreased at temperatures below about 200 K, and the
σ at the plastic deformation limit (
σpdl) at temperatures between 77 and 173 K were almost the same. As shown in
Figs. 3 and
4, the
σ at 773 K were larger than those at 673 K up to the
ε of about 0.2 because of the blue brittleness. However, at
ε greater than 0.2, the
σ became larger at 673 K. The effect of blue brittleness on
σ was larger in the early stage of tensile deformation until
ε of about 0.2.
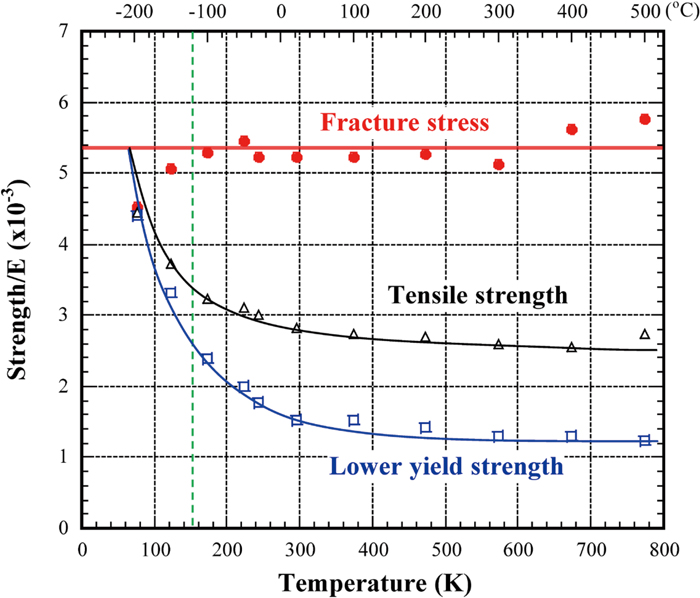
Figure 9 shows the fracture stress (
σZ), LYS and TS as a function of deformation temperature. Here,
σZ was estimated as the maximum axial stress at the center of the necking section and was calculated by the following equation:
8,14,15)
|
σ
Z
=σ(
1+ln(
1+
a
2R
)
)
| (4) |
In
Fig. 9,
σZ, LYS, and TS are divided by Young’s modulus (
E) at each temperature.
20) As can be seen, the temperature dependence of
σZ/
E in the present FP steel was small, and in particular,
σZ/
E between 160 and 600 K was almost the same as 5.4×10
−3, being independent of deformation temperature. This means that the present FP steel fractured when
σ was equivalent to
σZ, and
σZ can be considered as an intrinsic fracture stress value that is determined by each material.
21) A lot of investigations based on the brittle fracture stress have been reported in the past studies,
1,4,10,21) and there is little study about the fracture stress in ductile fracture and its temperature dependence.
8) Otsuka
et al.4) investigated ductile and brittle (cleavage) fractures of 0.16C FP steel. They reported that the critical cleavage fracture stress was constant and independent of the temperature and pre-strain, and that the critical
ε for ductile fracture was almost the constant of temperature. On the other hand, as seen in
Fig. 8,
εpdl of the FP steel decreased gradually with a decrease in the temperature and decreased severely at temperatures lower than 200 K. Such changes in
εpdl are correlated with the reduction of area and area fraction of brittle fracture. However, the temperature dependence of
σZ was small, and the values between 160 and 600 K were particularly almost the same, being independent of deformation temperature.
Figure 9 is an approach based on mean stress field and shows that
σZ as the average stress value at the center of the necking section is the threshold value associated with fracture of the present FP steel. On the other hand, fracture mechanisms based on the localized stress field have been mainly discussed in the past studies. It can be expected that
σZ based on mean stress field will lead to a parameter to determine fracture of materials. Thus, further discussions based on
σZ using other steels and materials are necessary.
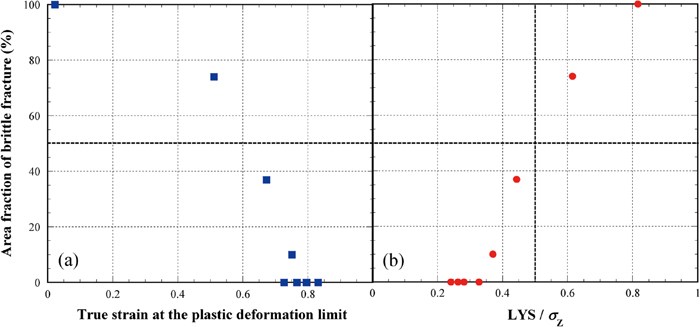
Figure 10 shows the area fraction of brittle fracture as a function of
εpdl (a) and the ratio of LYS to
σZ (b). The area fraction of brittle fracture increased with an increase in LYS/
σZ, whereas
εpdl at the area fraction of brittle fracture of 0% (ductile fracture) was not necessarily constant. Judging from
Figs. 9 and
10, the critical fracture stress, which is independent of deformation temperature, is applicable to the condition of plastic deformation limit in the present FP steel. Furthermore, it is interesting that the area fraction of brittle fracture was 50% when the ratio of LYS to
σZ was 0.5, as shown by the dashed line in
Fig. 10(b). In the past studies, the ductile-to-brittle transition in body-centered cubic steel can be understood as a result of competition between yield strength and brittle fracture stress.
21,22) Considering the experimental results in previous and present studies, the relationship between the fracture stress and yield strength as seen in
Fig. 10(b) may be associated with the area fraction of brittle fracture and the change in stress fields.
Table 1. The values of
K and
n in the Hollomon equation used in the calculations of true stress–true strain curves in
Fig. 8.
| Temperature (K) | K (MPa) | n |
|---|
| 77 | 1200 | 0.05 |
| 123 | 1120 | 0.1 |
| 173 | 1040 | 0.13 |
| 223 | 1000 | 0.14 |
| 296 | 950 | 0.18 |
| 673 | 900 | 0.25 |
| 773 | 850 | 0.21 |
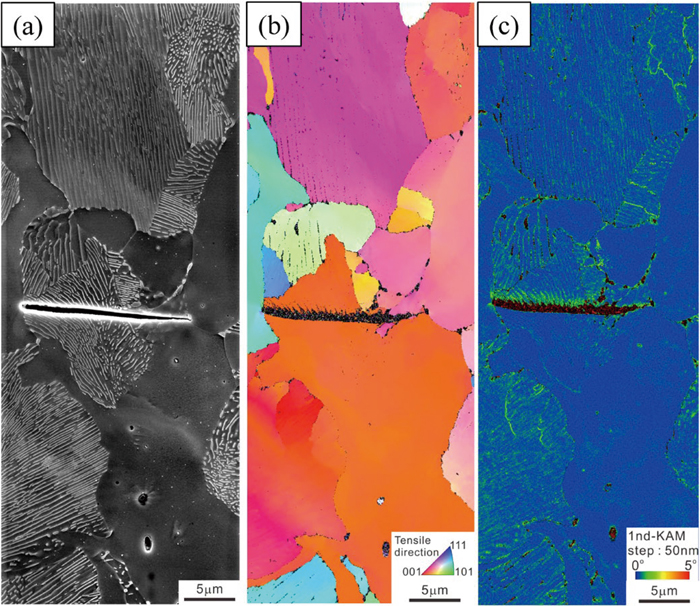
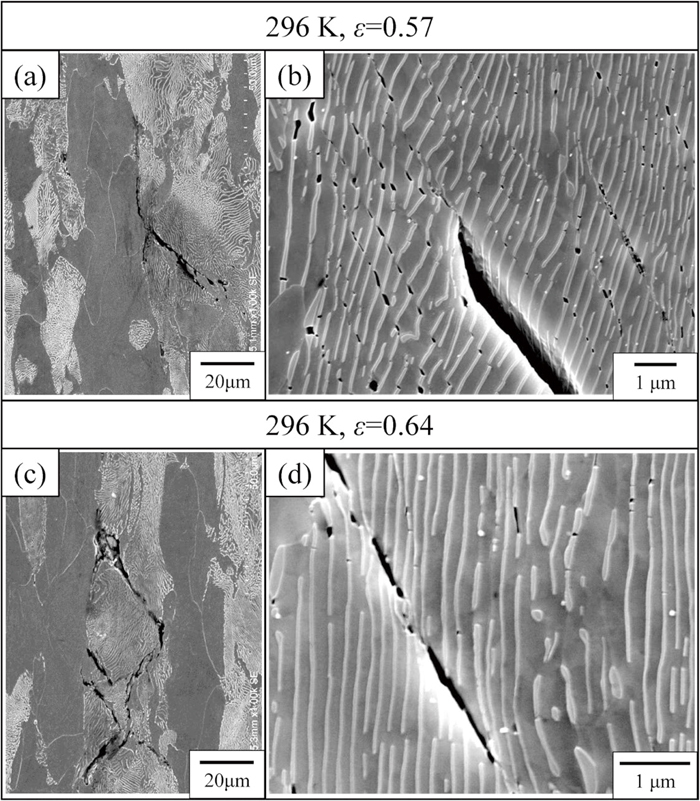
Figure 11 shows SEM micrographs of the cross-sectional planes parallel to the tensile direction at ε of 0.57 (Figs. 11(a), 11(b)) and 0.64 (Figs. 11(c), 11(d)) at 296 K. In this section, the vertical axis in the SEM micrographs shows the tensile direction. Microcracks were observed in pearlite and stopped at the interface between the ferrite and pearlite or the pearlite colony boundary (Figs. 11(a) and 11(c)).6,16,23) From the high magnification images as seen in Figs. 11(b), the straight arrays of voids whose size is compatible with the thickness of cementite plate appeared, and these were aligned along the direction with around 30° from the tensile direction (vertical of the image).16,23) These voids were located at the kinked parts of cementite and a few of the kinked cementite kept connection without any failure structure. This morphology implies that the shear banding brings the formation of microcrack at the cementite. Microcracks were observed occasionally in the pearlite colonies having lamellae orientated close to the tensile direction.6,23,24,25) At the higher strained part as shown in Fig. 11(c), the macroscopic cracks were formed by linking up of the microcracks and the straight arrays of voids were less observed.
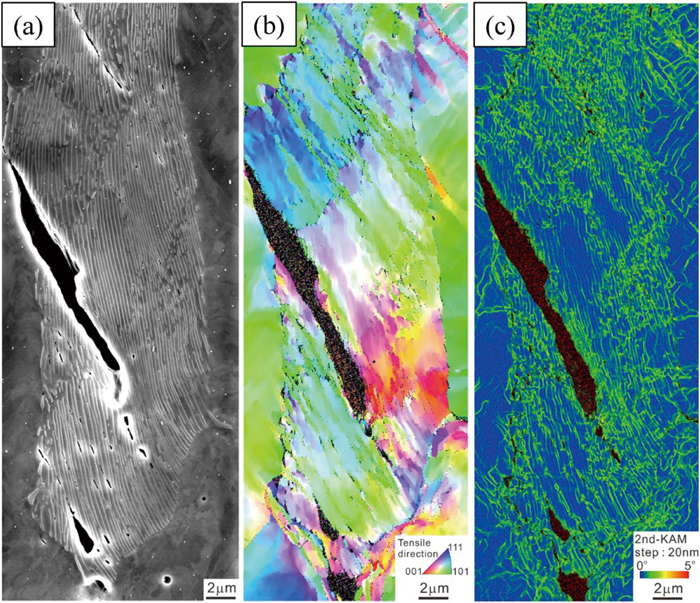
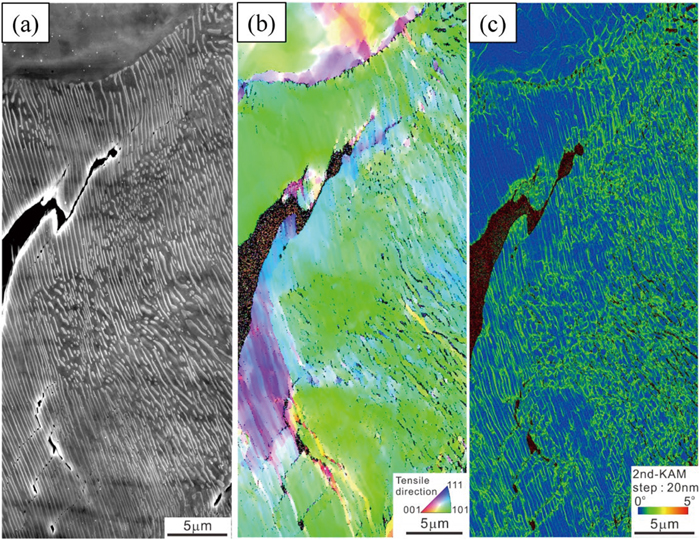
Figures 12 and 13 show SEM images and the orientation color maps obtained by EBSD measurements of the samples tested at 296 K at ε of 0.57 and 0.64, respectively. The results of the EBSD measurements were presented by both the color map of the crystallographic orientation parallel to the tensile direction (b), and the kernel average misorientation (KAM) map (c).26,27) Several colonies in which pearlite structure has the same longitudinal direction were observed within one block with the identical crystallographic orientation.24,28) In the SEM images, both the microcrack and their aggregations were observed. From the orientation color maps, the crack with large opening and the junction of these cracks with different elongated directions accompanies with color-gradient indicating large local misorientaions. The junction of the microcracks also shows the relative large KAM values. This seems to indicate that the local plastic deformation is caused by the growth of macroscopic cracks since the work hardening brings larger KAM values.26,27)
Figures 14 and 15 show SEM images, the orientation color maps and the KAM maps of the samples deformed at 123 and 77 K, respectively. The number of microcracks decreased with a decrease in temperature and the microcracks of cementite lamellae as seen in Figs. 11(b) and 11(d) were also observed. The changes of orientations for ferrite near microcracks at 123 K (Fig. 14(b)) were larger than those at 296 K (Figs. 12(b) and 13(b)) despite the applied ε was smaller at 123 K. As seen in Fig. 7, the microvoid coalescences at 123 K consist of small regions formed by the pearlite lamellae.16) The propagation of microcracks in Fig. 14 seems to have resulted in the fracture surface seen in Fig. 7(a).

In Fig. 15, the propagating direction of crack at 77 K looked perpendicular to the tensile direction and this morphology was different with those at other temperature. The orientation color (b) around the right-side edge of the crack appears red indicating the tensile direction is nearly parallel to 001. This is consistent with the well-known fact that the cleavage fracture surface in BCC metal is usually parallel to {001}. So that the fracture mechanism of the samples deformed at 77 K can be regarded as brittle fracture.
From the SEM observations of the cross-sectional planes parallel to the tensile direction at various temperatures, the introduction and propagation of microcracks were observed in the pearlite colonies except for the brittle fracture in the present FP steels. In the ductile fracture, the microcracks were observed in the cementite plates as well as lamellar tearing in the pearlite colonies16,23) and the orientation of ferrite near microcracks were changed.