Abstract
Pearlite spheroidization is substantially a spatial-geometric evolution of cementite. In this study, a persistent homology analysis was employed to characterize the topological features of cementite component of pearlite steel, through which the lamellar and spherical pearlite microstructures were successfully distinguished. Because the mechanical performance of pearlite steel is highly sensitive to the cementite configuration, an inverse conversion of persistent-homology digital data to an image for some properties of interest was proposed by using Bayesian optimization. The proposed microstructural optimization approach paves a way to interpret persistent-homology information in metallurgy and presents the feasibility of data-driven persistent-homology-based property predictions and microstructural optimization.
1. Introduction
Eutectoid pearlite possesses a typical lamellar structure consisting of interpenetrating ferrite and cementite crystals, which induces high mechanical strength in pearlite steel.1) Because microstructural configurations have significant effects on the properties of interest, spheroidization annealing is often employed to decompose the lamellar configuration of pearlite steels into a globular configuration to improve ductility, toughness, fatigue life, and manufacturing formability.2,3,4,5) Owing to the microstructural evolution during annealing, our previous study experimentally demonstrated that the pearlite spheroidization behavior is sensitive to the initial configuration of cementite lamellae.6)
The traditional experiment-based microstructural characterization is mostly performed by stereological measurements, which highly depend on prior metallurgical expertise and often lead to significant individual errors. With the launch of artificial intelligence in materials science, machine-learning-based approaches have been increasingly applied to microstructure identification,7) recognition,8,9) detection,10) etc., which efficiently overcome the limitations of the experiment-based characterization. Nevertheless, most of such machine-learning-based microstructural analyses lack an explicit quantitative strategy of the identified microstructural features, and thus have a difficulty in establishing a data-driven microstructure-property linkage.
Pearlite spheroidization is basically a spatial geometric evolution of cementite, which readily involves topological data analyses and their derived methodologies.11,12,13,14,15) One promising method for topological analyses is persistent homology, which can capture potential topological features from a complex data space and concurrently provides a quantitative definition of the microstructure.15) Therefore, a data-driven persistent-homology-based approach considering property predictions and microstructural optimization has been proposed in our previous studies,16,17) which could reveal the materials’ potential properties and their corresponding microstructures. However, the achieved microstructures track with the digital data regarding persistent homology, which still does not provide an explicit definition of metallurgical features. Thus, there is a need for further advancement in converting persistent-homology data to microstructural images for a better understanding of the relationship between the microstructure and properties.
Pearlite spheroidization conforms to one of the benefits of persistent homology, which is to present the geometrical evolution under a given data space. Thus, persistent-homology analysis was employed here to further characterize the topological features of pearlite microstructure. Furthermore, based on the topological information, a data-driven microstructural optimization approach for converting digital data to images was proposed using the Bayesian optimization.
2. Materials and Methods
The materials studied in this work were achieved in the previous work.6) The chemical composition of the steel was 0.8 mass% C–Fe. Hot-rolled steel samples were reaustenitized at 1200°C for 30 min, followed by furnace cooling to room temperature at a cooling rate of 1°C/s. The samples were subsequently isothermally annealed at 700°C for 0, 1 and 6 h, followed by furnace cooling at 1°C/s down to room temperature to achieve pearlite microstructures. The mechanically polished samples were etched with 3 vol.% nitrate alcohol used for microstructure observation.
The microstructure was observed by scanning electron microscopy (SEM). The obtained SEM images were processed into gray scale, followed by conversion into a binary mode using ImageJ. The threshold value was determined by threshold = (average background + average objects)/2, where ferrite and cementite phases were used as background and object, respectively.
The binarized images were subsequently subjected to persistent homology analysis for a further microstructural characterization, in which cementite was used as the analysis target. Figure 1 illustrates persistent homology. The under-studied data space is represented by some independent but animated data points (Fig. 1(a)); as these animated points grow, they become relative to one another (Fig. 1(b)); hereafter a ring relation generates termed “birth” (Fig. 1(c)); when the ring disappears, termed “death” (Fig. 1(d)). Persistent diagram records all the life (dbirth, ddeath) (Fig. 1(e)).
To acquire suitable data patterns for a data-driven approach, a persistent image (PI)18) was employed to vectorize the extracted topological information. PI was estimated using the following equation:
|
PI=arctan(
d
death
-
d
birth
)
K,
| (1) |
where
K is the kernel density.
19) Here, the persistent diagram is evenly divided into 30 × 30 bins to estimate
K,
i.e.,
PI was calculated as a 900-dimensional vector.
As known, high-dimensional data often cause overfitting in machine learning. The common dimensionality reduction techniques mainly include principal component analysis (PCA), t-distributed stochastic neighbor embedding (t-SNE), and uniform manifold approximation and projection (UMAP). PCA normalizes the high-dimensional dataset with linearly correlated variables and then projects the data in a low-dimensional space while retaining most of the variation in the dataset. Compared with PCA, t-SNE is a nonlinear dimensionality reduction technique that retains the original information as much as possible. t-SNE reduces dimensionality while trying to find clusters by keep similar observations close and dissimilar observations apart. UMAP is a state-of-art manifold learning and dimension reduction algorithm created in 2018.20) Similar with t-SNE, UMAP is also a nonlinear dimensionality reduction technique but with higher processing speed and better visualization. By comparison, UMAP was employed for dimensionality reduction here.
Microstructure optimization was performed by the Bayesian optimization. The Matern kernel21) was used for the Gaussian process; the initial mean and variance were set to be values of 0 and 1e-10, respectively; 10 initial points were used to start the optimization. The expected improvement (EI) function was used as the acquisition function, defined as
|
EI(
x
)
=𝔼[
f(
x
)
-f(
x
t
+
)
]
| (2) |
where
x,
x
t
+
, and
f are the set of optimized parameters, the current optimal set of parameters, and a black-box function, respectively. A potential microstructure image with the maximum output of acquisition function could be generated at one loop.
3. Results and Discussion
3.1. Microstructural Characterization with Persistent Homology
Figures 2(a)–2(c) shows the SEM images (450 × 300 pixels) of the samples without annealing, annealed at 700°C for 1 and 6 h, respectively. The samples presented distinguished pearlite microstructures, where the lamellar configuration was gradually spheroidized as the annealing time increased. Hereafter, persistent homology analysis was performed to further characterize the microstructure. As sufficient data observations are critical for performing a data-driven approach, each original microstructural image was split out four pieces to achieve more observations. Figures 2(d)–2(e) shows the image pieces under a binary mode, where the cementite component is marked in black.

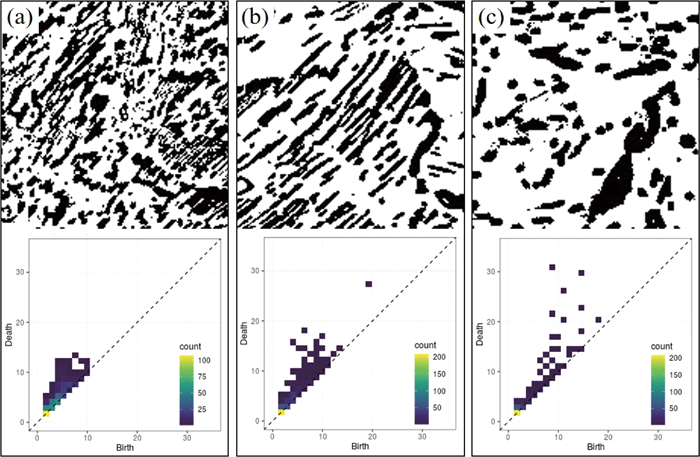
The split pieces (150 × 150 pixels) were used as the inputs for the persistent-homology analysis, and the topological features of cementite were computed with outputs of (dbirth, ddeath) address recorded in the persistent diagram. Figure 3 illustrates the studied images with different annealing times and their corresponding persistent diagrams. Comparing the microstructure and persistent diagram, the fine lamellar configuration (Fig. 3(a)) and spherical configuration (Fig. 3(c)) were characterized as short and long lives, respectively, which provides a protocol for identifying the pearlite microstructure with persistent homology.
As mentioned earlier, to acquire suitable data patterns, PIs were computed to vectorize the topological information (dbirth, ddeath). The achieved high-dimensional PI data of the studied microstructures were dimensionality reduced and visualized using UMAP algorithm. It should be pointed out that the learning dataset is comprised by 12 observations under three annealing times. Since these microstructures have been well experimentally distinguished previously,6) the all data were used for training a classification model, so as to further identify the effectiveness of persistent homology on microstructure characterization. Figure 4 shows a two-dimensional UMAP map, which demonstrates that the UMAP successfully classified and recognized pearlite microstructures with different configurations based on persistent homology information. This result would open up a perspective for data-driven microstructure recognition by combining persistent homology and UMAP.

The previously proposed data-driven persistent-homology-based property predictions and microstructural optimization16,17) could obtain desired properties, such as high ductility or good manufacturing formability, and the corresponding microstructure. However, the achieved microstructure tracks with digital data regarding persistent homology, which does not provide an explicit definition of metallurgical features. To better understand the materials paradigm, it is necessary to further define the persistent-homology-based microstructure. As mentioned earlier, pearlite spheroidization is beneficial to the ductility, toughness, fatigue life, and manufacturing formability of pearlite steels. Consequently, based on the present pearlite microstructures, an inverse microstructural optimization that converts persistent-homology digital data to microstructure images was conducted in this study using Bayesian optimization.
Figure 5 shows the optimization procedure. The optimization started from an arbitrarily created initial image. Because pearlite spheroidization generates a bimodal lamellar-spherical microstructure, five parameters, p1, p2, p3, p4, and p5, were designed to control the configuration, as shown in Fig. 6. Subsequently, the PI of the initial image (PIinitial) was computed. The purpose of this optimization is to find the microstructure that tracks with a target property from the digital data. Thus, PIinitial was correlated with the target PI (PItarget) through a Loss function (PIinitial, PItarget) defined as
|
Loss=
∑
i=0
n
(
P
I
initial
(
i
)
-P
I
target
(
i
)
)
2
,
| (3) |
where
i and
n denote the variable and total number of variables of a
PI vector, respectively, and
n is determined by the number of bins during
K estimation,
i.e.,
n is 900 in this study. Therefore, a new vector was generated regarding the configuration parameters of the initial image and its
Loss, expressed as (
p1,
p2,
p3,
p4,
p5,
Loss). This vector was thereafter fed to Bayesian optimization algorithm with a learning target of minimizing
Loss by optimizing
p1,
p2,
p3,
p4, and
p5. After Bayesian optimization, an image plotted by the optimized
p1,
p2,
p3,
p4, and
p5 was output when the
Loss was small enough, otherwise, the optimized
p1,
p2,
p3,
p4, and
p5 were fed back to update the configuration parameters, and then, the above loop was executed until the
Loss was small enough.


A spherical-configuration microstructure that improves the ductility and formability of pearlite steels was used as the optimizing target. As a means to well verify the optimized microstructure, a known image regarding the microstructure with a spherical configuration annealed for 6 h was used as the target (Fig. 7(a)). Figure 7(b) shows the initial image with the starting configuration parameters shown in Fig. 7(d), and the Loss was calculated as 7.67. Figure 7(c) shows an output image after 100 loops, which presented a spherical configuration with a reduced Loss of 3.20. By visual comparison, the initial image was successfully updated toward the target image, suggesting the good potential of the proposed approach. With regard to the image generation method of the initial image (Fig. 7(b)) and output image (Fig. 7(c)), they were generated on a starting white-background layer (150 × 150 pixels), followed by random plotting of configurations according to their corresponding configuration parameters, as illustrated in Fig. 6.

Notably, since persistent homology could demonstrate the spatial evolution of cementite, pearlite microstructure was studied here to illustrate the persistent-homology-based microstructure characterization. In addition to microstructural quantification, persistent homology presents a good potential in microstructural segmentation. As known, microstructural segmentation often involves recognition of the textures in microstructure images caused by different gray levels. Persistent homology could capture such texture-based microstructural features by a smart watershed-definition in life time (ddeath-dbirth) for each microstructural component. On the other hand, the configuration parameters and Loss function of microstructure optimization were roughly designed here. Smart designs of the configuration parameters and Loss function can further improve the optimization performance. The proposed inverse conversion paves the way to interpret persistent-homology information in metallurgy, and thus, consummate the data-driven persistent-homology-based property predictions and microstructure optimization approach proposed previously.16,17)
Furthermore, it is well known that convolutional neural network (CNN)-based deep learning family presents a very eye-catching performance in digital image processing. Recently, a deep convolutional generative adversarial network (DCGAN) has been proposed for use in image generation.22) DCGAN works through adversary between a generator and a discriminator. The former acts as an artist to create images that look real. The latter acts as a critic to identify the true and false of the created images. When the discriminator cannot identify the true and false of the generated images, the training reaches balance. However, a number of available image data are critical for training a good image-generation model. Because of limited microstructural images, a simplified independent design approach was proposed in the present study. Five parameters were designed to control the configuration of images acting as the generator, and the Bayesian optimization identifies the configuration of the generated images acting as the discriminator. However, just five configuration parameters are indeed insufficient to generate the desired digital images. Consequence, DCGAN will be employed to further carry out the image generation task to serve the data-driven property predictions and microstructure optimization approach proposed previously.16,17)
4. Summary
The pearlite microstructure was characterized using persistent homology. The persistent homology analysis revealed that the lamellar and spherical cementite components have short- and long-life characteristics, respectively, which provide a novel protocol for identifying pearlite microstructure. According to the protocol, pearlite microstructures with different configurations were further classified and identified using UMAP. Based on the persistent-homology information, an inverse conversion of digital data to an image was performed using the Bayesian optimization algorithm, which optimized the microstructure toward a certain target image. The inverse conversion provides persistent-homology information with a metallurgical interpretation route.
Contributions
The authors contributed equally: Kazuki Kiyomura conducted the study; Zhi-Lei Wang wrote the manuscript; Toshio Ogawa and Yoshitaka Adachi supervised the study.
References
- 1) E. M. Taleff, J. J. Lewandowski and B. Pourladian: JOM, 54 (2002), 25. https://doi.org/10.1007/BF02700982
- 2) H. Rastegari, A. Kermanpur, A. Najafizadeh, D. Porter and M. Somani: J. Alloy. Compd., 626 (2015), 136. https://doi.org/10.1016/j.jallcom.2014.11.170
- 3) H. Hwang and B. C. De Cooman: Steel Res. Int., 87 (2016), 112. https://doi.org/10.1002/srin.201400591
- 4) K. H. Kim, S. D. Park, J. H. Kim and C. M. Bae: Met. Mater. Int., 18 (2012), 917. https://doi.org/10.1007/s12540-012-7002-3
- 5) Z. Lü, H. Zhang, Q. Meng, Z. Wang and W. Fu: J. Iron Steel Res. Int., 23 (2016), 145. https://doi.org/10.1016/S1006-706X(16)30026-7
- 6) Y. T. Wang, Y. Adachi, K. Nakajima and Y. Sugimoto: Acta Mater., 58 (2010), 4849. https://doi.org/10.1016/j.actamat.2010.05.023
- 7) J. Gola, J. Webel, D. Britz, A. Guitar, T. Staudt, M. Winter and F. Mücklich: Comput. Mater. Sci., 160 (2019), 186. https://doi.org/10.1016/j.commatsci.2019.01.006
- 8) D. L. Naik, H. U. Sajid and R. Kiran: Metals, 9 (2019), 546. https://doi.org/10.3390/met9050546
- 9) K. Tsutsui, H. Terasaki, K. Uto, T. Maemura, S. Hiramatsu, K. Hayashi, K. Moriguchi and S. Morito: Mater. Today Commun., 25 (2020), 101514. https://doi.org/10.1016/j.mtcomm.2020.101514
- 10) M. Müller, G. Stanke, U. Sonntag, D. Britz and F. Mücklich: Metallogr. Microstruct. Anal., 9 (2020), 709. https://doi.org/10.1007/s13632-020-00676-9
- 11) G. Carlsson: Bull. Am. Math. Soc., 46 (2009), 255. https://doi.org/10.1090/S0273-0979-09-01249-X
- 12) H. Edelsbrunner, D. Letscher and A. Zomorodian: Proc. 41st Annual Symp. on Foundations of Computer Science, IEEE, Piscataway, NJ, (2000), 454. https://doi.org/10.1109/SFCS.2000.892133
- 13) A. Zomorodian and G. Carlsson: Discrete Comput. Geom., 33 (2005), 249. https://doi.org/10.1007/s00454-004-1146-y
- 14) A. Hirata, L. J. Kang, T. Fujita, B. Klumov, K. Matsue, M. Kotani, A. R. Yavari and M. W. Chen: Science, 341 (2013), 376. https://doi.org/10.1126/science.1232450
- 15) H. Edelsbrunner and J. Harer: Computational Topology: an Introduction, American Mathematical Society, Providence, (2010), 178.
- 16) Z. L. Wang, T. Ogawa and Y. Adachi: Adv. Theory Simul., 3 (2020), 1900227. https://doi.org/10.1002/adts.201900227
- 17) Z. L. Wang, T. Ogawa and Y. Adachi: Adv. Theory Simul., 3 (2020), 2000040. https://doi.org/10.1002/adts.202000040
- 18) H. Adams, T. Emerson, M. Kirby, R. Neville, C. Peterson, P. Shipman, S. Chepushtanova, E. Hanson, F. Motta and L. Ziegelmeier: J. Mach. Learn. Res., 18 (2017), 1. https://jmlr.org/papers/v18/16-337.html
- 19) S. J. Sheather and M. C. Jones: J. R. Stat. Soc. Ser. B, 53 (1991), 683. https://doi.org/10.1111/j.2517-6161.1991.tb01857.x
- 20) L. McInnes, J. Healy and J. Melville: arXiv:1802.03426, (2018), https://arxiv.org/pdf/1802.03426.pdf?kl=viewed, (accessed 2018-09-02).
- 21) M. G. Genton: J. Mach. Learn. Res., 2 (2001), 299. https://dl.acm.org/doi/abs/10.5555/944790.944815
- 22) A. Radford, L. Metz and S. Chintala: arXiv preprint arXiv:1511.06434, (2015), https://arxiv.org/pdf/1511.06434.pdf%C3, (accessed 2016-01-07).

