Special Issue on "Lamellar Structure in Structural Metallic Material and Its Mechanical Property"
δ–pearlite Reaction by Carburization in Fe–Cr Binary Alloy
2022 Volume 62 Issue 2 Pages 313-320
Details
2022 Volume 62 Issue 2 Pages 313-320
The eutectoid transformation of δ-ferrite → γ-austenite + carbide by carburization was studied comprehensively with Fe–Cr binary alloy. It was observed that δ-pearlite consisted of γ-austenite and M23C6 carbide formed with unidirectional lamellar structure parallel to the carburization direction, and consequently the γ-austenite transformed to α’-martensite on quenching. The reconstruction of the parent γ-austenite orientation revealed that the both of austenite and M23C6 phases have a preference growth along [011] direction while keeping a cube-on-cube orientation relationship within δ-pearlite. The growth rate of δ-pearlite followed parabolic kinetics, and thus, the interlamellar spacing of δ-pearlite was gradually increased according to the Zener-Hillert model. Furthermore, the δ-pearlite formation mechanism was discussed under PE (para-equilibrium), NPLE (non-partitioning local equilibrium), and PLE (partitioning local equilibrium) conditions. As a result, it was concluded that the PLE model with long-range Cr diffusion through the interface diffusion is dominant, which leads to the redistribution of Cr between austenite and M23C6 at the eutectoid reaction front.
In general, pearlite is regarded as the eutectoid transformation product through the decomposition of γ-austenite and characterized as fine lamellar structure composed of α-ferrite and cementite. Due to the fine lamellar structure, pearlite exhibits a good mechanical property, e.g., high strength associated with large work-hardenability. Although many researchers have investigated the strengthening mechanism of pearlite while considering the lamellar structure, the details are still unclear because of its complex hierarchal substructure.1,2,3) Since pearlite nodule prefers to grow isotopically within the austenite matrix mainly by edgewise growth mechanism, pearlite colonies where cementite lamellae lie with an identical direction are irregularly developed through pearlitic transformation. Consequently, pearlite has the multidirectional lamellar alignment, which makes it difficult to understand the deformation behavior of pearlite.
On the other hand, it is interesting to be reported that eutectoid transformation from δ-ferrite to γ-austenite and alloy carbide takes place by carburization in Fe–M binary alloy (M = Cr, W, Mo, V, Ti) at 1100–1600 K.4) This eutectoid transformation is induced by C absorbed from surface, which leads to formation of unidirectional lamellar alignment parallel to the C diffusion in the carburized layer. The transformation product with unidirectional lamellar structure formed by carburization is termed as δ-pearlite and might be more appropriate as a model material in order to investigate microstructure-property relationships in lamellar pearlite.
Nishizawa et al.4,5,6) had conducted the basic studies on carbide morphology, transformation rate, and so on, in various Fe–M–C ternary systems. However, the analysis is limited, especially the interfacial equilibria at pearlite growth front has remained unclear, although it might affect the microstructure and properties of δ-pearlite. The formation of δ-pearlite is progressed by two different processes of C diffusion; the first process is the C absorption from the surface to core of the carburized material, and the second one is the C redistribution between γ-austenite and alloy carbide on the eutectoid reaction front. In particular, the C redistribution is sometimes accompanied by the slow diffusion of substitutional M, which may have influences on not only the transformation rate on but also interlamellar spacing and carbide morphology in δ-pearlite. Therefore, in order to control the unidirectional lamellar structure in δ-pearlite, it is necessary to understand the C and/or M redistribution behavior in δ-pearlite reaction.
The objective of this work is to present details investigation on metallography and crystallography of the δ-pearlite formed in a carburized Fe–Cr alloy, as well as the growth kinetics of carburized layer and eutectoid reaction. In particular, the phase stability and the interface compositions among δ, γ, and alloy carbide phases were calculated by CALPHAD formalism. And then, the growth mechanism of δ-pearlite was thermodynamically analyzed with Zener-Hillert model7,8) under PE (para-equilibrium), NPLE (non-partitioning local equilibrium), and PLE (partitioning local equilibrium) conditions.
The material used in this study was a ferritic stainless steel with chemical composition of Fe–18 mass% Cr, because it was reported in the previous study that δ-pearlite is developed with lamellar structure in Fe–Cr–C system.4) After hot-rolling and subsequent homogenization at 1473 K for 86.4 ks, cubic specimens with the volume of 8 × 8 × 8 mm3 cut from the homogenized material were set in an alumina crucible together with graphite and Na2CO3 power mixture in the ratio 4:1. And then, they were subjected to solid carburization by annealing at temperature range from 1223 K to 1373 K for various periods in an atmospheric furnace, followed by water-quenching. The outline of δ-pearlite reaction induced by carburization can be understood with the phase diagram. For example, Fig. 1 is the isothermal section of Fe–Cr–C ternary phase diagram of Fe‒rich part at 1273 K calculated by Thermo-calc (TCFE9). When the C concentration in the material is increased by the carburization, as indicated by the black arrow, the equilibrium phase is changed; δ-ferrite → γ-austenite + carbide.
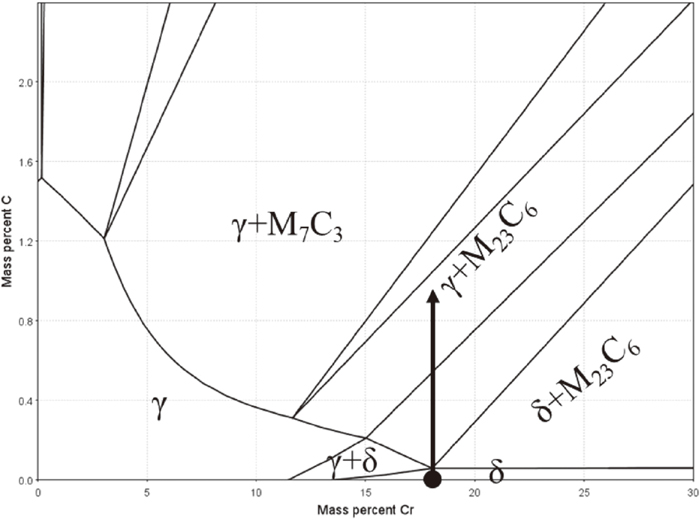
Isothermal phase diagram of the Fe–Cr–C ternary system at 1273 K.
After the carburization at various temperatures, a center part of the cubic specimens was cut, and then the cut surface was prepared in the usual polish-etching way for the following characterization. The thickness of carburized layer was metallography measured by optical microscopy (OM), and the interlamellar spacing was measured by the selected average minimum spacing of d-pearlite growth front under scanning electron microscopy (SEM, JSM-7001F developed by JEOL Ltd.). Energy Dispersive X-ray Spectroscopy (EDS, JED-2300 developed by JEOL Ltd.) was conducted for mapping the distribution of alloy composition across the reaction interface. Electron back-scattered diffractometry (EBSD) was employed by using the software produced by TSL to identify the crystal orientation of composing phases. Hardness profiles along carburization direction were also measured by Vickers hardness indenter.
2.2. CALPHAD Method and Interfacial CompositionThe molar Gibbs free energy of δ-ferrite
| (2.1) |
| (2.2) |
To predict the chemical potentials and the interface compositions of individual components i at the eutectoid reaction front in LE and PE models, it is necessary to separately consider both δ/γ and δ/M23C6 phase boundaries with respective tie-lines connecting the compositions of interface. For the LE condition of δ/γ, the partial Gibbs energies of the substitution atoms (Fe and Cr) and the chemical potentials of C were related to Eq. (2.3).10) However, during the LE calculation of δ/M23C6, it was impossible to extract the components chemical potentials of M23C6,
| (2.3) |
| (2.4) |
The PE condition for δ/γ requires an identical site fraction of M (Cr or Fe), as well as chemical potentials of C and substitution element M (Cr and Fe), i.e., Eq. (2.5). It should be noted that the chemical potential of C is the constituent elements of particular phase and thus while equality of chemical potential of C across the interface occurs for both LE and PE, although the concentration of C is not the same for the two modes of transformation. Mathematic treat on PE condition of δ/M23C6 was in an analogous manner to Michal et al.,11) while the molar Gibbs energy of M23C6 carbide phase were expressed in terms of substituting the chemical potential of δ phase with that of carbide phase, as presented in Eq. (2.6).
| (2.5) |
| (2.6) |
All these sets of LE and PE nonlinear equations were calculated out on MATLAB by using the Newton-Raphson iteration method, and the thermodynamic parameters in this work were taken from A.V. Khvan et al.9)
Metallographic examination of the specimen carburized at 1273 K for 72 ks is presented in Fig. 2. Figure 2(a) shows the whole cross-section of the carburized specimen, which reveals that the carburized layer decorated the surface of the cube specimen with a regular thickness. The carburized layer was growing toward coarse-grained ferrite matrix with relatively smooth interface, as indicated in the OM image of Fig. 2(b). It was also confirmed that the carburized layer near the specimen surface tended to be etched more deeply. Microstructural factors varied depending on carburization time, such as phase fraction and chemical compositions of constituent phases, may influence the corrosion resistance of the carburized layer, although the reason has been unclear. Furthermore, when we looked at the growth front corresponding to the area surrounded by black line using SEM, it was observed that lamellar structure develops while keeping the lamellae parallel to the growing direction, as shown in Fig. 2(c). These observation results suggest that carburized layer is formed by δ-pearlite reaction; δ → γ + carbide, and δ-pearlite has unidirectional lamellar structure in Fe–Cr–C system, as reported in the previous studies. The volume fraction of carbide in the δ-pearlite at the reaction front was evaluated at approximately 0.18 by linear intercept method. Figure 2(d) presents Vickers hardness profile along carburizing direction across the reaction front in the carburized specimen. The position of carburized layer measured by SEM observation is indicated by the dashed line. The hardness of δ-pearlite reaches to high value over 900 Hv at the vicinity of the specimen surface and gradually decreased as carburized depth increases. And consequently, the high hardness suddenly drops when it crosses the δ-pearlite reaction front. To evaluate the elements distribution at δ-pearlite reaction interface, EDS mapping measurement was conducted across the interface and the results are shown in Fig. 3, where (a) and (b) indicated the site fraction of Fe and Cr profiles along white lines in SEM image, respectively. The mapping clearly proves that both Cr and C were highly concentrated in carbide lamellae and the site fraction of Cr was measured to be 0.55 at the vicinity of the growth front, as shown in (a). However, the clear diffusion field was hardly observed in the δ-ferrite. it can be understood that the redistribution of substitutional Cr atom took place in the δ-pearlite reaction, as discussed later.
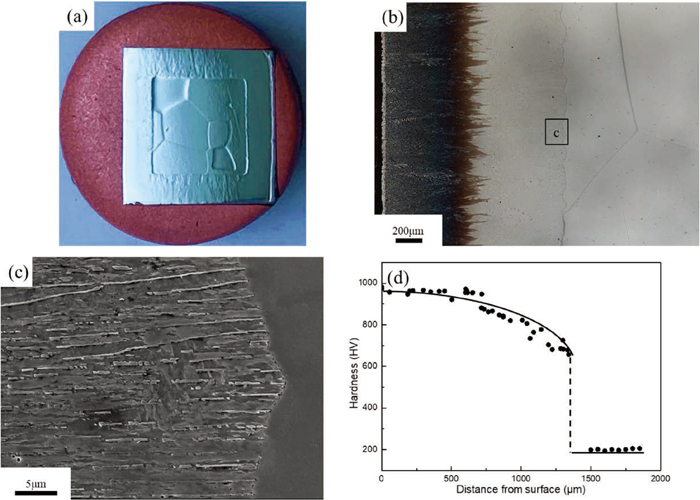
Images of specimen carburized at 1273 K for 72 ks, (a) overall area of the cross section, (b) OM and (c) SEM images of the reaction front of δ-pearlite. (d) hardness profile along carburization direction. (Online version in color.)

EDS mapping result of the reaction front of δ-pearlite. (Online version in color.)
Relation between the square of δ-pearlite thickness l2 and the carburization time t in all temperature ranges is shown in Fig. 4(a). Linear relationship was well established between them in each temperature, which means that the growth of δ-pearlite follows parabolic law. Solid state carburization kinetics are usually interpreted within the framework of Wagner’s internal oxidization theory,12) although the mechanism of reactive elements present and carbide precipitation cases are more complex.13) According to Wagner’s model, the time dependence of δ-pearlite thickness in the carburization process can be described with a parabolic constant k in the simple formalism of Eq. (3.1).
| (3.1) |
| (3.2) |
| (3.3) |
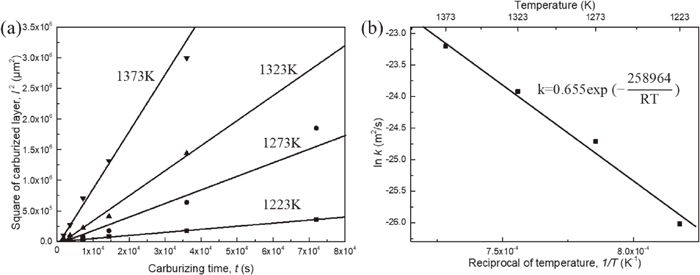
(a) Variation of square of carburized thickness with carburizing time. (b) Arrhenius plot of parabolic rate constants for carburization, the expression shown is determined from a linear regression fit.
EBSD is very useful to identify crystal structure and orientation of crystalline materials in microscopic scale while taking microstructure into account. Therefore, the crystallographic features of δ-pearlite near the growth interface were characterized using EBSD technique. In the phase map of Fig. 5(a), bcc and M23C6 carbide are colored as red and green, respectively, and high angle grain boundaries with misorientation higher than 15 degrees are indicated by black lines. This phase map reveals that lamellar δ-pearlite consisted of fine-grained bcc and M23C6 was growing toward the δ-ferrite matrix. Considering that δ-ferrite decomposes to γ-austenite and carbide through carburization in terms of thermodynamics (see Fig. 1), it can be understood that γ-austenite had formed via δ-pearlite reaction at carburization temperature and consequently transformed to α’-martensite on quenching, leading to the high hardness in δ-pearlite. This implies that solute C concentration in γ-austenite in δ-pearlite was insufficient to thermally stabilize γ-austenite at ambient temperature. The corresponding IPF maps of bcc and M23C6 are shown in Figs. 5(b) and 5(c), respectively. Here, the orientation parallel to the growth direction was displayed in both maps. The α’-martensite in δ-pearlite is characterized as very fine structure with various martensite variants, and the morphology looks like lath martensite. While M23C6 lamellae have an identical orientation, and the growth direction is nearly parallel to <011>. Recently, it is reported that parent austenite orientation can be analyzed and reconstructed from transformed martensite using EBSD-based orientation data numerically,14,15) if a specific orientation relationship is held between them. Therefore, the parent austenite orientation was analyzed under Kurdjumov-Sachs (K-S) orientation relationship ([111]γ//[011]α’, [101]γ//[111]α’) and the corresponding IPF map of fcc was reconstructed in Fig. 5(d) by using the source code developed by T Nyyssönen.16) Although some parts were assigned to the austenite with the different orientation maybe due to calculation errors, the major part of the reconstructed austenite has the same orientation, which reveals that δ-pearlite in the observed area was with a pearlite colony. It should be noted here that austenite in δ-pearlite was preferentially orientated while having <011> parallel to the growth direction, similarly to M23C6 carbide.
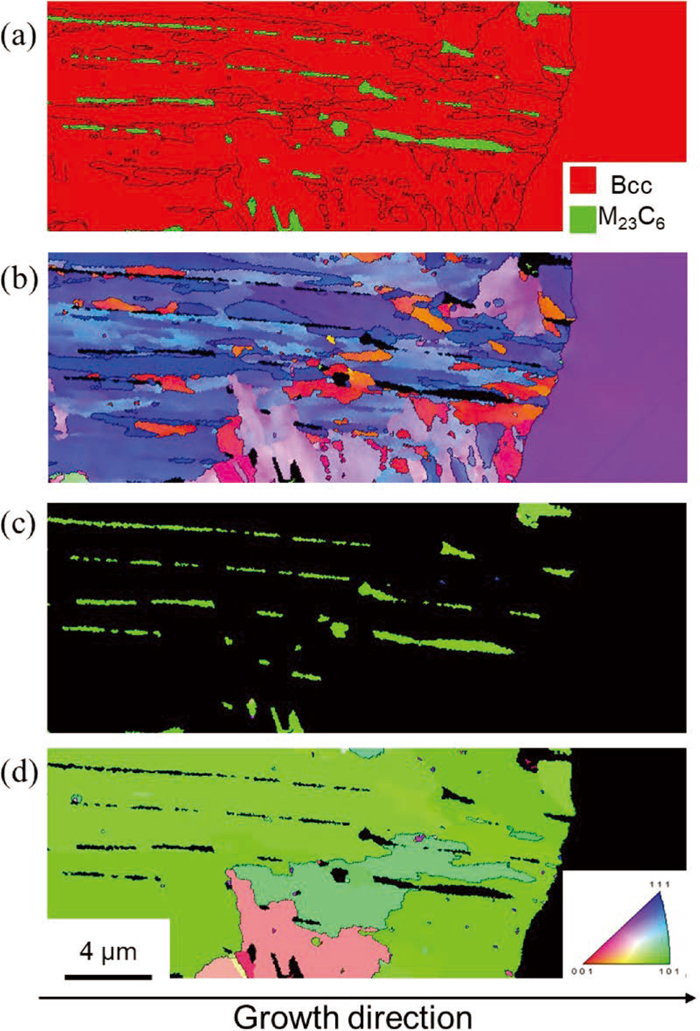
EBSD images of δ-pearlite reaction front in the specimen carburized at 1273 K for 72 ks: (a) phase map, corresponding IPF maps of (b) bcc and (c) M23C6. (d) IPF map of fcc reconstructed from bcc in δ-pearlite under K-S orientation relationship. (Online version in color.)
In order to analyze the orientation relationship between the parent austenite and M23C6 in more detail, (001) pole figures of (a) martensite, (b) M23C6 carbide, and (c) reconstructed parent austenite were plotted in Fig. 6, which correspond to the data shown in Figs. 5(b), 5(c), and 5(d), respectively. As for austenite, the miscalculated data were excluded. The (001) pole figure of martensite (a) tends to exhibit a specific pattern that reveals K-S orientation relationship.17,18,19) In addition, the reconstructed austenite shows the corresponding pole figure expected from K-S orientation relationship, which proves that the austenite reconstruction program was operated correctly (c). Comparing the reconstructed austenite (c) with M23C6 carbide (b), it was found that they exhibit the same orientation. The crystallographic analysis suggests that austenite and M23C6 in δ-pearlite held cube-on-cube orientation relationship. On the other hand, (001) of δ-ferrite, which is additionally highlighted by red points in Fig. 6(a), was independent of that of α’-martensite. This reveals that δ-ferrite did not have a specific orientation relationship with neither austenite nor M23C6, and δ-pearlite grew via edgewise growth mode with an irrational interface.
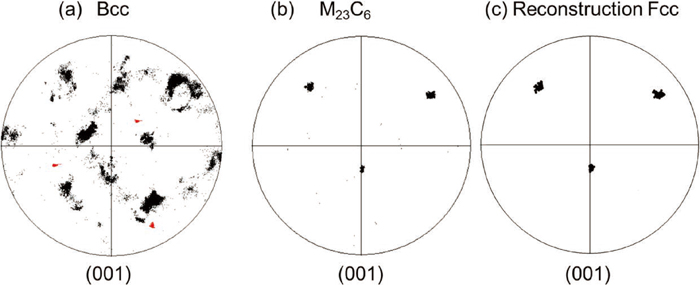
(001) pole figures of constitute phases of δ-pearlite: (a) bcc, (b) M23C6, and (c) reconstructed fcc, which correspond to Figs. 5(b), 5(c), and 5(d), respectively. The orientation of δ-ferrite in front of the reaction interface is represented by red points in Fig. 6(a). (Online version in color.)
Sakuma et al.6) also reported that cube-on-cube orientation relationship is satisfied between austenite and M23C6 in δ-pearlite, and both phases growth in the [110] direction with (111) lamellar interface according to the result of microstructural observation with a transmission electron microscope. Although the orientation of lamellar interface had not been identified in the present study, it can be concluded that lamellar δ-pearlite has specific crystallographic features, which is similar to pearlite in Fe–C alloys.
3.3. Growth Kinetics of δ-pearliteDiffusional eutectoid lamellar growth is accomplished entirely by solute diffusion along the advancing reaction front, as schematically illustrated in Fig. 7(a). This illustration points out that the growth velocity of the δ-pearlite v is affected by the diffusion distance, i.e. interlamellar spacing S. Considering the experimental result that parabolic law is established in the thickness of δ-pearlite l (see Fig. 4), it is expected that v and S are cooperatively decreased with increasing carburization time t. Therefore, the relation between v and S is represented in a double logarithmic chart of Fig. 7(b). Here, S was measured at the vicinity of the reaction front by SEM observations, and v was evaluated by Eq. (3.2). They have good liner relationship with an identical gradient n (vSn = constant), which suggests that the kinetics of δ–pearlite can be discussed by Zener-Hiller model based on the illustration of Fig. 7(a). Another important thing in Fig. 7(a) is that if C activity at δ/M23C6 front is higher than that at δ/γ front, δ-pearlite never undergoes, because C flux is driven by the difference in C activity. Therefore, in order to understand the δ-pearlite reaction kinetics, it is necessary to discuss C activity at interfaces on the basis of PE and LE theories.
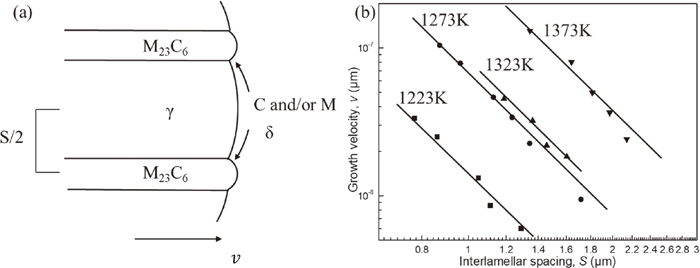
(a) Schematic illustration for δ-pearlite growth front (b) log-log plot of growth velocity and interlamellar spacing at various temperatures.
The calculated isothermal (a) PE and (b,c) LE phase diagrams combined with phase boundaries of δ/M23C6 (red solid lines) and δ/γ (black solid lines) of Fe–Cr–C ternary system at 1273 K are shown in Fig. 8. Here, the fraction of Cr was arranged with the unit fraction, which corresponds to the site fraction of substitutional elements. Especially for M23C6, three sublattice were considered. It had been already confirmed that these phase diagrams correspond to that calculated by Thermo-calc with TCFE9. Let’s see the PE condition in Fig. 8(a) first, where the Fe and Cr are strictly immobile in whole specimen, so that the u-fraction of Cr keeps strictly 0.1907 (18 mass%) as the bulk composition. Therefore, the tie-lines are vertically connecting in both δ/M23C6 and δ/γ equilibria, and then the corresponding interface conditions of phases are uniquely locked at intersection points to the phase boundaries. It is obvious that C activity of δ-ferrite in front of M23C6 carbide,
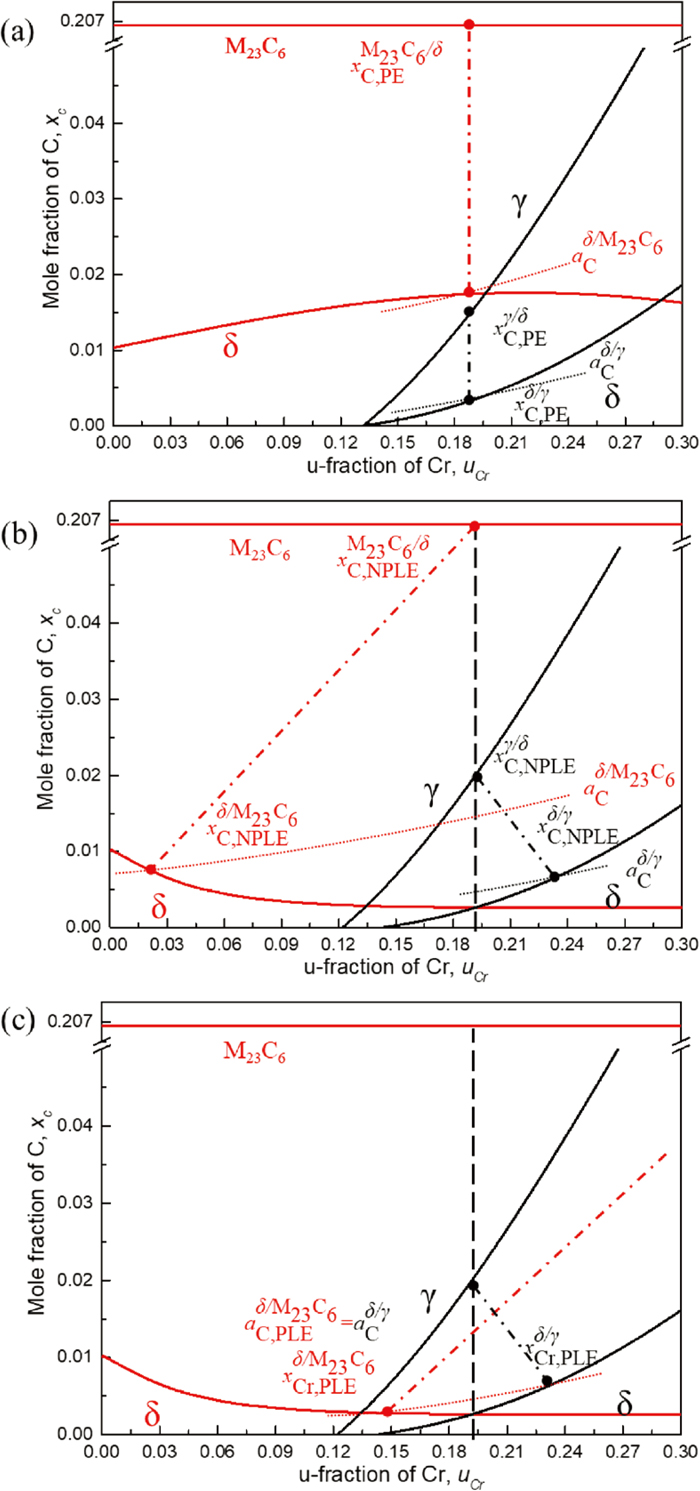
Calculated isothermal phase diagram combined with δ/M23C6 (red) and δ/γ (black) two-phase equilibria in the Fe–Cr–C ternary system at 1273 K. Solid, dot-dash, and dot lines are phase boundaries, tie-lines, and C iso-activity lines, respectively. (a) PE, (b) NPLE, and (c) PLE conditions. (Online version in color.)
Considering that Cr concentrated into M23C6 at the growth front significantly (see Fig. 3), it is thought that the tie-lines of δ/M23C6 and δ/γ in (b) should be shifted to right and left, respectively to satisfy the
| (3.4) |
| (3.5) |
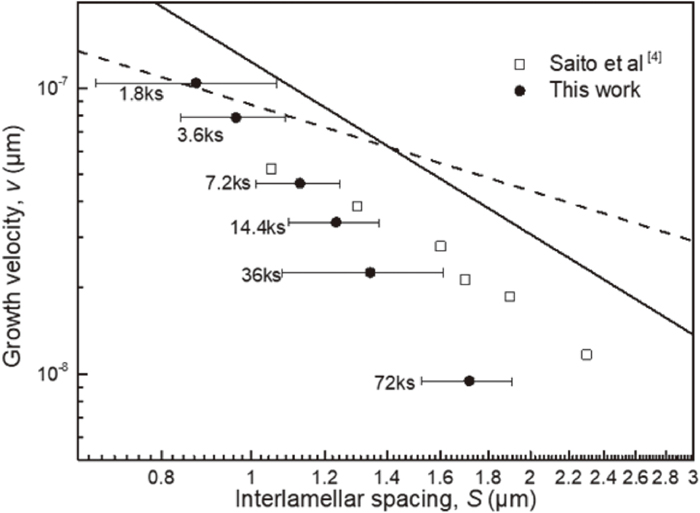
Comparison experiment data with boundary (solid) and volume (dashed) diffusion model prediction at 1273 K.
Comparing the calculated result with the experimental one, the interlamellar spacing dependency of the growth velocity tends to correspond to Eq. (3.5), although the v is relatively lower than vB. This calculation clearly demonstrates that the growth of δ-pearlite is controlled by boundary diffusion of Cr. Saito et al. reported that n is close to −2 similarly to the present study, but they concluded that it is controlled by volume diffusion of Cr.4) The different conclusion from ours may be because they did not consider the effect of temperature on eutectoid transformation. When Zener-Hillert model is applied to conventional pearlitic transformation, the difference in transformation temperature, i.e. the degree of supercooling, is assumed to be proportional to the inverse of interlamellar spacing. Therefore, n = −2 means volume diffusion in Fe–C pearlite formed at different temperatures, but boundary diffusion in isothermal δ-pearlite. Indeed, the macroscopic diffusion field of Cr was hardly observed in Fig. 3. As discussed above, we calculated the interface compositions based on the models of PE, NPLE and PLE with Fig. 8. PE and NPLE models are essentially thought as specific conditions to enhance transformation rate due to the fast C diffusion. However, the growth of δ-pearlite caused by carburization is driven by C diffusion in carburized layer, and the growth velocity becomes sufficiently lower according to parabolic kinetics except for the early stage of carburization process. Therefore, PLE model is dominate for the δ-pearlite reaction under any carburization condition and the operating tie-lines of δ/M23C6 and δ/γ may be varied as dependent variable to make vB equal to v. The difference between
To deepen understanding of the unidirectional lamellar structure of δ-pearlite, the mechanism of the eutectoid transformation from δ-ferrite to γ-austenite and carbide phase was investigated in carburized Fe–18 mass% Cr binary alloy. Especially, the growth kinetics of δ-pearlite was discussed according to Zener-Hillert model while taking into account interface composition in Fe–Cr–C system with para- and local-equilibrium theories. The obtained results are as follows;
(1) Lamellar structure consisted of γ-austenite and M23C6 carbide is formed by carburization and the lamellar alignment is arranged to be parallel to the carburization direction. Furthermore, the lamellar γ-austenite transforms to α’-martensite on quenching after carburization leading to very high hardness.
(2) The parent γ-austenite keeps cube-on-cube orientation relationship with respect to M23C6 carbide and they have a preferential growth direction of [011].
(3) The growth of δ-pearlite is mainly controlled by C diffusion in γ-austenite of δ-pearlite, which results in the parabolic growth of δ-pearlite. As a result, the growth velocity of δ-pearlite gradually decreased with the interlamellar spacing increased as carburization time increases.
(4) The growth of δ-pearlite is accompanied with long-range Cr diffusion. According to Zener-Hillert model, the relation between interlamellar spacing and the growth velocity of δ-pearlite suggests that the redistribution of Cr between γ-austenite and M23C6 carbide is caused by interface diffusion.
This work was supported by KAKENHI Grant-in-Aid for Scientific Research on Innovative Area (19H05121).